
 ?Mathematical formulae have been encoded as MathML and are displayed in this HTML version using MathJax in order to improve their display. Uncheck the box to turn MathJax off. This feature requires Javascript. Click on a formula to zoom.
Abstract
Rapid urbanization and land use transformation coupled with climate change impact are witnessed for development urban heat island worldwide and make it major environmental concerns for human health. National Capital Region (NCR) is one of the fast sprawling National Capital city of India. The aim of the present study is to explore the spatial changes in major biophysical parameters of city over last 20 years from 2000 to 2020 using satellite data. The spatial variation in the land surface temperature and its relation with Land use, NDVI and Built-up area were evaluated and discussed in the present work. The major changes were observed in minimum and maximum temperature of the city, in 2000 minimum temperature was 23.20 °C and maximum 34.85 °C, which increased to 26.31 and 39.92 °C in 2010; and 31.70 to 44.74 °C in 2020 . Normalized differential vegetation index (NDVI) decrease from 82 to 62%, Non-Vegetated area has reduced to 62% from 82% due to fast urbanization and land transformation in last two decades. Barren and fallow land also reduces about 27% in last two decades and built-up area also shown increasing trend . The spatial changes in biophysical parameter of the city clearly indicated that NDVI, NDBI and Land use/land cover charges are the main driving forces for development of urban heat island in the city and many health issues related to heat waves are already reported in the city along with many other negative impacts on natural landscape and resources. The observations from present work will be very useful scientific information to understand the causes of elevated land surface temperature and mitigation measures. Results could be used by policy makers to develop the suitable model for long term sustainability of the cities.
1. Introduction
Urban population has been increased very fast in recent past specially in developing nations. According to UN reports, around 55% of the population belongs to urban area, and it will be increase 70% by 2050. Rapid urbanization is one of the leading factors for determining the changes in the physical landscape, and key influencing factor in the regional climate change as well as local environmental effect on quality of life and human health.
The major indicators of urbanization can understand with the change in surface temperature in cities compare to rural area, and anthropogenic changes in land use practices. Urban setup are always warmer than neighbour rural area (Chakraborty and Srivastava 2015).
As discussed in many research papers; the temperature of the cities are always higher than the open and rural areas and termed as urban heat Island (UHI) and; the most promising factor responsible for elevated temperature in urban environment is land use/land cover changes (Singh et al. Citation2017; Karakuş Citation2019)
Large number of case studies have been carried out globally for estimation of land surface temperature using different data sets and methodology from thermal sensors. Li et al. (Citation2013) worked on comprehensive study for land surface temperature and development, they discuss on various developments in land surface temperature estimation methodology and data processing methods. Many global cities were experienced the massive land-use/land cover change in the last few decades and their impact on urban ecosystem including air pollution, congestion, land degradation and development of urban heat island. (Yan et al. Citation2016; Liu et al. Citation2020).
One of the major concerns in developing urban area is the extensive development of impervious surface, such as residential, commercial buildings roads, parking lots pavements (Haase and Nuissl Citation2007; Chaudhuri et al Citation2017, Citation2018). The concrete surface acts as a reflector where the dense air absorbs the radiated heat, elevates the surrounding temperature in the absence of dense Vegetation, and creates an urban heat island effect (Voogt Citation2002; Watkins et al. Citation2007).
The trend of urbanization in India is critical, around 3.3% of decadal growth in urbanization between 2001 and 2011. Based on the 2011 census, 31.2% of the Indian population is residing in the urban area, and in 2020 the percentage raised to 34.4% (UN DESA 2014). By 2030, cities with more than 1 million populations will grow from 42 to 68. (McKinsey Global Institute Citation2010; Bhagat Citation2011; Heilig Citation2012); Out of 4000 cities and towns in India, 46 has more than 1 million population and major cities of India such Delhi, Mumbai, and Bangalore, have population more than 8 million (Urban Planning Capacity India, Sep 2021).
A more number of significant studies analyze the urban heat island effect with changing land use patterns in urban areas using earth observation data sets (Guha and Govil Citation2020; Rahaman et al. Citation2020; Shastri et al. Citation2020; Hussain and Karuppannan Citation2021). It is found that anthropogenic activity and land use practices along with continuous decrease in vegetation cover causes the increase of land surface temperature (Rosenfeld et al. Citation1995; Rahman Citation2007; Noyingbeni et al. Citation2016; Singh et al. Citation2017; Schulz et al Citation2018; Wang et al. Citation2018; Abhijit and Kumar 2019; Dutta et al. Citation2019; Nuissl and Siedentop Citation2021).
Some of very recent studies from Indian cities also used satellite data for monitoring the long-term changes in land use practices and their negative impact on environment and natural resources of the city and elevated land surface temperature.
Thermal satellite data to estimate the land surface temperature of mangrove forest of Sundarbans, Northeast coast of India and found that the biophysical parameters such as vegetation cover and land use practices controlling the spatial variation in land surface temperature. Mohammad and Goswami (Citation2021) worked on impact urbanization and development of urban heat island considering long term satellite data to develop the relationship between spatial temperature variation and land use practices.
The present work uses the recent satellite data including the period of COVID-19 and results shown significant changes in the urban environmental factors such as NDVI, NDBI and Land Use changes. Continue expansion in Urban landscape and persistent increase in complex anthropogenic activity, and land use change pattern in the urban and sub -urban area have very negative impact on land surface temperature and human health. To quantify the changes in periodic manner and to understand the spatio-temporal relation, motivate to carry out such investigations.
In the present investigation, the long-term change in the land surface temperature over Delhi by considering the land use/land cover change, changes in vegetation cover and built-up area has been analyzed using Landsat thermal data and filed data. The result of this study will be very useful for developing the correlation of urban heat island and climate change triggered due to urbanization and other anthropogenic factors. The outcome of the study also helps for sustainable urban development and designing the policy document.
2. Study area
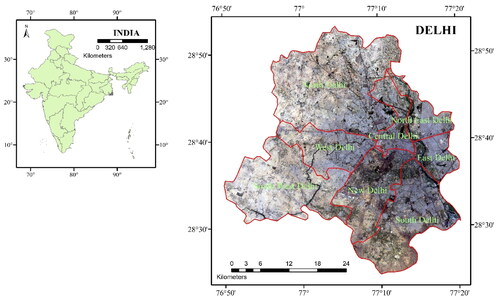
Delhi is an ancient city established along the banks of the river Yamuna during the Mughal Kingdom. It is situated between latitudes 28°24′17″N and 28°53′45″N and longitudes 76°51′00″E and 77°20′30″E (). Delhi Metropolitan City has an area of 1490 km2 and as per the estimates of UN world Population prospects, the population of Delhi NCR is 1.03 crores and estimated population for Delhi in 2022 is around 32,065,760 and have high density of urban built-up, it has extensive vegetation cover in central Delhi.
Figure 1. Location of Delhi Metropolitan City.
The weather of Delhi ranges from severe hot in summers (May–June) to severe cold during winters (Dec–Jan). Temperatures range from a high of 45 °C to a low of up to 3 °C. Rainfall is during the Monsoon Season of July–September, with average rainfall recorded from 400 to 600 mm. The weather of Delhi Metropolitan City has changed from Dry and Hot to Humid and Hot. Being one of the highly polluted cities globally, particularly atmospheric pollution also make the city more vulnerable. Smog is often seen during the winter months, which causes loss of visibility and associated health problems. Scattered thick Vegetation is seen along the river Yamuna. However, the river has been virtually converted into a drain with very low oxygen content and high contamination due to pollution.
3 Data used and methodology
The data sets used in the present work are mainly Landsat thermal data sets with various band combination with the 30-m spatial resolution, which are very useful for extracting and mapping of biophysical parameters of the city. The data sets are generally taken for the month of May, which gives more clear information about earth thermodynamic features. The details of the data sets used in the work mentioned ().
Table 1. Primary data used.
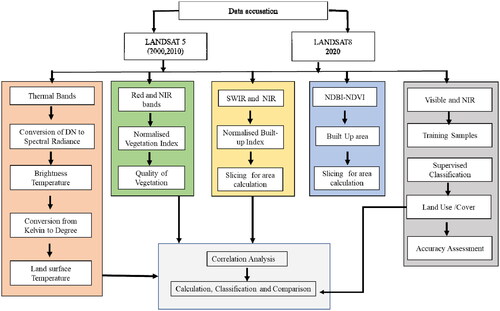
3.1. Methodology followed for calculation LULC, NDVI, LST, and NDBI
The Important variables such as Landuse/Land cover, Normalized Differential Vegetation Index (NDVI), Normalized Differential builtup Index (NDBI) and Land surface Temperature were used to develop their spatial and temporal relationship between the parameter. The detail details methodology followed in the present work are mentioned ().
Figure 2. Methodology adopted for the study.
3.1.1. Pre-processing of data
The Landsat satellite data for three years, i.e., 2000, 2010 and 2020 in the month of May was downloaded from the USGS website. Images were re-projected to UTM WGS 1984 Zone 43N projection. Histogram equalization was carried out to improve visual interpretation. After that, mosaicked image were stacks and created in ERDAS Imagine software. Delhi Metropolitan City boundary shapefile, Area of Interest (AOI) subsets were created. Thermal Bands were used individually for LST calculations, and stacks were not created.
3.1.2. Land use and land cover (LULC) mapping
Land use and land cover mapping depict an accurate measure of how resources are being utilized and the change in their spatial pattern .It is essential to know the natural characteristics, extent and location, quality, productivity, suitability, and limitations of various land uses for sustainable development (Chawla Citation2012; Sussman et al. Citation2019).
LULC maps of the area were mapped to study the urban growth over the last 20 years and correlated with vegetation cover and water bodies. The supervised classification technique used to make the land use/land cover of the area. The major land use classes are classified into five group: water bodies, thick vegetation, built-up area, dense built-up, and barren/fallow land. The area under each class and changes from 2000 to 2020 was calculated to analyze the spatial-temporal changes.
3.1.3. Normalized difference vegetation index (NDVI) mapping
Normalized Difference Vegetation Index (NDVI) is used to quantify the vegetation cover and changes over 20 years. The efficient evaluation of urban greenness helps to attain sustainable urban planning and management of urban ecosystems(Fatemi and Narangifard Citation2019; Guha et al. Citation2020; Shastri et al. Citation2020). The application of remote sensing technology for mapping plant biomass has enormously increased in recent years and attributed to the availability of a variety of medium and high-resolution satellite imageries (Chen et al. Citation2006). NDVI measures vegetation cover by measuring the difference between Near-Infrared Band and Red Band. According to this index, green Vegetation reflects near-infrared lights more than red lights in the visible spectrum and absorbs the red lights. This index is widely used to study vegetation density.
(1)
(1)
As per the index values are normalized, the scale for the index range from +1.0 to −1.0 and the area having barren rock, sand, or snow usually show very low NDVI values (0.1 or less). Sparse Vegetation such as shrubs and grasslands or crops may result in moderate NDVI values (approximately 0.2–0.5). High NDVI values (approximately 0.6–0.9) correspond to dense vegetation cover.
NDVI Density maps prepared for all 3 years for the study area and compared to understand the spatial change .To analyze the dynamics of vegetation cover, density change analysis was carried out.
3.1.4. Normalized difference built-up index (NDBI) and built-up index (BUI)
NDBI facilitates built-up areas to be mapped at a higher degree of accuracy. The main advantage of NDBI is every builtup land has the unique spectral response compare to other land covers. NDBI is used to extract built-up (Guha and Govil Citation2020). The NDBI values ranging from −1 to 1. The formula used to calculate NDBI given below.
(2)
(2)
The following formula extracted the built-up areas
(3)
(3)
The output of NDBI was further refined by removing vegetation noise using NDVI; thus, BUI is the resultant binary image with only the built-up and barren pixels having a positive value, thus allowing built-up areas to be mapped automatically. NDBI approach separates urban areas from barren and bare land.
3.1.5. Land surface temperature (LST) estimation
Land surface temperature (LST) is an essential factor in global change studies (Fatemi and Narangifard Citation2019; Guha and Govil Citation2020; Peng et al. Citation2020; Rahaman et al. Citation2020; Shastri et al. Citation2020; Hussain and Karuppannan Citation2021).
The knowledge of surface temperature is essential to a range of issues and themes in earth sciences to urban climatology, global environmental change, and human-environment interactions (Yuan et al. Citation2019). The rise in LST has many contributing factors like global warming, change in vegetation cover, urbanization and changes in LULC pattern. Physical conditions govern the land surface temperature of any area, i.e., topography, land use and Vegetation, of the city/urban areas. The distribution of Vegetation, built-up, open land, water bodies and other features determines the surface temperature (Chen et al. Citation2006). LST can be estimated using satellite data using the Thermal/Thermal IR bands in a multispectral image. Both Landsat 5 and Landsat have 8 have thermal bands, and LST estimation by converting reflectance into radiance.
3.1.6. LST calculation for Landsat 5 TM and Landsat 8 TIRS
The LST for Landsat 5 and 8 have been calculated according to the prescribed handbook. In Landsat 5, Band 6 (10.40–12.50 μm) is the thermal band, and in Landsat 8, Band 10 and 11 are the thermal bands. Reflectance recorded in the satellite image was converted into radiance at the sensor using the below-mentioned formula. Values of required constants were taken from the image's MTL/Meta Data file. The digital numbers (DNs) of the LANDSAT ETM images were converted to normalized exo-atmospheric reflectance measures based on the method proposed.
(4)
(4)
where Lλ = Spectral Radiance at the sensor's aperture in watts/(meter squared * ster * μm), QCAL = the quantized calibrated pixel value in DN, LMINλ = the spectral radiance that is scaled to QCALMIN in watts/(meter squared * ster * μm), LMAXλ = the spectral radiance that is scaled to QCALMAX in watts/(meter squared * ster * μm), QCALMIN = the minimum quantized calibrated pixel value (corresponding to LMINλ) in DN= 1, QCALMAX = the maximum quantized calibrated pixel value (corresponding to LMAXλ) in DN= 255.
The LST or effective temperature T at satellite was calculated for Band 6 data using markan and baker 1986 formula (Khan Citation2020)
(5)
(5)
Where T = Effective at-satellite temperature in Kelvin, K2 = Calibration constant 2, K1 = Calibration constant 1, Lλ = Spectral radiance in watts/(meter squared * ster * μm)
Reflectance recorded in the satellite image is converted into the top of atmosphere radiance using the below-mentioned formula.
Top of Atmosphere (TOA) Radiance:
Lλ = MLλQcal + AL(6)
Where Lλ = TOA spectral radiance (Watts/(m2 * sr * μm)), MLλ = Radiance multiplicative Band (No 10 & 11), AL = Radiance Add Band (No 10 & 11), Qcal = Quantized and calibrated standard product pixel values (DN).
Spectral radiance data were converted to top of atmosphere brightness temperature using the formula's thermal constants below.
That ρλ′ is not true TOA Reflectance because it does not contain a correction for the solar elevation angle.
This correction factor is left out of the Level 1 scaling at the users' request; some users are content with the scene-center solar elevation angle in the metadata, while others prefer to calculate their own per-pixel solar elevation angle across the entire scene.
(7)
(7)
Once a solar elevation angle is chosen, the conversion to true TOA Reflectance is as follows: where:
ρλ = TOA planetary reflectance. θSE = Local sun elevation angle; the scene center sun elevation angle in degrees is provided in the metadata. θSZ = Local solar zenith angle; θSZ = 90° − θSE
In the end, EquationEq. (2)(2)
(2) is used for calculating the temperature.
4. Results and discussion
To access the environmental variables of urban areas, especially mega cities like Delhi, can be assessed by understanding various components city and its spatial pattern such as land use, vegetation, built-up areas, Temperature variations, impervious surface. The dynamics of Land use/Land Cover over a period of time determine the city's ability to balance its natural ecosystem with its expansion effectively. Changes in vegetation cover, open land and agricultural land, and the corresponding increase in urban areas are good indicators of urban growth but have undesirable impacts on the sustainability of the urban area.
4.1. Land use and land cover change in Delhi
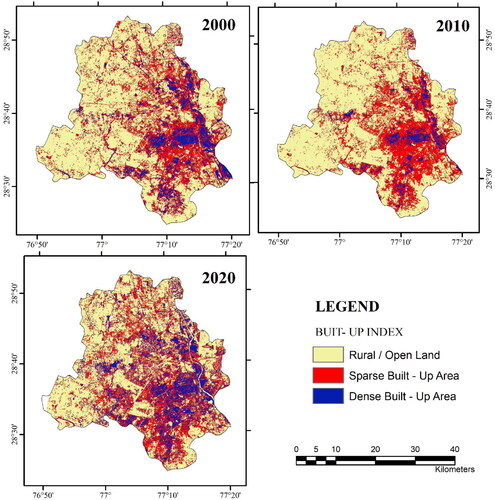
Landsat satellite data using supervised classification were used to extract land use and land cover for 2000, 2010, and 2020 and their spatial change analysis (). The built-up area is separated into low dispersed built-up area and dense built-up area, which benefits to distinguish between the core and periphery of the urban arrangement in the old city of Delhi. It has been observed that over the duration of 20 years, growth in vegetation and dense core built-up area. The core urban area of Delhi is becoming denser with time as the area under dense built-up area is almost doubled from 11 to 20% in the last two decades. As per Census data, the population density was increased from 9340 in 2000 to 11,312 in 2020.
Table 2. LULC changes in Delhi from 2000 to 2020.
Table 3. Built Up Index Area for 2000, 2010, and 2020.
The spatial distribution of various land use categories for the past 20 years is shown (), where the locations like Mukundpur North West district, Mitroan Village in the south-west district Bakhtawarpur in North district of Delhi has shown a drastic change in built-up area density. The water bodies have shown a slight growth in spatial distribution because of adaptation of various surface water management practices to rejuvenate and maintain the water bodies in Delhi; they have increased around 0.14%, i.e., from 11 to 13 km2. Similarly, the vegetation cover also has increased by around 11% in the last two decades. In contrast, the barren land reduced from 35 to 22% due to the compaction of urban areas and the reclamation of land under Vegetation.
Figure 3. Land use and land cover map of Delhi 2000, 2010, 2020.
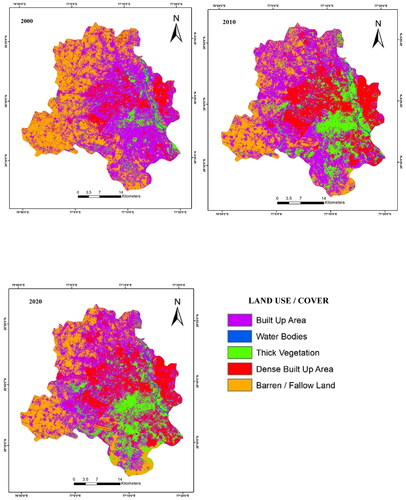
Figure 4. Normalized difference built-up Index of Delhi 2000, 2010, and 2020.
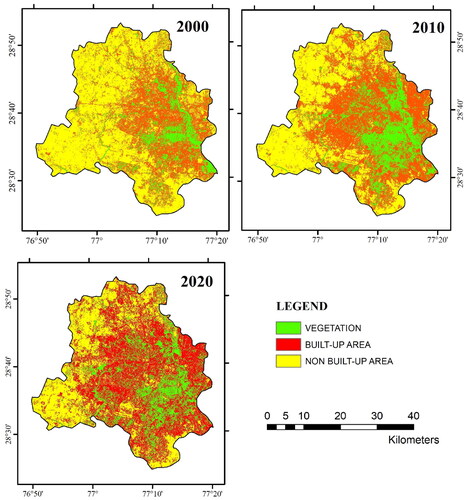
Figure 5. Built-Up Index of Delhi 2000, 2010, and 2020.
4.2. Normalized difference built-up index and built-up index
The NDBI and BUI indexes are spectral based indicators that provide a good estimation of urban built enlargement; it is mainly composed of built-up space. The BUI indicator is derived from deducting the vegetation index from the built-up area.
It can also be observed from , the built-up area in Delhi is constantly increasing, and it is increasing exponentially with passing years. It becomes essential to study the changes within the capital for urban geographers to ascertain the sustainability of living conditions. BUI's spatial interpretation shows growth in the area under the impervious surface in Delhi for 2000, 2010, and 2020 (; ).
The rural and the open land within the periphery of Delhi is declining, which has been reduced to 62 km2 from 900 km2 in the last two decades. On the other hand, the densely built-up area has increased many folds from 164 to 461 km2 in the same period. The same is evident from LULC representation in , which shows how the urban expansion has increased in the past 20 years; the growth is mainly concentrated in the core area near the Central and South districts of Delhi. The NDBI is most dense within a radius of 20 km from New Delhi as the center, which is the old core for the city.
4.3. NDVI and change in green area
The areal extent of the Normalized Difference Vegetation Index (NDVI) for 2000, 2010 and 2020 (; ) shows that the non-vegetated area in Delhi is declined from 82 to 62% since the last two decades. The overall vegetated area is increasing due to government initiatives regarding the plantation of sapling post-2010. This initiative states that the quality of the Vegetation in Delhi is developing, affecting future ecosystem sustainability.
Figure 6. Normalized difference Vegetation Index of Delhi 2000, 2010, and 2020.
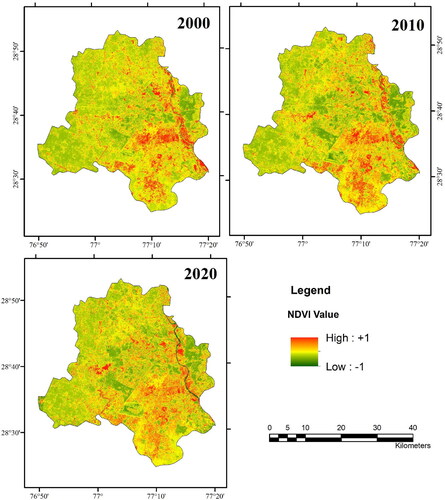
Table 4. Normalized difference vegetation index 2000, 2010, and 2020.
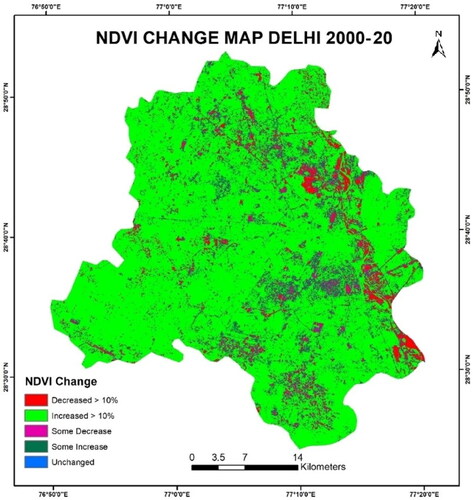
The difference in NDVI for the period between 2000 and 2020 () shows an overall increase of green cover in Delhi between 2000 and 2020, the area under good vegetation cover has lost. The significant portions are the central Delhi, south Delhi ridge area, the banks of Yamuna, near Mitron village in Najafgarh block, showing a decrease in vegetation cover due to encroachment and urbanization.
Figure 7. Normalized difference Vegetation Index Change for Delhi between 2000 and 2020.
4.4. Changing pattern of land surface temperature
Spatio-temporal variation in land surface temperature from 2000 to 2020 has been categorized into five classes as low as 20 °C to and as high as 40 °C. Though the land surface temperature has remained high since the post-1990s, the changes in land use and land cover aggravated the UHI effect in Delhi. In 2000 the area under 20 °C was only around 1.2% where added consequently, in the last two decades, no land surface exists within this range of temperature on the other hand, during 2000, there was no land surface which has more than 35 °C or more. 2010 onwards, the surface temperature below 25 °C got replaced by the region of having temperature range between 25 and 30 °C, which shows an overall increase of local temperature by 5 °C.
The area of surface temperature within the range between 30 and 35 °C is constantly reducing since 2000, and it is reducing with time; if the trend follows, the minimum temperature will keep rising. On the contrary part temperature above 35 °C is gaining more land area with subsequent years 72 and 74% land are added in range 35–40 °C in 2010 and 2020, respectively. Similarly, around 9 and 11% land has been added to the temperature range of more than 40 °C for 2010 and 2020, respectively. Spatial distribution of land surface temperature in Delhi from 2000 to 2020 where it is evident that the area under a temperature below 25 °C is reducing with time and the area under more than 40 °C is gaining land, which is a serious concern for assessing the sustainability of the city ( and ; )
Figure 8. Land Surface Temperature Distribution Delhi 2000, 2010, and 2020.
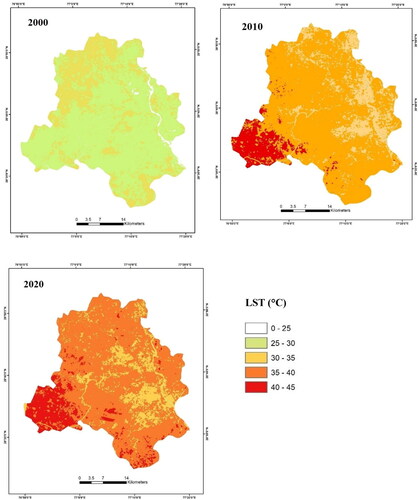
Figure 9. (a) Correlation between LST, NDBI & NDVI for 2000 Data. (b) Correlation between LST, NDBI & NDVI for 2010 Data. (c) Correlation between LST, NDBI & NDVI for 2020 Data.
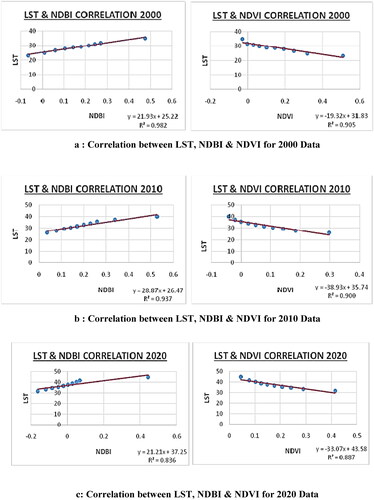
Table 5. Change in temporal distribution of land surface temperature area over Delhi 2000, 2010, and 2020.
Table 6. Comparitive analysis of IMD station data and Landsat derived surface temperature data for Delhi from 2000 to 2020.
4.5. Correlation between NDVI, NDBI, and LST
For establishing a sustainable relationship between the various calculated parameters, a correlation has been computed to analyze the relational trend between the LULC, NDVI, NDBI, and LST (). Karl Pearson coefficient of correlation has been applied; this method facilitates assessing the value of a dependent variable concerning a specific value of an independent variable through regression calculations. It determines the direction of the correlation, i.e., the correlation between the two variables is positive or negative.
The results show a high degree of positive correlation between LST and NDBI (R2 = 0.8369), and a high degree of negative correlation exists between LST and NDVI (R2 = −0.8872). Indicating rise in LST can be attributed to increased urbanization or reduction in vegetation cover in a city and vice versa. The present study shows the significant relationship between the abundance of Vegetation and low surface temperature and an abundance of built-up with high surface temperature.
5. Conclusion
The present study analyzed the long-term land use/land cover change and urbanization and its spatial relation with NDVI, NDBI, and land surface temperature over Delhi area between 2000 and 2020 using temporal Landsat data sets. The results clearly indicates that due to unplanned urbanization and land use practices in the city are initiating the development of urban heat island as seen in the result urban area have higher temperature compare to open and rural area. The quantitative values observed in the assessment shows how the particular land use practices affecting the decrease of vegetation cover and its density and development of high built-up density along with other open and barren land. The major observation from this study is to increase the minimum and maximum temperature in last to decade in the city, which is more than 5 °C in 2000 onwards, although the extensive urban plantations in some of the locations decrease the trend in the city. The present study suggested that the urban temperature, vegetation cover and natural environment must be considered when urbanization process taken place. It is also suggested that the area needs further evaluation by considering high resolution thermal data sets to estimate the hot spot points in the city to mitigate the further deterioration of urban health and greeneries.
Disclosure Statement
No potential conflict of interest was reported by the author(s).
Correction Statement
This article has been republished with minor changes. These changes do not impact the academic content of the article.
References
- Bhagat RB. 2011. Emerging pattern of urbanization in India. Econ Polit Wkly. 46(34):10–12.
- Chakraborty S, Srivastava SK. 2019. A novel approach to understanding Delhi's complex air pollution problem. Econ Polit Wkly. 54(36):32–39.
- Chaudhuri A, singh P, C.Rai S. 2017. Assessment of impervious surface growth in urban environment through remote sensing estimates. Environ Earth Sci. 76:541. 10.1007/s12665-017-6877-I
- Chaudhuri A, Singh P, C.Rai S. 2018. Modelling LULC change dynamics and its impact on environment and water security-geospatial technology based assessment. Ecol Environ Conserv. 24:S292–S298.
- Chawla S. 2012. Land use changes in India and its impacts on environment. J Environ. 01(01):14–20.
- Chen X-L, Zhao H-M, Li P-X, Yin Z-Y. 2006. Remote sensing image-based analysis of the relationship between urban heat island and land use/cover changes. Remote Sens Environ. 104(2):133–146.
- Dutta D, Rahman A, Paul SK, Kundu A. 2019. Changing pattern of urban landscape and its effect on land surface temperature in and around Delhi. Environ Monit Assess. 191(9):551.
- Fatemi M, Narangifard M. 2019. Monitoring LULC changes and its impact on the LST and NDVI in District 1 of Shiraz City. Arab J Geosci. 12(4):127.
- Guha S, Govil H. 2020. Land surface temperature and normalized difference vegetation index relationship: a seasonal study on a tropical city. SN Appl Sci. 2(10):1661. 8.
- Guha S, Govil H, Diwan P. 2020 Monitoring LST-NDVI relationship using premonsoon landsat datasets. Adv Meteorol. 2020, 4539684.
- Haase D, Nuissl H. 2007. Does urban sprawl drive changes in the water balance and policy? The case of Leipzig (Germany) 1870. Landscape Urban Plann. 80(1-2):1–13. –
- Heilig GK. 2012. World urbanization prospects: the 2011 revision. New York: United Nations, Department of Economic and Social Affairs (DESA), Population Division, Population Estimates and Projections Section.
- Hussain S, Karuppannan S. 2021. Land use/land cover changes and their impact on land surface temperature using remote sensing technique in district Khanewal, Punjab Pakistan. Geol Ecol Landsc. 1–13. https://doi.org/10.1080/24749508.2021.1923272.
- Karakuş CB. 2019. The impact of land use/land cover (LULC) changes on land surface temperature in sivas city center and its surroundings and assessment of urban heat island. Asia-Pac J Atmos Sci. 55(4):669–684.
- Khan UA. 2020. Evaluating the impact of expansion on urban thermal surroundings: a case study of Lahore Metropolitan city, Pakistan. Environ Earth Ecol. 20204(1):38–49.
- Li Z-L, Tang B-H, Wu H, Ren H, Yan G, Wan Z, Trigo IF, Sobrino JA. 2013. Satellite-derived land surface temperature: Current status and perspectives. Remote Sens Environ. 131:14–37.
- Liu X, Huang Y, Xu X, Li X, Li X, Ciais P, Lin P, Gong K, Ziegler AD, Chen A, et al. 2020. High-spatiotemporal-resolution mapping of global urban change from 1985 to 2015. Nat Sustain. 3(7):564–570.
- McKinsey Global Institute 2010. India's urban awakening: Building inclusive cities, sustaining economic growth.
- Mohammad P, Goswami A. 2021. Spatial variation of surface urbanheat island magnitude along the urban-rural gradient of four rapidly growing Indian cities. GeocartoInternational. 1–23. https://doi.org/10.1080/10106049.2021.1886338.
- Noyingbeni K, Prafull S, Sudhir Kumar S, Anjana V. 2016. Assessment of urban heat islands (UHI) of Noida City, India using multi-temporal satellite data. Sustain Cities Soc. 22(2016):19–28.
- Nuissl H, Siedentop S. 2021. Urbanisation and land use change. In Weith T, Barkmann T, Gaasch N, Rogga S, Strauß C, Zscheischler J, editors. Sustainable land management in a European context. human-environment interactions, vol 8. Cham: Springer. https://doi.org/10.1007/978-3-030-50841-8_5.
- Peng X, Wu W, Zheng Y, Sun J, Hu T, Wang P. 2020. Correlation analysis of land surface temperature and topographic elements in Hangzhou, China. Sci Rep. 10(1):10451.
- Rahaman S, Kumar P, Chen R, Meadows ME, Singh RB. 2020. Remote sensing assessment of the impact of land use and land cover change on the environment of Barddhaman District, West Bengal, India. Front Environ Sci. 8. https://doi.org/10.3389/fenvs.2020.00127.
- Rahman A. 2007. Application of remote sensing and GIS technique for urban environmental management and sustainable development of Delhi, India. In: Netzband M, Stefanov WL, Redman C, editors. Applied remote sensing for urban planning, governance and sustainability. Berlin: Springer.
- Rosenfeld AH, Akbari H, Bretz S, Fishman BL, Kurn DM, Sailor D, Taha H. 1995. Mitigation of urban heat islands: materials, utility programs, updates. Energy Build. 22(1995):255–265.
- Schulz M, Romppel M, Grande G. 2018. Built environment and health: a systematic review of studies in Germany. J Public Health. 40(1):8–15.
- Shastri S, Singh P, Verma P, Kumar Rai P, Singh AP. 2020. Land cover change dynamics and their impacts on thermal environment of Dadri Block, Gautam Budh Nagar, India July 2020. J Landsc Ecol. 13(2):1–13.
- Singh P, Kikon N, Verma P. 2017. Impact of Land use Change and Urbanization on Urban Heat Island in Lucknow City, Central India. A Remote Sensing Based Estimate. Sustainable Cities and Society. 32:100–114. http://dx.doi.org/10.1016/j.scs.2017.02.018.
- Sussman HS, Raghavendra A, Zhou L. 2019. Impacts of increased urbanization on surface temperature, vegetation, and aerosols over Bengaluru, India. Remote Sens Appl: Soc Environ. 16:100261. 2019ISSN 2352-9385,
- United Nations, Department of Economic and Social Affairs, Population Division 2014. World Urbanization Prospects: The 2014 Revision, Highlights.
- Voogt JA. 2002. Urban heat island. In: Douglas I, editor. Encyclopedia of global environmental change. Chichester: Wiley; p. 660–666.
- Wang Y, Du H, Xu Y, Lu D, Wang X, Guo Z. 2018. Temporal and spatial variation relationship and influence factors on surface urban heat island and ozone pollution in the Yangtze River Delta, China. Sci Total Environ. 631–632:921–933.
- Watkins R, Palmer J, Kolokotroni M. 2007. Increased temperature and intensification of the urban heat island: implications for human comfort and urban design. Built Environ. 33(1):85–96.
- Yan ZW, Wang J, Xia JJ, Feng JM. 2016. Review of recent studies of the climatic effects of urbanization in China. Adv Clim Change Res. 7(3):154–168.
- Yuan M, Yin C, Sun Y, Chen W. 2019. Examining the associations between urban built environment and noise pollution in high-density high-rise urban areas: A case study in Wuhan, China. Sustain Cities Society. 50(June):101678. 101678.