
 ?Mathematical formulae have been encoded as MathML and are displayed in this HTML version using MathJax in order to improve their display. Uncheck the box to turn MathJax off. This feature requires Javascript. Click on a formula to zoom.
Abstract
It is critically important to understand the variation of urban thermal environment since urban heat island (UHI) effect is one of the most worrisome urban environment and impedes urban sustainable development. Taking Huai’an central urban area in China as a case, Landsat images from 2000 to 2020 were used, we first estimated land surface temperature (LST) and land covers based on google earth engineer (GEE) platform. Then explored annual variation of SUHI and urban expansion types using statistics method and urban landscape Analysis tools. Finally, discussed the heat effect of urban expansion types and directions. The results showed that (1) SUHI patches gradually concentrated in Phase I, while in Phase II, concentrated SUHIs spread continuously from urban centre to rural area, changing from two centres to a polycentric pattern. (2) Urban expansion was characterized as a diffusion and coalescence process, extension type is the most dominant urban growth mode, second is leapfrog type, and the smallest is infilling type. (3) Annual trend of NLST shows an increasing trend for all three urban expansion types during the last two decades, which of extension mode was biggest, while, that of infilling growth was smallest. This research can attribute a better understanding for the impact of urban expansion on surface heat island effects.
1. Introduction
There were 55% of world’s population lives in urban areas by 2018 (United Nations Citation2018a), this number is projected to be 68% by 2050 (United Nations Citation2018b). To meet the growing needs of urban residents, urban land in the world is expanding outward at twice rate of the population, it will increase to nearly triple the amount in 2000 by 2030 (Seto et al. Citation2012), resulting more and more natural objects reduced (Ma et al. Citation2018). This transformation modifies surface radiation and surface runoff water characteristics, which result in local and regional surface-atmosphere energy exchange (Madanian et al. Citation2018). As a consequence, bring about many negative environmental repercussions such as congestion, water-logging, urban heat island (UHI) effect and air pollution (Levermore et al. Citation2018; Xu et al. Citation2018). Among these impacts, UHI called atmosphere temperature(or land surface temperature) higher than their surrounding rural areas (Oke Citation1982) is one of the most worrisome urban environment (Sultana and Satyanarayana Citation2018; Peng et al. Citation2019), which increases energy and water consumption in the urban area for cooling especially in summer (Omidvar et al. Citation2018; Kang and Kim Citation2019) and accelerates the formation of air pollution and urban smog. As human-induced urban climate phenomena, UHI effect is to be more severe under a warming climate and a rapidly urbanizing (Peng et al. Citation2012; Zhou et al. Citation2015; Estoque et al. Citation2017; Lin et al. Citation2018; Sultana and Satyanarayana Citation2018; Huang et al. Citation2019; Peng et al. Citation2019; Zhou et al. Citation2019). Therefore, it is important to understand the variation of urban thermal environment along with the urbanization process and its driving factors, which can help urban planners to mitigate UHI effect in urban planning (Yao et al. Citation2017; Liu et al. Citation2018; Wang et al. Citation2018a, 2018b; Feng et al. Citation2019; Song and Park Citation2019; Weng et al. Citation2019).
With continuous spatial coverage and temporal repeated observations, LST has been widely used to investigate UHI variation at various geographic scale (Feng et al. Citation2019; Peng et al. Citation2019; Shirani-bidabadi et al. Citation2019; Yue et al. Citation2019; Sultana and Satyanarayana Citation2020). For example at regional scale, Li et al. (Citation2019) conclude that SUHIs moving direction consisted with urban expansion, and population density and green space were the dominant factors in a study of Hangzhou Metropolitan area. Wang et al. (Citation2020) found that the SUHI increased significantly from 2000 to 2015 in a subtropical desert city Las Vegas, Nevada and urbanization-induced land conversions were main driving factor. Yu et al. (Citation2019) revealed that regional heat island is expanding with increasing connection in the Yangtze River Delta urban agglomeration. Focussed on the SUHI trend at micro scale, Li et al. (Citation2021) found that the annual SUHI intensity trend is different according to urbanization stage, the notable increasing trend is regular-urbanization, second is stable-urbanization, and the smallest is counter-urbanization. Impervious surface (IS) changes are common perspective to monitor the urbanization (Peng et al. Citation2019), meanwhile, IS is accepted as the main driving factor in LST increases (Firozjaei et al. Citation2020; Ye et al. Citation2021). A large amount of literatures has been conducted on the relationships between LST and urbanization including land cover changes (Hou and Estoque Citation2020; Lu et al. Citation2020), impervious surface density (Estoque et al. Citation2017; Meng et al. Citation2018), abundance (Weng et al. Citation2004; Xu Citation2010), configuration (Ma et al. Citation2021) and impervious surface type (Yang et al. Citation2019), providing a well document for linking urbanization and urban thermal environment. However, the effect of land use change on SUHI is more popular in a direct LST comparison between impervious surfaces and other land cover types and mean association between SUHI and single (multi) land cover index (Dilawar et al. Citation2021; Shahfahad et al. Citation2021;Shahfahad et al. Citation2022), it is few consider about heat effect of IS expansion zone and IS expansion types, which contributes more to urban thermal environment (Nie et al. Citation2016; Chakraborty et al. Citation2021; Chen et al. Citation2021; Wang et al. Citation2022). Understanding the connections between the IS expansion type and LST is essential to governing urban growth smartly (Tran et al. Citation2017; Chakraborty et al. Citation2021). With this aim, we selected Huai’an City to analyse the heat effect of urban expansion types.
Huai’an is a third-tier city located in Huai River Delta, where concurrent daytime and night-time heatwave events show a significant upward trend in recent decades (Zhang et al. Citation2020). It has experienced rapid urbanization in the past two decades. Its urban area increased from 40 km2 in 2000 to 208 km2 in 2020, urban population increased from 54.56 ten thousand in 2000 to in 333.43 ten thousand in 2020. The aim of this study was to analyze the changes of thermal environment and how do urban expansion types influence LST during 2000 to 2020. More specially, the first objective of this work is to derive the LST and land cover indices based on GEE platform, creating thermal landscape and land cover maps. Second is to assess the variation of SUHI, and urban expansion direction and types according to two stages. The third is to investigate influence of expansion types and direction on urban thermal environment, respectively.
2. Materials and methods
2.1. Study area
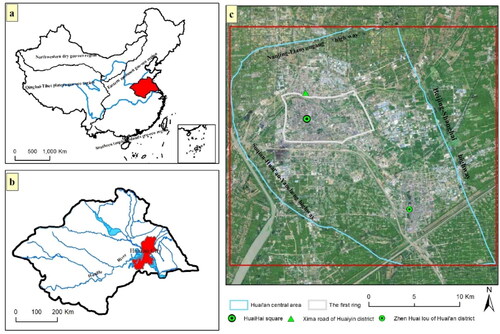
Huai’an City, one of the core cities in Huai River Eco-Economy Belt, which is located between 118°12′-119°36′30″E and 33°43′-34°06′N in Huai River Basin. It belongs to a typical north-south transitional climatic zone (Zhang et al. Citation2020) that is not only a transition zone between high and low latitudes between land and sea in China but also a humid and semi-humid monsoon climate zone in eastern China. This city receives annual average precipitation of about 914 mm and has an annual average temperature of about 14.5 °C. The area is prone to droughts and flood events in the summer since it is controlled by the Plum Rain front and the subtropical high. There are four administrative Districts (Qingjiangpu, Huaiyin, Huai’an, Hongze) and three counties (Xuyi, Lianshui, and Jinghu) in Huai’an City. In this study, our study was focussed on Huai’an central urban area which was identified in Huai’an City Master Plan (2009–2030), including the extent of north to Nanjing-Lianyungang high way, east to Beijing-Shanghai highway, west to Suqian-Huai’an-Yancheng highway as they more urbanized than other area, which total area is approximately 767 Km2. The geographic location of the study area is shown in .
Figure 1. Study area: (a) Location of Huai River Basin in China. (b) Location of Huai’an City in Huai River Basin. (c) The study area (Google earth image in 2018).
2.2. Data
Landsat 5 TM, Landsat 7 ETM and Landsat 8 OLT/TIR images from 2000 to 2021 are used in this study, among them, ten Landsat 5 Thermal images, three Landsat 7 thermal images and eight Landsat 8 thermal images with smallest cloud cover were used for LST retrieval. Landsat multi spectral images in 2000, 2010 and 2020 were applied to classify three land-use maps contained impervious surfaces, vegetables, water and others. The details for these Landsat images are shown in .
2.3. Land surface temperature retrieval
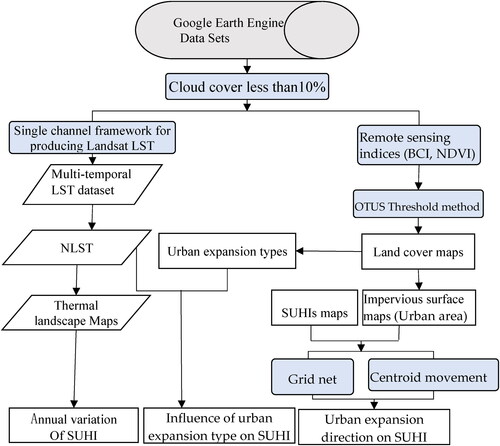
The single channel framework proposed by China University of Geosciences (Wuhan) (Wang et al. Citation2020) was used to retrieve long time-series Landsat LST imagery of Huai’an City. This framework utilized Atmospheric water vapor (AWV)-dependent practical single-channel (PSC) algorithm to product LST on a Google earth engine (GEE) computing platform based on Landsat thermal images, Landsat Surface Reflectance, atmospheric and land surface emissivity input data in google Earth Engine Data Sets. The AWV-dependent PSC algorithm is proved to be better than the AWV-and NSAT-dependent PSC algorithm by Wang et al. (Citation2019) who used in situ measurements to validate. The detail produce progress is in reference (Wang et al. Citation2020). Using this efficient framework, we can obtain free and long time-series LST data without download Landsat images, preprocessing and LST retrieval, greatly improve researchers’ work efficiency. Neighbourhood statistics and irregular triangulation method are used to assign the LST in the cloud coverage area.
The retrieved LST images from twenty one different years cannot be directly compared, while relative LST was demonstrated to be sufficient to characterize the spatial variations of urban land surface temperature (Chen et al. Citation2019; Grigoraș and Urițescu Citation2019; Yue et al. Citation2019; Sultana and Satyanarayana Citation2020). Hence, we first adopt extremum standardization method to normalize LST (NLST). Then, used Natural Breaks (Jenks) classification method to divide NLSTs into 5 thermal landscape categories: cold, medium-cold, medium, medium-hot and hot (Shirani-bidabadi et al. Citation2019), Natural Break(Jenks) is a more rigorous classification for classifying UHI (Lu et al. Citation2021). Last, we defined the higher NLST level as higher SUHI intensity, and the combine area of medium-hot and hot thermal landscape categories as SUHI.
UHI ratio index (URI) proposed by Xu et al. (Citation2009) was also applied to explore thermal environment changes over urbanization, that can be calculated by EquationEquation (1)(1)
(1)
(1)
(1)
where m is the number of thermal landscape categories (m = 5), n is higher than medium categories (medium-hot and hot, n = 2), wi is the weight of thermal landscape categories, medium-hot is 4, and hot is 5, pi is the proportion of medium-hot and hot area to the study area, respectively.
2.4. Identification of urban expansion types
The urban landscape analysis tool (ULAT) (CLEAR Urban Landscape Analysis Tool, 2021) was chosen to determine the new urban area according to three types including infill, extension and leapfrog. ULAT was developed in 2015 by the Centre for Land use Education and Research (CLEAR) and the University of Connecticut, which is based on urban sprawl Metrics that Burchfield and Angel proposed. Classification of new urban area is based on location relative to the start Year’s urban area. New urban patch expanding in the urbanized open space is defined as infill expansion, whereas intersecting with urbanized area is extension type, and that isolated from urbanized areas is leapfrog type. The detail definition of urban landscape metrics is in reference (Tran et al. Citation2017).
Land cover maps () of Huai’an central area from 2000 to 2020 were obtained based on Landsat multi spectral images using BCI, NDVI and MNDWI index and OTSU threshold segmentation method. In this study, impervious surface was utilized to characterize the urban area since it is an important indicator to quantify the level of urbanization and urban expansion (Lin et al. Citation2018; Zhang et al. Citation2019).
2.5. Spatial centroids
The spatial centroid was selected to illustrate the directions of urban expansion and SUHI in our study since it has been widely applied to analyse the spatial impact of urban evolution on the changes of urban thermal environment (Quan et al. Citation2014; Li et al. Citation2019; Yang et al. Citation2019; Chen et al. Citation2021; Shen and Zeng Citation2021). Urban expansion was defined as impervious surface changes and NLST was used to quantify SUHI intensity. The centroid coordinates were mapped following EquationEquations (2)(2)
(2) and Equation(3)
(3)
(3)
(2)
(2)
(3)
(3)
where
and
are the weighted longitude and latitude coordinates for NLST or proportion of impervious surface area in year t.
is the mean NLST and impervious surface area proportion of i-th grid in year t.
are the latitude and longitude coordinates of the grid, respectively. n is the total grid (1 km × 1 km) number of the study area. The work flow was illustrated in .
Figure 2. The flow chart of this study.
3. Results
3.1. Variation in urban thermal environment
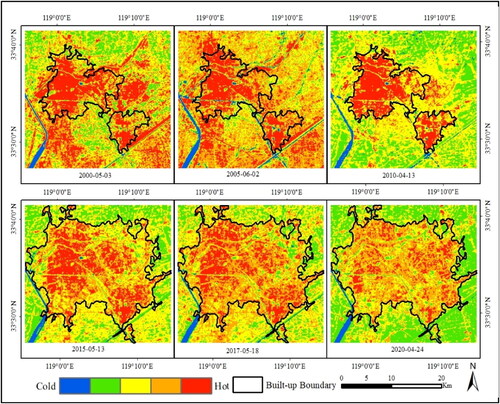
Spatiotemporal changes of SUHI in the study area are shown in and , LST in urban centre was higher than surrounding areas, and SUHIs (hot and medium hot patches) expanded significantly in spatial extent along with urbanization. In spatial, the hot patches always consist with impervious surface, bare land and cultivated land for mature crops, while the cold patches are located in the area of water (e.g. Beijing-Hangzhou Grand canal, Li canal, Abandoned Yellow River (AYR), Salt River, the North Jiangsu Irrigation Canal (NJIC)) and parks with high vegetation coverage (). But the remarkable thing is many hot patches were distributed in cultivated land and bare land between 2000 and 2010, hot and medium hot patches corresponding to impervious surface mainly concentrated in the urban centre and becoming more and more concentrated. From 2011 to 2020, concentrated SUHIs spread continuously from urban centre to rural area and transformed into numerous scattered patches along with the impervious surface expanding rapidly, changing from two centres to a polycentric pattern (), it was consistent with previous study (Li et al. Citation2019; Wang et al. Citation2022). Hence, we conclude urban heat effect was not prominent during the period of 2000 to 2010, and then divided the full study period into two stages including 2000–2010 (Phase I) and 2011–2020 (Phase II) to analyse the changes of urban thermal environment and heat effect of urban expansion types.
Figure 3. Spatial distribution of urban thermal landscape for Huai’an CUA from 2000 to 2021, the up panel is the built-up boundary of 2010, the down panel is that of 2020.
Further, area and proportion of each thermal landscape categories () were calculated, the results show medium category accounted most, while cold patches were the least in the entire study period. In whole study period, SUHI area enlarged (from 24.69% in 2001 to 50.28% in 2017) gradually, and emerged first increase then decrease trend in each Phase(), and the increase SUHI patches mainly located on the periphery of the built-up area. However, some SUHI patches of inner city centre were reduced in Phase II, which may be resulted by urban village reconstruction. We also made use of UHI ratio index (URI) to analyse UHI changes in Phase I and Phase II, there are three steps. Firstly, we mapped built-up area of 2010 and 2020 () with create TIN and delineate TIN data area tools in ArcGIS 10.5 based on corresponding impervious surface data, then calculated each thermal landscape category’s proportion, finally obtained URIs following EquationEquation (1)(1)
(1) . The URI variation in Phase I and Phase II, both appeared a trend of increasing and then decreasing (), and change ratio of Phase II was more significantly than Phase I. Heat effect increases as city size and aggregation increases (Estoque et al. Citation2017), the larger and more compact is the built-up area, the stronger is the UHI effect.
Figure 4. URI trend in the built-up areas of the central area of Huai’an City (URIs of 2000–2010 are based on 2010’s built-up area, that of 2011–2020 are based on 2020’s built-up area).
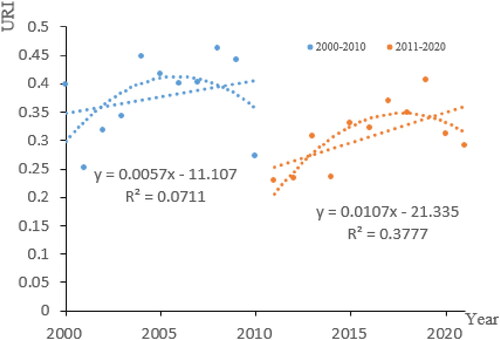
Table 1. Area of thermal landscape categories from 2000 to 2020.
3.2. Directions and types variations of urban expansion
shows the spatial centroid trajectories of SUHIs and urban land (IS area) during 2000–2020, impervious surfaces moved towards east throughout the period, which reveals urban expansion was more notable in the eastern part of Huai’an CUA than that of other directions. This may be mainly influenced by urban development policy, Huai’an municipal government has stated Huai’an City would mainly expand to east in Huai’an City Master Urban Planning 2001–2020, focussing on the development of ShuiDuKou and Bochi hill Area and Huai’an City Provincial Economic New Zone in the east, and Huai’an Higher Education Park in the south. During the period of 2011 to 2020, urban land expanded towards east and north, this agreed with Huai’an City Master Urban Planning 2009–2030, emphasizing construction of Huai’an City National Economic New Zone and High-speed railway Zone in the east of Qingjiangpu district and Industrial Park in the north of Huaian district. The spatial variation of urban expansion in Phase II was slightly smaller than Phase I according to the little bigger movement of centroid from 2000 to 2010 (), which demonstrated that urban growth follows the diffusion-coalescence phases in the last two decades, it agrees with previous references (Chakraborty et al. Citation2021).
Figure 5. Centroid movements for SUHIs and IPS area in Huai’an CUA during 2000 to 2020.
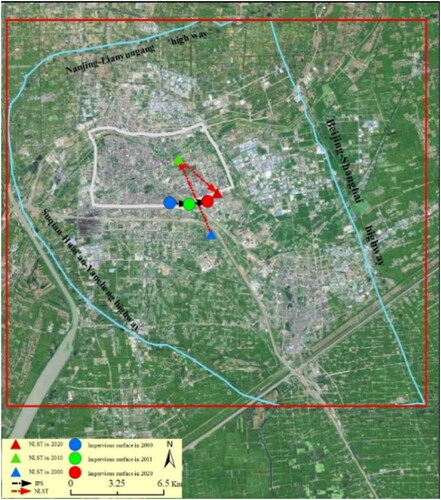
Table 2. Changes of impervious surface area and SUHI spatial centres from 2000 to 2020.
The spatial distribution of urban expansion types shows that extension type was uppermost and widely distributed across the study area, and infill and leapfrog growth mode were scattered with small proportion (, ). The extension and infill expansion types increased from 2000 to 2020, while leapfrog decreased.
Figure 6. The spatial distribution and proportions of urban expansion types in Huai’an CUA.
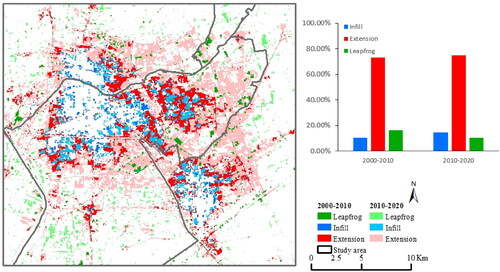
Table 3. Area of each urban expansion types in Huai’an CUA from 2000 to 2020.
3.3. The relationship between SUHI and urban expansion directions and types
The spatial centroid of SUHIs was in the left of impervious surface centre in 2000 and moved towards northwest in 2010 and southeast in 2020, respectively. However, the centroid of impervious surface continued to expand east and south in the whole study period (). In general, the expansion directions of urban expansion and SUHI are opposite in Phase I and same in Phase II, which is due to the large number of SUHI patches on cultivated and bare land in the eastern and southern part of the study area in 2000, while that is few during 2010 to 2020 ().
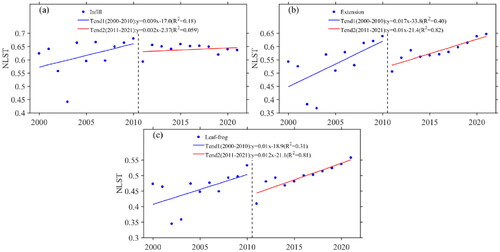
For each urban expansion type, we analysed the annual mean variation of urban thermal environment. The results show that, for all the three urban expansion types, the annual mean NLST shows an increasing trend (). However, the NLST trends of three urban expansion types also displayed significant differences, among them, the NLST trend for extension mode was biggest during the last two decades, which of infilling expansion was smallest. These trends in Huai’an CUA are same with the similar cases in Hangzhou (Chen et al. Citation2021), which approve heat effects of infilling growth are a little weaken than those of leapfrog growth, and those of growth in extension show strongest. The NLST trends on same urban expansion type in different stage also have some differences, NLST trends of infilling and extension mode in first stage were bigger than next stage, and that of leapfrog growth was opposite.
Figure 7. Annual mean NLST variations of infill, extension and leaf frog expansion types for two stage.
4. Discussion
4.1. Inter-annual variation of surface urban heat island
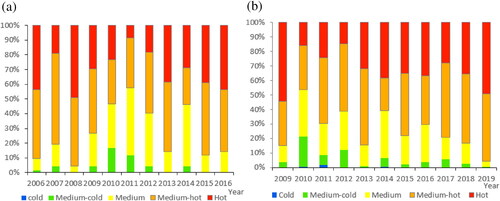
The optimal period is crucial for discussing the influence of urbanization on the urban thermal environment (Willie et al. Citation2019; Yang et al. Citation2019).We select two new urban towns to discuss the influence of urbanization on the urban thermal environment in this study, using statistical analysis of changes in the proportion of thermal landscape categories in the eleven-year series. The results are shown in and , in spatial, the hot thermal category were expanding outside and gradually stable in morphology, and the proportion of hot thermal category fluctuated obviously in the early stage, then began to stabilize in 6–9 year, which may be influenced of cooling effect of new urban green space (Ye et al. Citation2021). A 6–9-year time periods for analysing urban thermal environment changes can reduce the short-term disturbance of urban construction.
Figure 8. The variation of urban thermal categories for ten years. (a) Huai’an University town from 2006 to 2016. (b) National Economic New Zone of Huai’an City from 2009 to 2019.
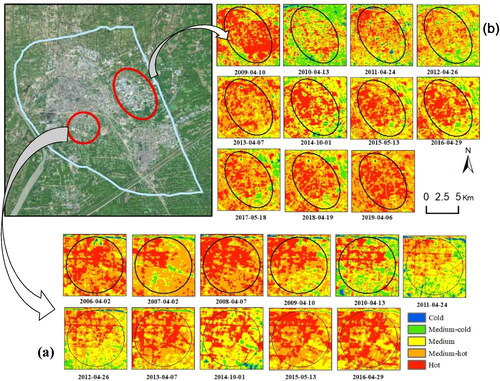
Figure 9. The variation in the percentage of the urban thermal categories for ten years. (a) Huai’an University Town from 2006 to 2016. (b) National Economic Development Zone from 2009 to 2019.
4.2. Effects of urban expansion type on urban thermal environment
We used annual mean NLST trends to display the heat effect of urban expansion type, the result shows extension growth proposed largest NLST trend, which was consistent with reference (Chen et al. Citation2021) they think the main reason for SUHIs increase was the urban construction on the periphery of urban area. The largest increase trend in NLST of extension growth was understandable by the associated substantial IS proportion increase (Li et al. Citation2021) and intense human activities (Chen et al. Citation2021). In contrast, the NLST trend for infill type was smallest with the reason of new IS patches are located in the urbanized open space, where IS proportion (>50%) is saturated and less affected by changes of IS proportion (Yao et al. Citation2017; Wang et al. Citation2022). According to the definition of urban expansion type, new IS patches in leapfrog type isolated from urbanized areas, which is usually far from the city centre with relatively low proportion of IS (Yang et al. Citation2022) and surrounded agriculture with land lower LST (Tran et al. Citation2017), resulting smaller NLST trend than other extension type.
The NLST trend of extension and infilling types in Phase II were slightly smaller than in Phase I, which may be resulted by two factors. One is the renovation of the inner city centre village, second is implementation of the integrated planning of new urbanization and urban-rural development in Huai’an City, focussing on ecology and intensiveness, emphasizing green urban development planning. This good land cover pattern contributes to the decrease in NLST trend (Tran et al. Citation2017).
The conclusion in our study differ from the case in National Capital region (Tran et al. Citation2017) and Hanoi inner city (Chakraborty et al. Citation2021) who think SUHI effect of edge-expansion type is smaller than infill type, that can be explained by measuring SUHI effect method. They used mean LST to quantity SUHI effect of urbanization types, NLST trends were applied in this study. In general, proper land cover pattern in extension type is an efficient way to reduce the SUHI effect.
5. Conclusions
This study analyzes spatial-temporal changes of SUHI in Huai’an CUA and the heat effect of urban expansion types during the period of 2000 to 2020.The main conclusions are summarized as follows:
Urban heat effect was not prominent during 2000 to 2010, next decade, concentrated SUHIs spread continuously from urban centre to rural area, changing from two centres to a polycentric pattern.
The annual mean NLST shows an increasing trend for all the three urban expansion types.The NLST trend for extension mode was biggest during the last two decades, while, that of infilling expansion was smallest. The same urban expansion type in different stage also has some difference.
An efficient way for reducing heat effect of urbanization is to proper land covers pattern in extension type.
There also has some limitation in this study, we only qualitatively discussed the reason of heat effect of urban expansion types, and next step is to apply a spatial statistical model to quantify the driving mechanism.
Main contributions: (1) retrieved LST of Huai’an City in 21 years based on GEE temperature inversion framework, (2) compared the annual variation of the urban heat island between 2000 and 2021 and (3) discussed the effect of urban expansion types on urban thermal environment in two decade stages.
Declaration of competing interest
No potential conflict of interest was reported by the authors.
Acknowledgments
The authors would like to thank the Geospatial Data Cloud site of Chinese Academy of Sciences for freely providing satellite remote sensing image data required in this study. We also thank the editor and the three reviewers for their insightful comments on the earlier version of this manuscript. Thank Zheng luo, Yuqi Chen and Rui Wang for drawing and Figures 6.
Data availability statement
The data used to support the findings of this study are available from the corresponding author upon request
Additional information
Funding
References
- Chakraborty S, Pramanik S, Follmann A, Giri B, Mondal B, Patel PP, Maity I, Das J, Punia M, Sahana M. 2021. Dominant urban form and its relation to nighttime land surface temperature in the rapidly urbanizing National Capital Region of India. Urban Clim. 40:1–15.
- Chen L, Zhou B, Man W, Liu M. 2021. Landsat-based monitoring of the heat effects of urbanization directions and types in hangzhou city from 2000 to. Remote Sens. 13:2020.
- Chen T, Sun A, Niu R. 2019. Effect of land cover fractions on changes in surface urban heat islands using Landsat time-series images. Int J Environ Res Public Health. 16:971.
- CLEAR Urban Landscape Analysis Tool. 2021. http://clear.uconn.edu/tools/ugat/index.htm
- Dilawar A, Chen B, Trisurat Y, Tuankrua V, Arshad A, Hussain Y, Measho S, Guo L, Kayiranga A, Zhang H, et al. 2021. Spatiotemporal shifts in thermal climate in responses to urban cover changes: a case analysis of major cities in Punjab, Pakistan. Geomatics Nat Hazards Risk. 12(1):763–793.
- Estoque RC, Murayama Y, Myint SW. 2017. Effects of landscape composition and pattern on land surface temperature: an urban heat island study in the megacities of Southeast Asia. Sci Total Environ. 577:349–359.
- Feng Y, Gao C, Tong X, Chen S, Lei Z, Wang J. 2019. Spatial patterns of land surface temperature and their influencing factors: a case study in Suzhou, China. Remote Sens. 11:182.
- Firozjaei MK, Weng Q, Zhao C, Kiavarz M, Lu L, Alavipanah SK. 2020. Surface anthropogenic heat islands in six megacities: an assessment based on a triple-source surface energy balance model. Remote Sens Environ. 242:111751.
- Grigoraș G, Urițescu B. 2019. Land use/land cover changes dynamics and their effects on surface urban heat island in Bucharest, Romania. Int J Appl Earth Obs Geoinf. 80:115–126.
- Hou H, Estoque RC. 2020. Detecting cooling effect of landscape from composition and configuration: an urban heat island study on Hangzhou. Urban For Urban Green. 53:126719.
- Huang K, Li X, Liu X, Seto KC. 2019. Projecting global urban land expansion and heat island intensification through 2050. Environ Res Lett. 14(11):114037.
- Kang Y, Kim EJ. 2019. Differences of restorative effects while viewing urban landscapes and green landscapes. Sustainability. 11(7):2129.
- Levermore G, Parkinson J, Lee K, Laycock P, Lindley S. 2018. The increasing trend of the urban heat island intensity. Urban Clim. 24:360–368.
- Li F, Sun W, Yang G, Weng Q. 2019. Investigating spatiotemporal patterns of surface urban heat islands in the Hangzhou Metropolitan area, China, 2000-2015. Remote Sens. 11:2000–2015.
- Li J, Zhan W, Hong F, Lai J, Dong P, Liu Z, Wang C, Huang F, Li L, Wang C, et al. 2021. Similarities and disparities in urban local heat islands responsive to regular-, stable-, and counter-urbanization: a case study of Guangzhou. China Build Environ. 199:1–13.
- Lin Y, Jim CY, Deng J, Wang Z. 2018. Urbanization effect on spatiotemporal thermal patterns and changes in Hangzhou (China). Build Environ. 145:166–176.
- Liu H, Zhan Q, Yang C, Wang J. 2018. Characterizing the spatio-temporal pattern of land surface temperature through time series clustering: based on the latent pattern and morphology. Remote Sens. 10:654.
- Lu L, Weng Q, Xiao D, Guo H, Li Q, Hui W. 2020. Spatiotemporal variation of surface urban heat islands in relation to land cover composition and configuration: a multi-scale case study of Xi’an, China. Remote Sens. 12.
- Lu Y, He T, Xu X, Qiao Z. 2021. Investigation the robustness of standard classification methods for defining urban heat islands. IEEE J Sel Top Appl Earth Obs Remote Sens. 14:11386–11394.
- Ma Q, Wu J, He C, Hu G. 2018. Spatial scaling of urban impervious surfaces across evolving landscapes: From cities to urban regions. Landsc Urban Plan. 175:50–61.
- Ma Y, Zhang S, Yang K, Li M. 2021. Influence of spatiotemporal pattern changes of impervious surface of Urban Megaregion on thermal environment: a case study of the Guangdong – Hong Kong – Macao Greater Bay Area of China. Ecol Indic. 121:107106.
- Madanian M, Soffianian AR, Koupai SS, Pourmanafi S, Momeni M. 2018. Analyzing the effects of urban expansion on land surface temperature patterns by landscape metrics: a case study of Isfahan city, Iran. Environ Monit Assess. 190(4):189.
- Meng Q, Zhang L, Sun Z, Meng F, Wang L, Sun Y. 2018. Characterizing spatial and temporal trends of surface urban heat island effect in an urban main built-up area: a 12-year case study in Beijing, China. Remote Sens Environ. 204:826–837.
- Nie Q, Man W, Li Z, Huang Y. 2016. Spatiotemporal impact of urban impervious surface on land surface temperature in Shanghai, China. Can J Remote Sens. 42(6):680–689.
- Oke TR. 1982. The energetic basis of the urban heat island. QJ Royal Met Soc. 108(455):1–24.
- Omidvar H, Song J, Yang J, Arwatz G, Wang ZH, Hultmark M, Kaloush K, Bou-Zeid E. 2018. Rapid modification of urban land surface temperature during rainfall. Water Resour Res. 54(7):4245–4264.
- Peng S, Feng Z, Liao H, Huang B, Peng S, Zhou T. 2019. Spatial-temporal pattern of, and driving forces for, urban heat island in China. Ecol Indic. 96:127–132.
- Peng S, Piao S, Ciais P, Friedlingstein P, Ottle C, Bréon FM, Nan H, Zhou L, Myneni RB. 2012. Surface urban heat island across 419 global big cities. Environ Sci Technol. 46(2):696–703.
- Quan J, Chen Y, Zhan W, Wang J, Voogt J, Wang M. 2014. Multi-temporal trajectory of the urban heat island centroid in Beijing, China based on a Gaussian volume model. Remote Sens Environ. 149:33–46.
- Seto KC, Güneralp B, Hutyra LR. 2012. Global forecasts of urban expansion to 2030 and direct impacts on biodiversity and carbon pools. Proc Natl Acad Sci U S A. 109(40):16083–16088.
- Shahfahad Rihan M,Naikoo MW,Ali MA,Usmani TM,Rahman A. 2021. Urban Heat Island Dynamics in Response to Land-Use/Land-Cover Change in the Coastal City of Mumbai. J Indian Soc Remote Sens. 49(9):2227–2247.
- Shahfahad Talukdar S,Rihan M,Hang HT,Bhaskaran S,Rahman A. 2022. Modelling urban heat island (UHI) and thermal field variation and their relationship with land use indices over Delhi and Mumbai metro cities. Environ Dev Sustain. 24(3):3762–3790.
- Shen Z, Zeng J. 2021. Spatial relationship of urban development to land surface temperature in three cities of southern Fujian. Dili Xuebao/Acta Geogr Sin. 76:566–583.
- Shirani-bidabadi N, Nasrabadi T, Faryadi S, Larijani A, Shadman Roodposhti M. 2019. Evaluating the spatial distribution and the intensity of urban heat island using remote sensing, case study of Isfahan city in Iran. Sustain. Cities Soc. 45:686–692.
- Song B, Park K. 2019. Analysis of spatiotemporal urban temperature characteristics by urban spatial patterns in Changwon City. South Korea Sustain. 11:4–8.
- Sultana S, Satyanarayana ANV. 2018. Urban heat island intensity during winter over metropolitan cities of India using remote-sensing techniques: impact of urbanization. Int J Remote Sens. 39(20):6692–6730.
- Sultana S, Satyanarayana ANV. 2020. Assessment of urbanisation and urban heat island intensities using Landsat imageries during 2000-2018 over a sub-tropical Indian city. Sustain Cities Soc. 52:1–14.
- Tran DX, Pla F, Latorre-Carmona P, Myint SW, Caetano M, Kieu HV. 2017. Characterizing the relationship between land use land cover change and land surface temperature. ISPRS J. Photogramm Remote Sens. 124:119–132.
- United Nations. 2018a. The speed of urbanization around the world. Popul Facts. 1–2.
- United Nations. 2018b. World urbanization prospects: the 2018 revision. New York: United Nations.
- Wang J, Meng B, Fu D, Pei T, Xu C. 2018a. Mapping spatiotemporal patterns and multi-perspective analysis of the surface urban heat islands across 32 major cities in China. ISPRS Int J Geo-Information. 7(6):207.
- Wang L, Zhu J, Xu Y, Wang Z. 2018b. Urban built-up area boundary extraction and spatial-temporal characteristics based on land surface temperature retrieval. Remote Sens. 473:1–21.
- Wang M, Zhang Z, Hu T, Liu X. 2019. A practical single-channel algorithm for land surface temperature retrieval: application to Landsat series data. J Geophys Res Atmos. 124:299–316.
- Wang M, Zhang Z, Hu T, Wang G, He G, Zhang Z, Li H, Wu Z, Liu X. 2020. An efficient framework for producing Landsat-based land surface temperature data using Google earth engine. IEEE J Sel Top Appl Earth Obs Remote Sens. 13:4689–4701.
- Wang Y, Li X, Zhang C, He W. 2022. Influence of spatiotemporal changes of impervious surface on the urban thermal environment: a case of Huai’an central urban area. Sustain Cities Soc. 79.
- Wang Z, Fan C, Zhao Q, Myint SW. 2020. A geographically weighted regression approach to understanding urbanization impacts on urban warming and cooling: a case study of Las Vegas. Remote Sens. 12(2):222.
- Weng Q, Firozjaei MK, Sedighi A, Kiavarz M, Alavipanah SK. 2019. Statistical analysis of surface urban heat island intensity variations: a case study of Babol city, Iran. GIScience Remote Sens. 56(4):576–604.
- Weng Q, Lu D, Schubring J. 2004. Estimation of land surface temperature-vegetation abundance relationship for urban heat island studies. Remote Sens Environ. 89(4):467–483.
- Willie YA, Pillay R, Zhou L, Orimoloye IR. 2019. Monitoring spatial pattern of land surface thermal characteristics and urban growth: a case study of King Williams using remote sensing and GIS. Earth Sci Inform. 12(4):447–464.
- Xu H. 2010. Analysis of impervious surface and its impact on urban heat environment using the normalized difference impervious surface index (NDISI). Photogramm Eng Remote Sens. 76(5):557–565.
- Xu H, Wang M, Shi T, Guan H, Fang C, Lin Z. 2018. Prediction of ecological effects of potential population and impervious surface increases using a remote sensing based ecological index (RSEI). Ecol Indic. 93:730–740.
- Xu H, Wen X, Ding F. 2009. Urban expansion and heat island dynamics in the Quanzhou Region, China. IEEE J Sel Top Appl Earth Obs Remote Sens. 2(2):74–79.
- Yang C, Zhan Q, Gao S, Liu H. 2019. How do the multi-temporal centroid trajectories of urban heat island correspond to impervious surface changes: a case study in Wuhan, China. Int J Environ. Res Public Health. 16.
- Yang Y, Guangrong S, Chen Z, Hao S, Zhouyiling Z, Shan Y. 2022. Quantitative analysis and prediction of urban heat island intensity on urban-rural gradient: a case study of Shanghai. Sci Total Environ. 829.
- Yao R, Wang L, Huang X, Niu Z, Liu F, Wang Q. 2017. Temporal trends of surface urban heat islands and associated determinants in major Chinese cities. Sci Total Environ. 609:742–754.
- Ye H, Li Z, Zhang N, Leng X, Meng D, Zheng J, Li Y. 2021. Variations in the effects of landscape patterns on the urban thermal environment during rapid urbanization (1990–2020) in megacities. Remote Sens. 13:1–22.
- Yu Z, Yao Y, Yang G, Wang X, Vejre H. 2019. Spatiotemporal patterns and characteristics of remotely sensed region heat islands during the rapid urbanization (1995–2015) of Southern China. Sci Total Environ. 674:242–254.
- Yue W, Qiu S, Xu H, Xu L, Zhang L. 2019. Polycentric urban development and urban thermal environment: a case of Hangzhou, China. Landsc Urban Plan. 189:58–70.
- Zhang Y, Mao G, Chen C, Lu Z, Luo Z, Zhou W. 2020. Population exposure to concurrent daytime and nighttime heatwaves in Huai River Basin, China. Sustain Cities Soc. 61.
- Zhang Y, Wang X, Balzter H, Qiu B, Cheng J. 2019. Directional and zonal analysis of urban thermal environmental change in Fuzhou as an indicator of urban landscape transformation. Remote Sens. 11.
- Zhou D, Xiao J, Bonafoni S, Berger C, Deilami K, Zhou Y, Frolking S, Yao R, Qiao Z, Sobrino JA. 2019. Satellite remote sensing of surface urban heat islands: progress, challenges, and perspectives. Remote Sens. 11:1–36.
- Zhou D, Zhao S, Zhang L, Sun G, Liu Y. 2015. The footprint of urban heat island effect in China. Sci Rep. 5:2–12.
Appendix 1
Figure A1. Spatial distribution of urban thermal landscape for Huai’an CUA from 2000 to 2021, the up panel is the period of 2000–2010, the down panel is from 2011 to 2021.
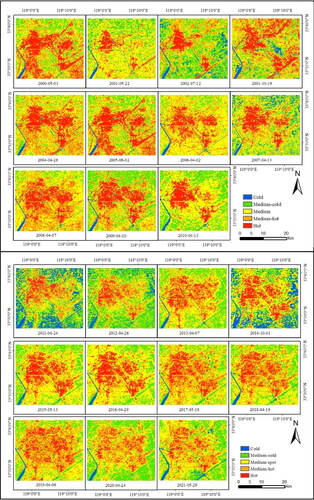
Figure A2. Land cover type maps and urban thermal landscape maps in 2000, 2010 and 2020. The up panel is Land cover type maps, the down panel is urban thermal landscape maps. (Impervious surface in 2000, 2011 and 2020 was from our previous study (Wang et al. Citation2022).)
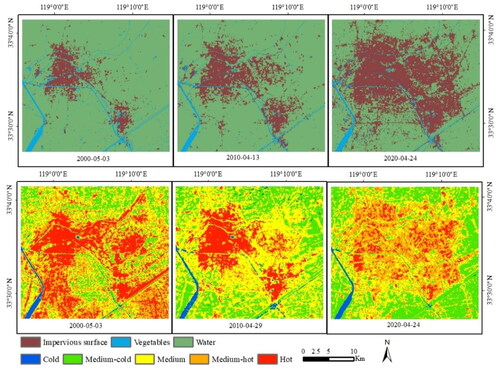
Table A1. Details of the Landsat images used to retrieve LST and land cover mapping in this study.
Table A2. Area of thermal landscape categories from 2000 to 2020.