
 ?Mathematical formulae have been encoded as MathML and are displayed in this HTML version using MathJax in order to improve their display. Uncheck the box to turn MathJax off. This feature requires Javascript. Click on a formula to zoom.
Abstract
Taiwan Province is an earthquake-prone area, and strong earthquakes in Taiwan could affect coastal cities in the mainland. The high-rise buildings in coastal cities often are seriously affected, which can cause social panic. Therefore, it is necessary to study the seismic impact of moderate and strong earthquakes in Taiwan on the mainland coast to accurately analyze the effect on buildings in this area, especially the responses of people in high-rise buildings after the earthquake, and to provide a relatively accurate reference for the evaluation of the timely restoration of social order. This paper uses the 43.29 million mobile phone location records collected after the Ms6.1 earthquake in Hualien, Taiwan on April 18, 2021, for the bandwidth selection in kernel density estimation in different regions and conducts a quantitative density analysis of 331 buildings using the communication check-in data after the earthquake on different temporal and spatial scales. Through this work, an exponential model of people’s responses in high-rise buildings to far-field strong earthquakes in Taiwan is obtained, and the flow pattern of people in regard to disaster avoidance in high-rise buildings after far-field non-destructive earthquakes is summarized. This article can be a reference for the local government to judge the impact of Taiwan’s far-field earthquakes and to make decisions with respect to disaster relief.
1. Introduction
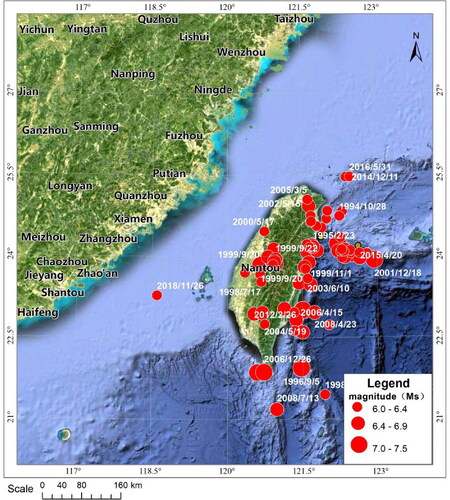
Taiwan Province is located on the continental edge of the southeast coast of China, close to the convergence boundary of the Eurasian plate and the Philippine Sea plate. The westward push of the Philippine Sea plate and the eastward upthrust of the Eurasian plate form one of the strongest crustal deformation areas. The seismicity in Taiwan is frequent and strong. Since 1990, 76 earthquakes with magnitude (Ms) ≥ 6.0 have occurred, as shown in . Usually, strong earthquakes in Taiwan can affect the southeast coastal areas, including Zhejiang Province and Fujian Province, and some strong earthquakes can even cause certain earthquake damage along the coast (Smith Citation1996). On September 16, 1994, an earthquake of Ms7.3 occurred in the southwestern sea area of Taiwan and had a VI-degree impact on the coastal areas of Fujian Province. The Ms7.2 earthquake in the southwest sea area of Taiwan on December 26, 2006, had a strong impact on the southeastern coast of the mainland, with a maximum impact distance of 1100 km. On March 4, 2010, a Ms6.7 earthquake struck Kaohsiung, Taiwan and caused a strong shaking in Fuzhou, Xiamen, Quanzhou and Wenzhou, and the building of Fuzhou Daily shook for approximately 20 s. Strong earthquakes in Taiwan can cause long-period ground motion with a displacement of several millimetres in a vast area from the southeast coast to the inland, with a distance of hundreds to thousands of kilometres. With the development of the economy and the acceleration of urbanization, the coastal area is more sensitive to earthquakes, and more attention should be paid to the impact of earthquakes in Taiwan (Altunisik et al. Citation2021).
Figure 1. Epicentre distribution of strong earthquakes with Ms ≥ 6.0 in Taiwan since 1990.
China’s southeast coastal area has a dense population, developed economy, and high concentration of wealth, includes the most developed economic centre in China, is an important international portal in the Asia Pacific region, and has a world-class urban agglomeration and many high-rise and super high-rise buildings (Tomás et al. Citation2016). Although a strong earthquake in Taiwan would be far away, the amplification of high-rise buildings leads to strong responses in this region, which could cause great panic. The impact of earthquakes on high-rise buildings is a common concern in this region (Atmaca et al. Citation2020).
Large earthquakes often produce abundant long-period ground motions in the process of fault rupture. Long-period earthquakes tend to propagate hundreds or even thousands of kilometres due to slow attenuation. During the propagation of long-period seismic waves from bedrock to the surface, filtering and amplification effects will be generated according to the site conditions. It results in serious damage to buildings with natural frequencies close to the site soil (Ashbrook and Starner Citation2003). The 2008 Wenchuan earthquake severely damaged some high-rise buildings in Xi’an which are 700 km away from the epicentre and contain deep loess overburden. The 2011 earthquake of the Pacific coast of Tōhoku caused the seismic response of the superstructure of the second office building of Osaka Prefecture Government for nearly 10 min which is 770 km away from the focal point. The maximum displacement of its top reached 137 cm. The Japanese and American scholars have recognized that long-period seismic waves are more destructive to high-rise buildings (super high-rise buildings) than ordinary seismic waves. The deep soft soil sites have amplification effects on long-period ground motions. This must be considered in seismic design (Akason et al. Citation2006). Site condition is one of the main influencing factors of ground motion parameters, which is reflected in the amplification or reduction of ground motion, and is directly related to the severity of earthquake disaster.Generally speaking, the earthquake damage of buildings which build on soft foundation is heavier than that on hard foundation. The earthquake damage of structures with long natural vibration period is heavier on soft foundation.
Bambang setiawana investigated a site in Adelaide central business district. He concluded that there are obvious differences in the seismic damage of buildings on different site conditions. Mucciarelli analyzed two reinforced concrete buildings located on the soft sediment and found that the buildings with higher height had greater damage (Setiawan et al. Citation2018). The influence of site soil on the amplitude of ground motion is mainly reflected in the obvious amplification of the peak acceleration of bedrock. For example, in the M8.1 Mexico earthquake in 1985, the acceleration from the bedrock of Mexico City, about 400 km away from the epicentre, to the ground surface through the overburden was amplified by more than five times, resulting in serious damage to hundreds of high-rise buildings in the site. At present, the method of studying long-period ground motion characteristics, especially the long-period ground motion characteristics of thick overburden sites, mainly focuses on the analysis of strong earthquake records.
The research on the long-period characteristics of earthquake motion is limited by the relatively few measured data of periodic ground motion, resulting in less research on the characteristics of far-field ground motion. On the whole, it is still in a relatively immature stage. With the progress of research, mobile big data, as a new data source, is increasingly used in earthquake disaster research. Myshake can use private and personal smartphones to build a global earthquake network (Erdik et al. Citation2011). It uses accelerometers embedded in all smartphones to record ground motion caused by earthquakes. The research on the relationship between post-earthquake response characteristics and disaster avoidance behaviour and earthquake based on mobile phone positioning has attracted extensive attention of scholars (Wang and Taylor Citation2018). Pang analyzed the indicators related to the earthquake disaster using the mobile phone location data. Linus and Xin used mobile phone location technology to study the characteristics of cholera population flow in Haiti and after the earthquake (Zhang et al. Citation2016). Yabe Takahiro uses large-scale mobile data to observe human movement patterns within and between cities with a high degree of spatial-temporal granularity, and studies the impact on post disaster urban recovery performance (Dong and Shan 2018).
This article statistically analyzes concrete high-rise buildings in Xiamen, Fuzhou and Wenzhou using communication big data, compares the amplification effects of different site conditions, structures and heights under an earthquake, and obtains the specific human sensitive values and patterns, which provides a technical basis for post-earthquake emergency countermeasures (Calka and Bielecka Citation2019; Alam et al. Citation2009).
2. Acquisition of spatial-temporal data
At present, internet and communication technology are developing rapidly. Location-related big data, such as smart phone positioning data, social media check-in data, and photos, provide resources for the fast perception of dynamic human changes. Location check-in data are reported through the application programming interfaces (APIs) of mobile phone systems, and can be used to analyze the geographical locations of users, which is important spatial data. At present, commercially available data mainly include Global Positioning System (GPS) data, Wi-Fi data and base station signal data used for mobile phone positioning for a large population. Based on the coverage of local mobile terminal devices and the actual population proportion, the real-time population number is obtained through model correction; this is a kind of unclassified statistical data for a large population and does not involve privacy. This work uses GeoHash grids with data accuracy ranging from 5 to 8. In this study, the number of internet terminals ultimately refers to the number of people holding mobile terminals.
Location check-in data are a discrete geographic information system (GIS) point object with spatial coordinates and user attributes. In this study, the discrete check-in data are gridded. The large amount of data and discrete check-in location points are transformed into grid data with spatial continuity and adjacency, which can better reflect the concentrated density of check-in events (Brown et al. Citation2001; Nie et al. Citation2012). A grid with fixed pixel size is constructed and spatially connected, and the key attributes of point check-in data with a spatial inclusion relationship are mapped to the corresponding attributes of the grid. The equations are as follows:
(1)
(1)
(2)
(2)
where D(W) represents the number of check-ins for grid G; D(T) represents the area type of grid D; n represents the number of check-in points in grid D; NP represents the total number of check-ins of the ith check-in point in grid D;
represents the weight of the check-in point; and
is the sum of the weights of all check-in points of class Ti in grid D. According to EquationEquations (1)
(1)
(1) and Equation(2)
(2)
(2) , the discrete check-in data are converted into a gridded dataset of check-in frequency, which not only simplifies the discrete point data but also maintains the space-time characteristics and thematic attribute characteristics of check-in data (Sakaki et al. Citation2010).
3. Data data processing methods
At 22:14 Beijing time on April 18, 2021, a Ms6.1 earthquake occurred in Hualien County, Taiwan (23.94°N and 121.43°E), with a focal depth of 30 km. The earthquake caused strong shakings throughout Taiwan and obvious shakings in the coastal areas of Fujian Province and could be felt by people in high-rise buildings in Hangzhou, Zhejiang Province. After the earthquake, the wireless internet location data obtained during the earthquake are used to study on the changes in the flow of the public at different scales, the high-resolution real-time mobile terminal location data are used to analyze the spatial-temporal patterns of people gathering and scattering in communities and high-rise buildings after the earthquake, and ideal results are achieved.
3.1. Experimental area and data range
This article takes the densely populated area affected by the Hualien Ms6.1 earthquake in Taiwan as the macro-study area. There are 73,744 sampling points in 20 periods, and the study area covers urban areas, towns and villages of 14 cites in southern Zhejiang Province and eastern Fujian Province, including Xiamen, Fuzhou, Putian, Quanzhou, Wenzhou, Lishui and Taizhou. A total of 43.29011 million people is covered, and the data acquisition accuracy is GeoHash 6. In addition, to analyze the micromovement of people in regard to disaster avoidance in high-rise buildings in large cities, two typical study areas are selected, as shown in . The first study area is located in the west of the Siming District, Xiamen city, 360 km from the epicentre, and the data accuracy is GeoHash 8, with 164 sampling points, 176 buildings and 3032 people. The second study area is located in the commercial and residential area of Longgang city, Wenzhou, 410 km from the epicentre, and the data accuracy is GeoHash 8, with 219 sampling points, 159 buildings and 3420 people. GeoHash 6 is an approximately 0.6 km ×1.1 km grid, which is more suitable for people flow analysis at the macroscale, and the GeoHash 8 resolution is approximately 20 m × 30 m, which can directly reflect the population flow at the level of a single building and can clearly analyze the phenomenon of people moving from indoors to outdoors. The population information in different periods is extracted. Specifically, the data every 10 min from 22:00 on April 18 to 23:40, a total of 10 periods, are extracted, which can comprehensively reflect the dynamic distribution of people after the earthquake. To facilitate comparison, 10 groups of data of the same periods on April 16 and 17 are also obtained.
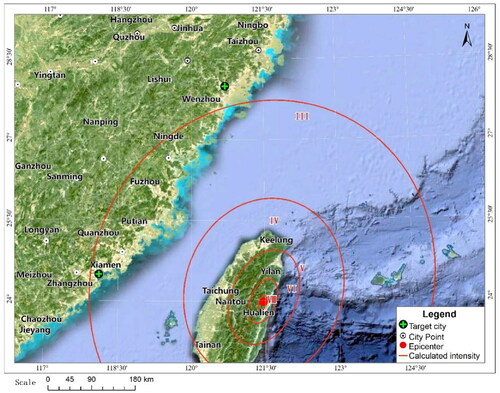
Figure 2. Distribution of the theoretical influence field of the Hualien Ms6.1 earthquake.
3.2. Population distribution using the kernel density method
Because the collected data are summary point data, it is necessary to use a model to simulate the population distribution. Here, the kernel density method is used. Kernel density estimation originates from the first law of geography; that is, everything is related, close things are more closely related, and the closer to the kernel elements are, the greater the density expansion value, which reflects the characteristics of spatial heterogeneity and central intensity attenuation with distance. This method can reveal the detailed characteristics of objects and realize the diffusion of the radiating impact on adjacent locations. It is widely used in research on urban facilities and services, traffic risk assessment and business congregation spaces. According to the classical population density-distance attenuation relationship, the population density of each grid is simulated. The method can be traced back to the classic Clark model. Through the statistical analysis of more than 20 cities, Clark proposed with convincing evidence that with an increasing distance from the city centre to the periphery, the urban population density tends to decline exponentially; that is, there is a negative exponential relationship between population density and distance (Hadsell et al. Citation2006; Haghi et al. Citation2017). The classic Clark model of the spatial distribution of urban population density is shown in EquationEquation (3)(3)
(3) .
(3)
(3)
where r is the distance to the urban centre; D(r) is the population density at r from the urban centre; D0 is the scale coefficient, which is theoretically equal to the population density at the urban centre; and b is the rate of the distance attenuation effect. Later, two new urban population density models are proposed successively, i.e. the normal density model and negative exponential model. The normal density model is
(4)
(4)
The negative exponential model is
(5)
(5)
where K is the scale coefficient and
is a parameter related to distance. The negative exponential model does not define the population density in the urban centre. Most of the population density distribution does not obey the negative exponential model. Studies show that the Clark model is suitable for describing the population density distribution in urban areas, while the negative exponential model is suitable for describing the distribution of population density in urban fringes (Sridharan and Qiu Citation2013; Zhong et al. Citation2014).
In this study, the centre point of the GeoHash grid is the sample point. In space, people tend to gather near a central point, so the distance from the centre is inversely proportional to the population density under normal circumstances (Bossu et al. Citation2018). The population distribution in the grid is simulated by calculating the point density attenuation. Kernel density analysis is a suitable method for simulating population distribution. In the calculation of the kernel density, the density does not change greatly with increasing radius. The calculation formula of kernel density estimation is:
(6)
(6)
where K is the kernel function; h is the search radius (bandwidth), that is, the extension width of the surface near point x in space, which determines the smoothness of the surface of the kernel density; and n is the number of feature points contained by point x in the search bandwidth.
Based on the grid-processed discrete check-in data, exploratory spatial data analysis is used to measure the spatial correlation of check-in data, the spatial structure and global distribution patter, and to determine the best mode for hot spot detection and clustering. Cluster analysis is used to identify statistically significant hot spots, cold spots and spatial outliers. Finally, through the measurement of the geographical and spatial distribution of the clustering analysis results, spatial clustering characteristics of people with statistical significance are obtained, so this is an effective method for detecting the hot spots of population flow and gathering (Hartigan and Wong Citation1979; Shaham et al. Citation2018).
3.3. Corresponding relationship between post-earthquake data variation and intensity
In the data analysis, kernel density analysis and rasterization on the point data are conducted, and the density analysis results at 22:10 (before the earthquake) and 22:20 (after the earthquake) on April 18 are used to calculate the grid difference. In the past, elevation data by the digital elevation model (DEM) are often used in grid calculation. Using grid calculation, the difference between the two grid data can be directly obtained. The grid calculation is used to analyze the difference in population density in two periods, and the changes in population before and after the earthquake are obtained (Yu and Wen Citation2016). In EquationEquation (7)(7)
(7) , m is the number of people before the earthquake, n is the number of people after the earthquake, s is the gathering degree,
is the average daily change within a week, and c is a random value.
(7)
(7)
The area with the largest S value (gathering degree) is the area with the most serious regional impact. In the macroscale calculation, the GeoHash 6 data are used. The calculation results can objectively reflect the people gathering range and degree caused by the earthquake, and then the distribution range around the macro-epicenter can be obtained.
4. Analysis of the study area and communication big data
4.1. Analysis of the macroscale variation in epicenter communication big data
After an earthquake, communication occurs in regard to asking for help or calling relatives and friends. In a non-destructive earthquake, under the premise that the base stations work normally, the overall communication volume and activity in an earthquake-stricken area could certainly continue to increase dramatically, resulting in a phenomenon with many mobile phone turn-ons, sleeps and activations (Rumelhart et al. Citation1986; Sandholt et al. Citation1998). The closer to the epicentre, the greater the deviation between the trend of the actual mobile phone-based population data and the historical mobile phone-based population data in the affected area is, especially for late night and early morning earthquakes. For example, in the early morning of July 12, 2021, a M5.1 earthquake occurred in Tangshan, Hebei Province. After the earthquake, the number of active mobile internet users in Guye District, Tangshan, which is near the epicentre, increased significantly, while the number of mobile terminals near the macro-epicenter increased by 12% within 30 min.
First, the intensity distribution of the Hualien earthquake is calculated. Due to the lack of intensity attenuation data in Taiwan, only the theoretical intensity distribution in eastern China is obtained according to the seismic intensity attenuation model, as shown in .
(8)
(8)
(9)
(9)
where R is the length of the long axis, I is the intensity, M is the magnitude, and σ is an adjustment parameter.
shows that, macroscopically, the overall changes in human responses are in a discrete state but that the number of active terminals increases significantly in Fuzhou and Putian, which are close to the epicentre, and that the number of active terminals in Ningde and Xiamen, which are far from the epicentre, also increases relatively significantly. In inland areas outside the 3-degree circle, only the number of terminals in urban areas increases to a certain extent. The overall trend shows that in the coastal areas relatively close to the epicentre, the terminal volume increases significantly and changes greatly within cities. In the city, the ground is mostly soil layers and deep bedrock, and there are many high-rise buildings, so a variety of factors interact with each other to amplify the effect of the earthquake. Overall, the change in the terminal density value is obvious and is within the 3-degree circle, but Wenzhou is special, being outside the 3-degree circle, but the number of terminals also increases significantly. The intensity attenuation model used is the point model, and the linear model is more reasonable for earthquakes above Ms ≥ 6, which can explain the phenomenon of strong seismic sensation in Wenzhou, as shown in and .
Figure 3. Distribution of the communication big data of the Hualien Ms6.1 earthquake.
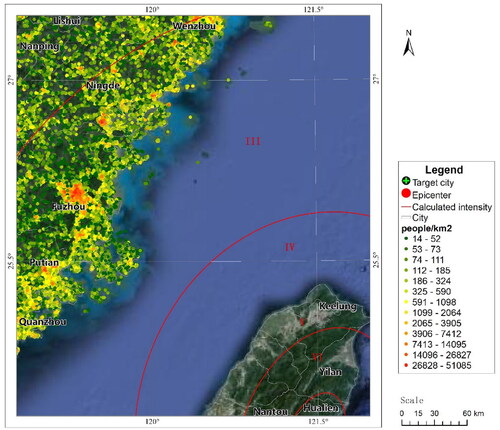
Figure 4. Distribution of the communication impact degree of the Hualien Ms6.1 earthquake.
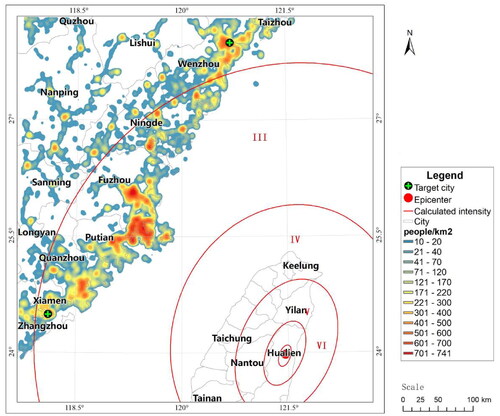
Table 1. Changes of macroscale overall communication report data.
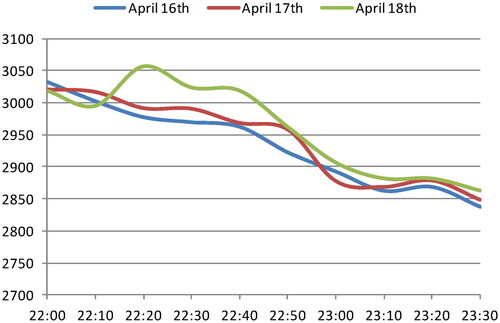
The time series changes of mobile phone location data in typical areas of Wenzhou and Xiamen are compared, and the curves of the time series changes of the reported location are plotted, as shown in and . After the earthquake, the mobile phone location data increases suddenly with the occurrence of the earthquake. In Xiamen, the duration is long, and until 22:50, the curve starts to return to that of the previous day. In Wenzhou, there is a sudden increase, but the duration is short, and there is almost no increase at approximately 22:30. An interesting phenomenon is observed; that is, at approximately 23:30, for these two cities, the changes in mobile phone location data on the same day are greater than the daily changes, which indicates that some people are still paying attention to the earthquake 1 h after the earthquake.
Figure 5. Temporal changes of location data reported by mobile phones in typical areas of Wenzhou (study area 1).
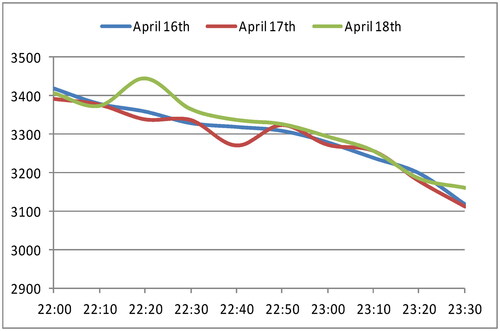
Figure 6. Temporal changes of location data reported by mobile phones in typical areas of Xiamen (study area 2).
4.2. Analysis of the vertical spatial variation in the population in building blocks
Study area 1 (east of the Siming District, Xiamen) and area 2 (north of Longgang city, Wenzhou) containing high-rise buildings are selected, as shown in and . Because GeoHash 6 data are not accurate enough to reflect the flow of people indoors and outdoors, GeoHash 8 data with a higher accuracy are used. Similarly, EquationEquation (7)(7)
(7) is used to calculate the grid density difference in two periods, and the results are shown in . People gather in the two study areas. Xiamen is within the 3-degree circle obtained by the theoretical model, while Wenzhou is in an area with an intensity less than 3 degrees according to the model. After the earthquake, some residents move from indoors to outdoor open places, showing disaster avoidance behaviour, and the outflow of the population in high-rise buildings is relatively obvious. In the horizontal dimension, many people move out of the core area of the residential area, and crowds gather near the main entrances and exits, the internal roads, and the squares of the community. However, people do not gather at the main traffic lines, especially the city squares and parks relatively far from the residential area, indicating that the residents respond to the earthquake but soon calm down. In the vertical dimension, the population density of high-rise buildings is drastically changed. After a period, most people return indoors, ending their disaster avoidance behaviour. The post-earthquake disaster avoidance behaviour of the population in high-rise buildings is the focus of this study (Akason et al. Citation2006; Becker et al. Citation2017).
Figure 7. Schematic diagram of the location around Wenzhou Kangxin building in study area 1.
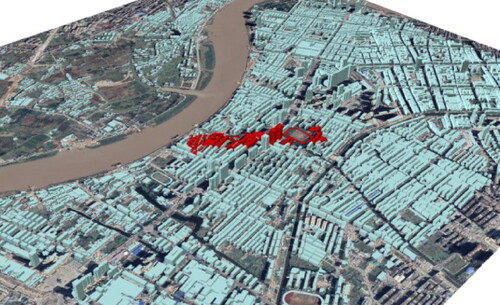
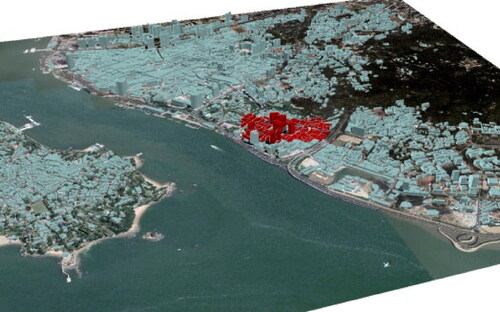
Figure 8. Schematic diagram of the location around Xiamen Pengyuan building in study area 2.
A high-rise building can be simplified as a vertical cantilever structure. A vertical load mainly produces an axial force in the structure that is roughly linear with the height of the building, and the horizontal load produces a bending moment in the structure (Grasso and Maugeri 2005). According to the mechanical characteristics, the direction of the vertical load remains unchanged, and only the load increases with increasing building height; the horizontal load can come from many directions, and the force due to lateral deformation increases with increasing height. In high-rise structures, the influence of the horizontal load is much greater than that of vertical load. The impact of the Taiwan earthquake on the southeast coast of the mainland is mainly horizontal displacement produced a far-field earthquake; an additional purpose of this paper is to study the impact of a far-field Taiwan earthquake on the horizontal displacement of high-rise buildings (Freire Citation2010; Erdik et al. Citation2011). In the typical areas of Wenzhou and Xiamen, 335 typical buildings with a height of 3–168 m are selected. The change in the population density in buildings below 12 m is not obvious, but obvious changes in population density in buildings between 12 and 48 m are found. In high-rise buildings with a height of approximately 100 m in Wenzhou and Xiamen, the changes are very close; those in Wenzhou are only slightly smaller. This phenomenon is closely related to the point impact field and linear impact field, as shown in and . In addition, Wenzhou is in an estuarine alluvial plain, with a thick soil layer, so the amplification effect of strong ground motion caused by the soil layer is obvious. However, the buried depth of the soil layer in typical area in Xiamen is shallow, and the ground conditions are good, so the amplification effect is relatively small, as shown in and .
Figure 9. Changes of mobile phone location in different buildings in Wenzhou (study area 1).
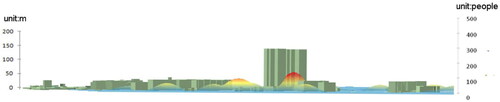
Figure 10. Changes of mobile phone location in different buildings in Xiamen (study area 2).
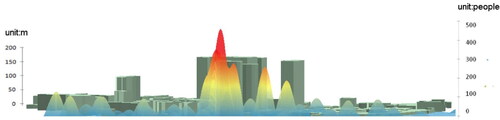
Table 2. Comparison of personnel response under buildings of different heights in typical areas of Wenzhou (study area 1).
Table 3. Comparison of personnel response under buildings of different heights in typical areas of Xiamen (study area 2).
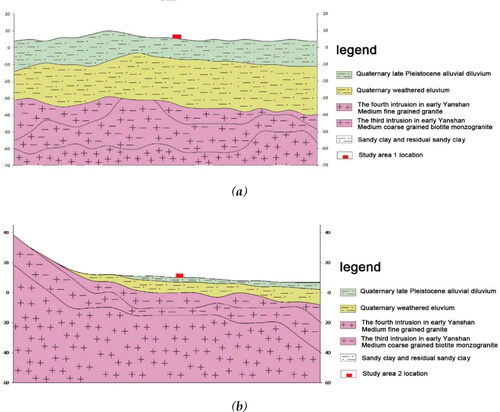
Although Wenzhou is farther away from the epicentre than Xiamen, there are more deep soft soil sites in Wenzhou. The site with deep soft soil layer has amplification effect on long-period ground motion, as shown in . The strong earthquake activity in Taiwan’s sea area will cause seismic damage to high-rise and super high-rise buildings in deep soft soil sites, which will also be the biggest potential seismic threat to high-rise buildings in deep soft soil sites along the southeast coast of China (D'Altri et al. Citation2020).
Figure 11. (a) Geologic profile of Wenzhou (study area 1), (b) geologic profile of Xiamen (study area 2).
To study the amplification relationship and pattern of different ground conditions and structures with different heights on ground motion, typical building groups that can fully reflect the regional characteristics are selected for analysis, including eight high-rise and super high-rise buildings above 100 m. The analysis results show that for high-rise buildings on hard soil (Xiamen), as the height of the building increases, the sensation of shaking gradually increases; and that for high-rise buildings on soft soil (Wenzhou), the gradual strengthening trend of earthquake sensation is more significant, and the amplification effect of high-rise buildings is more intense (Zhang et al. Citation2016).
To discuss the macro-performance of the human response in high-rise buildings, the acceleration peak of these 335 high-rise buildings is calculated. According to the relationship between the sense by people on the ground and the peak acceleration of horizontal ground motion in the Chinese Seismic Intensity Scale, the following results are obtained: (1) On the soft soil (Wenzhou), the number of people experiencing a strong sensation in 20-m buildings is approximately 2% more than that on the ground, and the number of people experiencing a strong sensation in 100-m buildings is approximately 8% more than that on the ground. (2) Due to the lack of data for 150-m buildings, according to the exponential model, the number of people experiencing a strong sensation is approximately 31% more than that on the ground. (3) On the hard soil (Xiamen), the number of people experiencing a strong sensation in 20-m buildings is approximately 2% more than that on the ground, the number of people experiencing a strong sensation in 100-m buildings is approximately 7.5% more than that on the ground, and the number of people experiencing a sensation feeling in 150-m buildings is approximately 15% more than that on the ground. According to these correlations, when an earthquake occurs, people can reasonably estimate the magnitude of the earthquake by finding the corresponding sensation of people on the ground in the Chinese Seismic Intensity Scale to reduce the panic of people in high-rise buildings, as shown in .
Figure 12. Exponential relationship between human response and floor height.
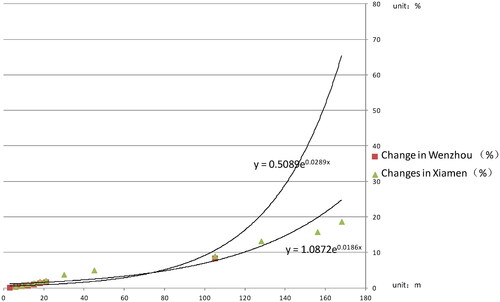
There are enough samples in this work (phone location records), but it is still unable to fully cover all building types. However, we found that the sample data obtained were distributed in a relatively narrow area on the building height axis, and the linear characteristics were obvious. Good results have been achieved in the study area. Singular data points will still appear in some cases during the modelling process. Individual special cases represented by such data points need to be removed during modelling. We consider polynomial model and exponential model. By comparison, we find that exponential model curve is more suitable for simulating the relationship between building and personnel response after earthquake. With the support of communication big data, the changes in human response with the floor height on both hard and soft soils are obtained, and enhanced exponential models are obtained.
(10)
(10)
(11)
(11)
where Y is the number of people affected and X is the building height. Because of the particularity, this model is applicable only to the impact of Taiwan far-field earthquakes on the southeastern coast of the mainland.
4.3. Multi-source data verification – Weibo data
Sina Weibo data are used to verify and enrich mobile Internet data. It is concluded that the people who panic and escape in the comprehensive high-rise buildings account for about 18% of the total sample, the number of non-high-rise building personnel escaping accounted for about 7% of the total sample. However, there is not much difference between Wenzhou and Xiamen. These data verify our analysis results to a certain extent.
5. Conclusion
Big data provide an unprecedented social perception means to understand the evolution of natural disasters from a human perspective. This article quantitatively analyzes the temporal and spatial patterns of people gathering and scattering after an earthquake and studies the post-earthquake temporal and spatial changes at different scales, i.e. from urban agglomerations to communities to buildings. New technologies and methods continue to emerge. At present, with the support of high-precision data, the quasi-real-time community level quantitative analysis of post-earthquake temporal and spatial changes in population can be achieved, which can provide fine and reliable data at both the macro- and microscales, so that government can provide disaster relief within a few hours after an earthquake. With the support of wireless internet terminal data, this study obtains the spatial-temporal dynamic data of the population after an earthquake at different scales and the quantitative response and disaster avoidance behaviour of people in buildings with different heights after an earthquake. Later, after multisource data verification, the data are proved to be close to the actual situation. The actual intensity can be determined by obtaining the human response in high-rise buildings and reduce the panic of people in the high-rise building in regard to the earthquake. Targeted disaster avoidance facilities and escape routes can be designed for high-rise and super high-rise buildings in earthquake prone areas.
The obtained check-in data indicate the number of people that moved in the horizontal direction. Although the data accuracy is high, the lack of direct vertical population changes leads to an inaccurate reflection of the human response in high-rise buildings to the amplified ground motion due to the building height. At present, barometer sensors are used in high-end mobile phones, which can directly reflect the height changes of mobile phone holders. However, the number of sampling points in this study is still small and is not enough to obtain the vertical changes in the overall population. In the future, with increasing numbers of mobile phone sensors, data fusion technology can be used to fuse the number of Wi-Fi signals, the number of people in the horizontal direction, barometer sensors, and other parameters, which can more accurately obtain the changes in people in the vertical direction.
Acknowledgements
The author thanks Prof. Li Zhiqiang for his ccd valuable programmatic comments on this article. The author thanks Li Yang for his professional help in language translation. The author also thanks China Earthquake Network (CENC) for providing the earthquake catalog data and Zhejiang Emergency Management Digital and Technology Center for providing the natural disaster model.
Disclosure statement
The authors have no conflicts of interest to declare that are relevant to the content of this article.
Data availability statement
The data that support the findings of this study are available from the corresponding author, Tan Qinquan, upon reasonable request.
Additional information
Funding
References
- Akason JB, Olafsson S, Sigbjörnsson R. 2006. Sigbjörnsson, R (2006) Perception and observation of residential safety during earthquake exposure: a case study. Saf Sci. 44(10):919–933.
- Alam M, Mahmoodzadeh A, Pirasteh S. 2009. A method for rapid evaluation of masonry buildings against earthquakes. Int Disaster Adv J. 2(3):15–23.
- Altunişik AC, Atmaca B, Kartal ME, Günaydin M, Demir S, Uluşan A. 2021. Assessment of structural damage following the October 30, 2020 Aegean Sea earthquake and Tsunami. J Earthquake Tsunami. 15(6):2150029. https://doi.org/10.1142/S1793431121500299.
- Ashbrook D, Starner T. 2003. Using GPS to learn significant locations and predict movement across multiple users. Pers Ubiquit Comput. 7(5):275–286.
- Atmaca B, Demir S, Günaydin M, Altunişik AC, Hüsem M, Ateş Ş, Adanur S, Angin Z. 2020. Field investigation on the performance of mosques and minarets during the Elazig-Sivrice earthquake. J Perform Constr Facil. 34(6):4020120–4020121.
- Becker JS, Paton D, Johnston DM, Ronan KR, McClure J. 2017. The role of prior experience in informing and motivating earthquake preparedness. Int J Disaster Risk Reduct. 22:179–193.
- Bossu R, Roussel F, Fallou L, Landès M, Steed R, Mazet-Roux G, Dupont A, Frobert L, Petersen L. 2018. LastQuake: from rapid information to global seismic risk reduction. Int J Disaster Risk Reduct. 28:32–42.
- Brown V, Jacquier G, Coulombier D, Balandine S, Belanger F, Legros D. 2001. Rapid assessment of population size by area sampling in disaster situations. Disasters. 25(2):164–171.
- Calka B, Bielecka E. 2019. Reliability analysis of LandScan gridded population data. The case study of Poland. IJGI. 8(5):222–240.
- D’Altri AM, Sarhosis V, Milani G, Rots J, Cattari S, Lagomarsino S, Sacco E, Tralli A, Castellazzi G, de Miranda S. 2020. Modeling strategies for the computational analysis of unreinforced masonry structures: Review and classification. Arch Comput Methods Eng. 27(4):1153–1185.
- Dong L, Shan J. 2013. A comprehensive review of earthquake-induced building damage detection with remote sensing techniques. ISPRS J Photogramm Remote Sens. 84:85–99.
- Erdik M, Şeşetyan K, Demircioğlu MB, Hancılar U, Zülfikar C. 2011. Rapid earthquake loss assessment after damaging earthquakes. Soil Dyn Earthq Eng. 31(2):247–266.
- Freire S. 2010. Modeling of spatiotemporal distribution of urban population at high resolution–value for risk assessment and emergency management. In: Geographic information and cartography for risk and crisis management. Berlin Heidelberg: Springer;pp. 53–67.
- Grasso S, Maugeri M. 2005. Vulnerability of physical environment of the city of Catania using GIS technique. Adv Earthquake Eng. 14:155–175.
- Hadsell R, Chopra S, LeCun Y. 2006. Dimensionality reduction by learning an invariant mapping. IEEE Conf Comput Vis Pattern Recogn. 2:1735–1742.
- Haghi M, Fatemi Ghomi SMT, Jolai F. 2017. Developing a robust multi-objective model for pre/post disaster times under uncertainty in demand and resource. J Clean Prod. 154:188–202.
- Hartigan JA, Wong MA. 1979. Algorithm AS 136: A K-means clustering algorithm. Appl. Stat. 28(1):100–108.
- Nie GZ, An JW, Deng Y. 2012. Advances in earthquake emergency disaster service. Seismol Geol. 34(4):728–791.
- Rumelhart DE, Hinton GE, Williams RJ. 1986. Learning representations by back-propagating errors. Nature. 323(6088):533–536.
- Sakaki T, Okazaki M, Matsuo Y. 2010. Earthquake shakes Twitter users: real-time event detection by social sensors. Proceedings of 19th international conference on World wide web.Raleigh, North Carolina, USA, 851–860.
- Sandholt PE, Farrugia CJ, Moen J, Noraberg Ø, Lybekk B, Sten T, Hansen T. 1998. A classification of dayside auroral forms and activities as a function of interplanetary magnetic field orientation. J Geophys Res. 103(A10):23325–23345.
- Setiawan B, Jaksa M, Griffith M. 2018. An investigation of local site effects in Adelaide, South Australia: learning from the past. Boll Geofis Appl. 59(1):27–46.
- Shaham U, Stanton K, Li H. 2018. SpectralNet: Spectral clustering using deep neural networks. In International Conference on Learning Representations (ICLR2018); Vancouver, Canada. p. 1–20.
- Smith SK. 1996. Demography of disaster: population estimates after hurricane Andrew. Popul Res Policy Rev. 15(5):459–477.
- Sridharan H, Qiu F. 2013. A spatially disaggregated areal interpolation model using light detection and ranging-derived building volumes. Geogr Anal. 45(3):238–258.
- Tomás L, Fonseca L, Almeida C, Leonardi F, Pereira M. 2016. Urban population estimation based on residential buildings volume using IKONOS-2 images and lidar data. Int J Remote Sens. 37(sup1):1–28.
- Wang Y, Taylor JE. 2018. Coupling sentiment and human mobility in natural disasters: a Twitter-based study of the 2014 South Napa earthquake. Nat Hazards. 92(2):907–925.
- Yu J, Wen JH. 2016. Multi-criteria satisfaction assessment of the spatial distribution of urban emergency shelters based on high-precision population estimation. Int J Disaster Risk Sci. 7(4):413–429.
- Zhang XB, Kelly S, Ahmad K. 2016. The Slandail monitor: real-time processing and visualisation of social media data for emergency management. In: Proceedings of 2016 11th International Conference on Availability, Reliability and Security; New York: IEEE. p. 786–791.
- Zhong C, Arisona SM, Huang X, Batty M, Schmitt G. 2014. Detecting the dynamics of urban structure through spatial network analysis. Int J Geogr Inf Sci. 28(11):2178–2199.