
 ?Mathematical formulae have been encoded as MathML and are displayed in this HTML version using MathJax in order to improve their display. Uncheck the box to turn MathJax off. This feature requires Javascript. Click on a formula to zoom.
Abstract
Based on the data of meteorological, soil, and land use/land cover (LULC), the InVEST model was used to evaluate the water yield service in the middle and upper Ganjiang River region, which is an important ecological function area in the hilly region of South China. This study discusses the value of parameter Z, the impact of climate and LULC change on water yield service, and complements related studies in the monsoon hilly watershed in South China with obvious precipitation change, which is helpful to understand the ecosystem water service functions in this region. The results show that the water yield was closest to the statistical data of total water resources when the parameter Z value of 1.555. The overall distribution of water yield in the MU-GJR was high in the northeast (middle reaches) and low in the southwest (upper reaches), with minimum of 111.8–315.2 mm/a and maximum of 1679.1–2128.4 mm/a from 1980 to 2018. The northeast was a high importance region where high water yield values were clustered, and the southwest was a low importance region where low water yield values were clustered. Water yield was highest in living space and lowest in ecological space. The relationship between land development and water yield service should be coordinated. Climate change had a more significant impact on water yield service than land use change. The results of this study are consistent with the actual situation and help to investigate and identify important areas of water resources in the monsoonal humid zone.
1. Introduction
Ecosystem service refers to the essential environmental conditions and utility provided by the ecosystem for the maintenance of human survival and development, which are also the benefits that humans receive directly or indirectly from ecosystems (Fisher and Turner 2008; Bennett et al. Citation2009; Daily Citation2013). Water yield is an important element of ecosystem services, reflecting the amount of water resources a region can provide to humans under resource background conditions. China has only 6% of the world's freshwater resources (Bao and Fang 2012), faces with high per capita shortage, and are characterized with abundance in the south and relative scarcity in the north. China has large population. The increasing conflict between people and the environment along with quick urbanization and economic development have made China become one of the major resource consuming countries (Hubacek et al. Citation2009). Even in the South China, where precipitation is abundant, there are also problems such as ecological protection in mountainous hilly areas, the uneven spatial and temporal distribution of water resources and the contradiction of social needs. Therefore, it is of great value to carry out water yield service assessment and identify the importance differences for coordinating the production-living-ecological spaces layout and ecosystem services.
The InVEST is always used to assess ecosystem services, which is expressed in maps. The spatialization of the output results makes it easy to identify the important areas of ecosystem services. The model has also been widely used for habitat quality and risk assessment (Choudhary et al. Citation2021), carbon storage and sequestration (Babbar et al. Citation2021), water yield (Belete et al. Citation2020; Natalia et al. Citation2020; Shirmohammadi et al. Citation2020; Daneshi et al. Citation2021; Wamucii et al. Citation2021; Bejagam et al. Citation2022), soil erosion and conservation (Gao et al. Citation2020; Kulimushi et al. Citation2021; Yang et al. Citation2021), and others ecosystem service researches (Ronchi et al. Citation2020; Sridharan et al. Citation2020).
The water yield service function of InVEST model simulates the spatial distribution of water yield service at grid scale based on the water balance method. The high vegetation cover and the undulating topography of South China allow the InVEST model to better reflect the water yield service in its natural environment. There are abundant precipitation and water resources, and thus some studies have been conducted in this region. In the southwest mountainous area, the land surface fluctuates violently and the soil and water loss is heavy. The ecological restoration project in this region has an insignificant benefit on water yield, both increase in soil erosion and water yield, and climate change contributes 73.06% to water yield (Dai et al. Citation2020). From 2000 to 2019, the water yield in the Danjiang River Basin in the southeastern part of the Qinling Mountains shows a decreasing trend, where it is an important water source for South-to-North Water Diversion Project and needs to be designated as a soil and water conservation important areas (Li et al. Citation2021). The Xiangjiang River Basin is a typical East Asian monsoon region, where precipitation was the most sensitive factor affecting water yield, followed by evapo-transpiration and Zhang coefficient (Yang et al. Citation2019). Rapidly urbanizing Shenzhen had an unbalanced spatial distribution of water supply and demand, where land use adjustment affects water yield (Chen et al. Citation2020). These studies provide some references for ecosystem water yield service in South China. We believe that there are the following perspectives that can be further considered. (1) Uncertainty of parameter Z value. (2) The existing research examples are relatively few and distributed in different watersheds. More research results are necessary for further understanding the ecosystem water yield service in South China. (3) The existing research does not consider the maintenance of ecosystem services and the rational development of land resources.
It is necessary to investigate the water yield service in the southern hilly region in China, where the monsoon climate changes greatly, the terrain does not easy to store water resources, and increased land use/land cover (LULC) in recent years may lead to irreversible degradation of ecosystem services. This study takes a case study in the middle and upper Ganjiang River basin, which is an important ecological reserve and water-conserving functional area in South China. The mineral exploitation, deforestation and urbanization carried out by local residents have threatened the ecological security. Therefore, we use the InVEST model to analyze the water yield service, in order to clarify the current situation of water yield service change in this region, the impact of climate and LULC change on water yield service, and put forward some suggestions on the use of land resources. We hope this will contribute to the maintenance of ecosystem services and the rational development and utilization of land resources.
2. Materials and methods
2.1. Study area
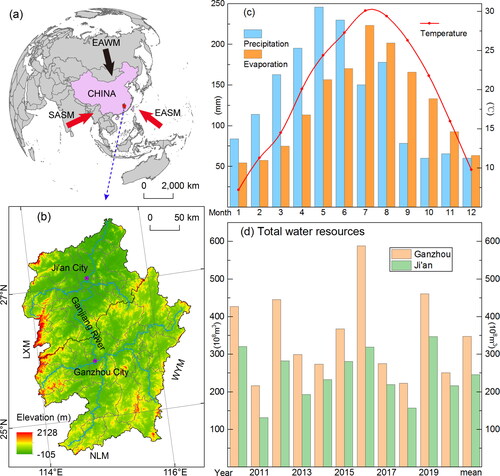
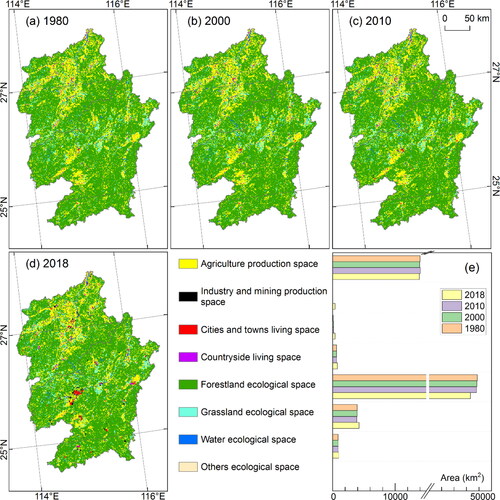
Ganjiang River is one of the eight major tributaries of the Yangtze River (Changjiang River). The middle and upper reaches of Ganjiang River (MU-GJR) (113°54′–116°38′E, 24°29′–27°57′N) are located in the south of Jiangxi Province which belongs to Southeastern Hills of China (). The topography is lower in the north-central and higher around, dominated by mountains, hills, and basins, and it’s surrounded by the Luoxiao Mountains in the west, the Nanling Mountains in the southwest and the Wuyi Mountains in the east () (Wang et al. Citation2021). Its climate is warm and humid with abundant precipitation which is mainly concentrated in spring and summer () (Wang et al. Citation2021). The average annual precipitation is about 1400–2400 mm and an average annual temperature is 14–23 °C (Wang et al. Citation2020). The MU-GJR is rich in water resources but highly variable, with total water resources of 348.23–907.9 × 10⁸m3 (mean 593.7 × 10⁸m3) from 2010 to 2020 (). The forest coverage reaches over 60%, with rich biological resources and high ecological value. The study area mainly belongs to the middle and upper reaches of Ganjiang River basin, and the southeast part belongs to the Dongjiang River basin (tributary of Pearl River) (Wang et al. Citation2021), which is an important ecological zone for soil and water conservation in China. The land use survey shows that forest land and cultivated are the main type, and land use dynamic degree of buildup land is larger (G Liu et al. Citation2021).
Figure 1. Study area. (a) Location of the middle and upper reaches of Ganjiang River basin (MU-GJR), where EASM, EAWM and SASM represent East Asian Summer Monsoon, East Asian Winter Monsoon and South Asian Summer Monsoon, respectively (Wang et al. Citation2021); (b) elevation and river system of MU-GJR, which is defined as the regions of Ganzhou and Ji'an City (G Liu et al. Citation2021), LXM, NLM and WYM represent Luoxiao Mountains, Nanling Mountains and Wuyi Mountains respectively; (c) monthly precipitation and evaporation (2000–2019) and monthly average temperature (2010–2019) at Ganzhou Meteorological Station (from http://data.cma.cn); (d) total water resources volume from 2010 to 2020.
2.2. Research framework and data sources
Based on the InVEST model, this study evaluates the spatial-temporal characteristics of water yield services in the monsoon hilly watershed in South China, and explores the impact of climate and LULC change on water yield services (). (1) Identify the study objective as MU-GJR water yield service assessment; (2) prepare data according to the InVEST model (); (3) debug the parameters of the assessment model, obtain results, and analyze the spatial-temporal characteristics of water yield service with climate and LULC change scenarios; and (4) discuss the parameters, compare the results, and put forward recommendations.
Figure 2. Research framework for water yield service based on InVEST model in MU-GJR.
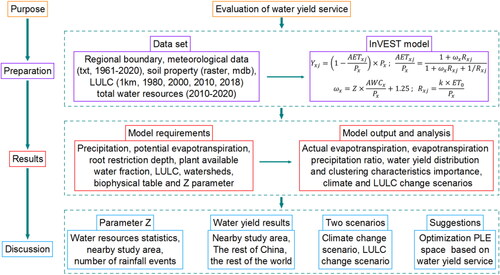
Table 1. Data sources of water yield service assessment.
There are five types of data, including watershed boundaries, meteorological data, soil data, LULC data, and total water resources data (). The watershed boundary includes Ganzhou City and Ji'an City (). Meteorological data include average annual precipitation from 2010–2020, annual precipitation in 1980, 2000, 2010, and 2018, average annual potential evapotranspiration from 1981–2015, and daily precipitation from 1961–2016. Soil properties, including content of sand, slit, clay, organic matter. LULC in 1980, 2000, 2010 and 2018 were classified as production-living-ecological spaces. Total water resources, including total water resources volume (it divides by area to get the water resources depth) and runoff depth. All data were unified into the projection coordinate system of Asia_Lambert_Conformal_Conic. ArcGIS10.2 was used for data pre-processing, and mapping exporting results from the InVEST model.
2.3. Water yield service assessment of InVEST model
The water yield assessment in InVEST (Integrated Valuation of Ecosystem Services and Tradeoffs) model is based on the water balance method, and comprehensively considers the effects of soil texture, soil structure, precipitation characteristics, solar radiation evaporation, surface transpiration, land use types, topography, water resources confluence, etc., which is calculated by the following equations (Terrado et al. Citation2014; Sharp et al. Citation2020):
(1)
(1)
(2)
(2)
(3)
(3)
(4)
(4)
(5)
(5)
(6)
(6)
In EquationEq. (1)(1)
(1) , Yxj is the average annual water yield (mm/a) of the jth land use in raster cell x; AETxj is the actual annual evapo-transpiration (mm/a) of the jth land use; Px is average annual precipitation (mm/a). AETxj/Px is based on the Budyko curve (Zhang et al. Citation2004), calculated from EquationEq. (2)
(2)
(2) . ωx is a non-physical parameter of natural climate-soil properties, calculated from EquationEq. (3)
(3)
(3) . Z (Zhang) is an empirical coefficient, which can represent the regional precipitation distribution and hydrogeological characteristics (Zhang et al. Citation2004); in this study, the simulation results were compared with the statistical data of average total water resources from 2010 to 2020 to calibrate the Z parameter. AWCx is the effective soil water content (mm), determined by soil texture and effective soil depth when the model requires the proportional parameter (plant available water fraction), calculated from EquationEq. (5)
(5)
(5) ; 1.25 is the ωx base parameter, which is the ratio of annual water demand to annual precipitation for vegetation in bare ground (root depth of 0) (Donohue et al. Citation2012). In EquationEq. (4)
(4)
(4) , Rxj is the dryness index of the jth land use type, which is the ratio of evapo-transpiration to precipitation; ET0 is the potential evapo-transpiration (mm/a); k is the evapo-transpiration coefficient, which is obtained from the vegetation leaf area index and can also be determined by the vegetation nature of LULC (Allen et al. Citation1998). In EquationEq. (5)
(5)
(5) , RLDx and RDx are restricted layer depth and root depth respectively. In EquationEq. (6)
(6)
(6) , PWACx is plant available water fraction; Sand, Silt, Clay and C are the content of soil sand, silt, clay and organic carbon, respectively.
2.4. Production-living-ecological spaces
Water yield service has obvious spatial heterogeneity. Analyzing the differences of water yield service under different land cover types is helpful to optimize ecosystem services. In this study, land use was divided into production-living-ecological (PLE) spaces according to the difference of land use functions () (Lv et al. Citation2013; Shi et al. Citation2018). The classification comprehensively considers the spatial multi-function of land, the centrality of ecological functions and the classification principle of the main functions, which is an important basis for sustainable development (Lv et al. Citation2013; Shi et al. Citation2018). Compared with LULC, PLE space can better reflect the distribution of human development and utilization of land resources. The water yield difference of different PLE space types was used as a reference for the optimal development of land resources. And PLE space change was used to analyze the impact of human activities on water yield.
Table 2. Corresponding system of production-living-ecological (PLE) space type and land use type.
2.5. High/low clustering
The High/Low Clustering (Getis-Ord Gi) is an inferential statistic which is used to analyze the clustering characteristics of elements in space (Mitchell, A., Citation2005) and similar to Moran's I (Guo et al., Citation2021). On the premise of passing the significance test, it is usually described by Z-score. If the z-score value is positive, indicating that high values (hot spots) for the attribute are clustered in the study area. Contrary if the z-score value is negative, indicating that low values (cold spots) are clustered. In this study ArcGIS10.2 was used to analyze the spatial characteristics of High/Low Clustering of water yield service, hot spots represent high water yield clusters, cold spots represent low water yield clusters.
2.6. Climate and LULC change scenarios
Climate and LULC change are important factors affecting water yield service (Daneshi et al. Citation2021; Wei et al. Citation2021). In the InVEST model, precipitation and actual evapotranspiration significantly influence water yield service under the water balance method, which in turn is influenced by LULC variability. To investigate the differences in the response of water yield service to climate and LULC changes, two scenarios were set up in this study (). Scenario 1 is climate change. The LULC in 2018 remains unchanged, and the precipitation in 1980, 2000, 2010 and 2018 are input successively. Scenario 2 is LULC change. The precipitation in 2018 remains unchanged, and LULC in 1980, 2000, 2010 and 2018 are input in proper sequence. The statistics of water yield service in 1980, 2000, 2010, and 2018, and the water yield service changes in 1980–2000, 2000–2010, and 2010–2018 to explore the differences of water services in the two scenarios.
Table 3. Water yield service under climate and LULC change scenarios.
3. Results
3.1. Input data of InVEST model for water yield service
3.1.1. Precipitation and potential evapotranspiration
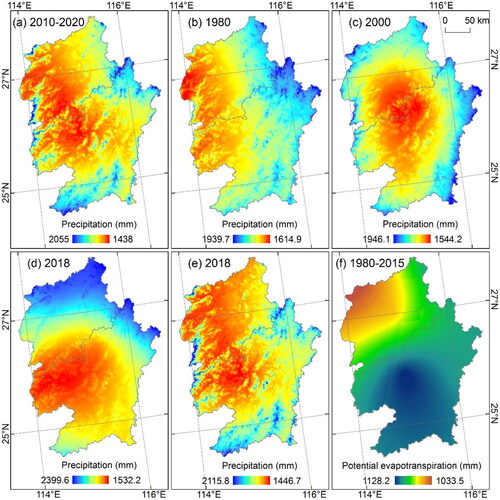
There are two types of precipitation data. The first was the average annual precipitation from 2010 to 2020 (), which coincides with the statistics time of the total water resources. This was to facilitate the debugging of model parameters. The second type was the annual precipitation in 1980, 2000, 2010, and 2018 (). The lowest annual precipitation was 1446.7–1614.9 mm and the highest was 1939.7–2399.6 mm, and the spatial distribution of precipitation was highly variable (). The annual potential evaporation was the average value from 1980 to 2015, 1033.5–1128.2 mm, which represents a relatively stable annual potential evaporation characteristic of the region.
Figure 3. Precipitation and potential evapotranspiration for InVEST model. (a) Average annual precipitation from 2010 to 2020; (b)–(e) annual precipitation from 1980 to 2010; (f) average annual potential evapotranspiration from 1980 to 2015.
3.1.2. Root restriction depth and plant available water fraction
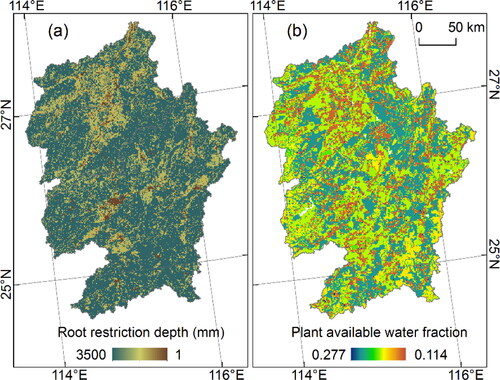
The root restriction depth was determined based on LULC. The range of root restriction depth was 1–3500 cm, larger in the woodland distribution area, covering more areas of MU-GJR; the smaller root restriction depth was in the urban and water distribution area, with block and strip distribution (). The PAWC was 0.114–0.277 (), reflecting the proportion of soil water content that could be used by crops, and its distribution characteristics were related to soil properties.
Figure 4. Root restriction depth in 2018 and plant available water fraction (PAWC).
3.1.3. LULC (PLE space) and watersheds
The PLE space was obtained by reclassification according to LULC. The agricultural production space was mainly distributed in the flat area in the middle and lower reaches of the river, with an area of about 1.4 × 10⁴ km2 (20.78% of the four-year average proportion); and the forestland ecological space was distributed in most areas, especially in the hilly area in the west, south and east, with an area of about 4.7 × 10⁴ km2 (70.49% of the four-year average proportion); and the area of other spaces was relatively small (). The watershed was based on the region of Ganzhou and Ji'an City, and no sub-basin was used.
Figure 5. Production-living-ecological spaces based on land use from 1980 to 2018. (a)–(d) Distribution of PLE spaces; (e) area of PLE spaces.
3.1.4. Biophysical table and Z parameter
According to relevant studies in the adjacent region, the root restriction depth was large for forest and grassland (reach 2400–3500 mm), moderate depth for agricultural land (about 2000 mm), and shallow depth for built-up land, water bodies and unused land (less than 10 mm) (Xu et al. Citation2016; Yang et al. Citation2019) ().The Kc value reflects the plant evapotranspiration coefficient for each land use type, and it ranging from 0 to 1.5. Refer to values taken from adjacent region of the same vegetation type (Xu et al. Citation2016; Yang et al. Citation2019) (). Vegetation cover was indicated by 1 and 0 for the presence or absence of vegetation cover, respectively, with agricultural production space, forestland and grassland ecological space having vegetation cover (taking the value 1) and other spaces set to no vegetation cover (taking the value 0).
Table 4. Biophysical table for water yield service assessment.
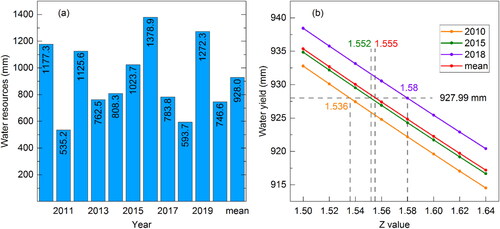
The statistics of the Water Resources Bulletin of Jiangxi Province in 2010–2020 showed that the water resources depth in the study area (Ganzhou and Ji'an City) was 927.99 mm (), which was used as a reference for debugging the Z value of the water yield service assessment of the InVEST model. The relationship between Z-value and water production was obtained by input data into the InVEST model, which data was the average annual precipitation from 2010–2020 and the LULC for the three years 2010, 2015 and 2018, respectively. This relationship showed that there was a difference in taking values of Z, and when Z takes a value of 1.555 in the curve of its mean, the water yield depth (928.72 mm) was closer to the statistical information (927.99 mm) ().
Figure 6. Total water resources and Z value. (a) Total water resources from 2010 to 2020, which is based on total water resources volume divided by area and is also equal to the runoff depth; (b) relationship between Z value and annual water yield of InVEST model, which parameters for precipitation and average total water resources based on average values from 2010 to 2020, and PLE space in 2010, 2015 and 2018, respectively.
3.2. Water yield service assessment results
3.2.1. Actual evapotranspiration and evapotranspiration precipitation ratio
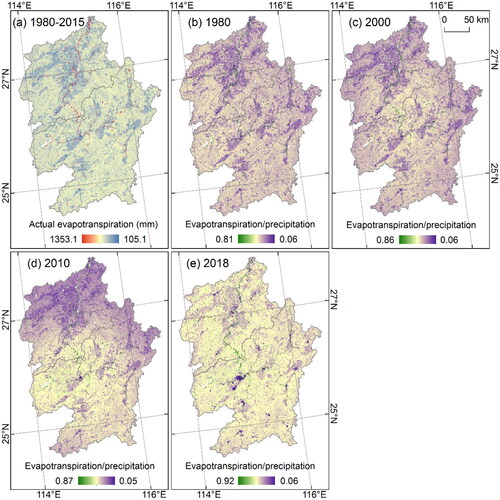
Actual evapotranspiration was 105.1–1353.1 mm/a (). It was highest near rivers and was distributed in a dotted line, while evapotranspiration was also relatively high in forested areas where surface water resources are abundant and can supply sufficient evaporation; actual evapotranspiration is lowest in urban areas, where impervious surfaces are widespread and surface water retention is low, limiting actual evapotranspiration (). The higher values (0.81–0.92) of evapotranspiration precipitation ratios also occur near rivers and the lower values (0.05–0.06) occur in urban areas, both with a scattered distribution (). The spatial distribution of actual evapotranspiration and evapotranspiration precipitation ratios was closely related to land cover conditions, especially manifested in urban living spaces, where actual evapotranspiration and evapotranspiration precipitation ratios were low. Since the great modification of the surface environment in such areas was irreversible, we should consider the ecological effects of land development on the water environment.
Figure 7. Actual evapotranspiration and evapotranspiration precipitation ratio. (a) Average annual actual evapotranspiration from 1980 to 2018; (b)–(e) evapotranspiration precipitation ratio from 1980 to 2018.
3.2.2. Water yield service assessment results from 1980 to 2018
The overall distribution of water yield in the MU-GJR was high in the northeast (middle reaches) and low in the southwest (upper reaches), with minimum of 111.8–315.2 mm/a and maximum of 1679.1–2128.4 mm/a from 1980 to 2018(). There was no significant spatial differentiation in 1980, 2000 and 2018 (, 8b, and 8d), and relatively high in the north and northeast with large spatial differences in 2010 (). Annual water yield was 1236.3, 1174.2, 1373 and 1091.9 respectively, which decreased from 1980–2000 and from 2010–2018, and increased from 2000–2010 with increased differences in minimum and maximum values ().
Figure 8. Water yield service results based on InVEST model. (a)–(d) Annual water yield distribution from 1980 to 2018; (e) water yield statistics, where the bars indicate the mean water yield and the line segments indicate the water yield range in study area; (f)–(h) changes distribution of water yield in 1980–2000, 2000–2010 and 2010–2018, respectively; (i) water yield change statistics, where the bars indicate the mean water yield change and the line segments indicate the water yield change range.
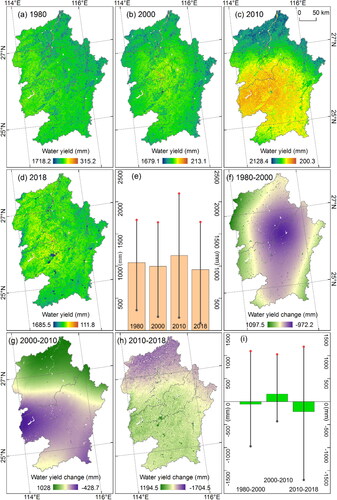
The variation in water yield was relatively significant, with decreased of 428.7–1704.5 mm and increased of 1028–1194.5 mm (). In 1980–2000, the central mountainous area of the water yield decreased significantly and the periphery was an increase (); in 2000–2010, the southern of the water yield decreased and the northern was increased (); and in 2010–2018, there was a decreased in north, and an increase in most region of the south (). The overall spatial variation in water yield from 1980 to 2018 was significant, with the largest increase from 2000–2010, and the largest decrease from 2010–2018 ().
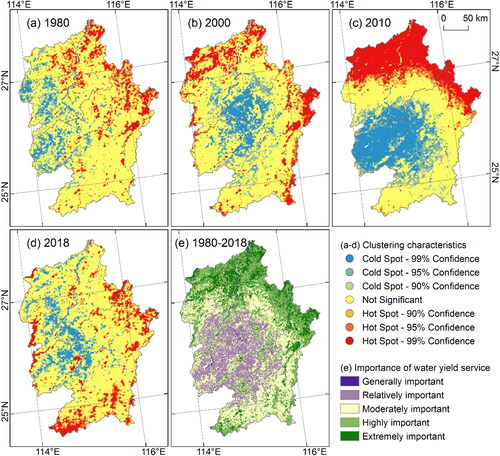
3.2.3. Clustering characteristics and importance of water yield service
The water yield service in the MU-GJR from 1980–2018 shows obvious aggregation characteristics (). Hot spots are concentration areas of high water yield, cold spots are concentration areas of low water yield, and without obvious aggregation are transition areas between high and low water yield. In 1980, hot and cold spots in the northeast and west, respectively (); in 2000, the cold spots were distributed in irregular concentric polygon with the central part as the center, and the northwest and southeast were hot spots (); in 2010, the aggregation feature was most obvious, with cold spots distributed in a semicircle centered in the southwest and hot spots distributed in the north (); and in 2018, cold spots in the central part and hot spots in the east and south (). Using the natural breaks classification, the importance of water yield service in the study area in average annual water yield from 1980 to 2018 was classified into 5 categories (). The north and northeast were extreme importance region, with a gradual transition to generally importance toward the southwest. This can be used as a reference for the conservation of ecosystem water yield service.
Figure 9. Clustering characteristics and importance of water yield service from 1980 to 2018. (a)–(d) Clustering characteristics; (e) importance of water yield service, which is the average annual water yield from 1980 to 2018, and classified by natural breaks.
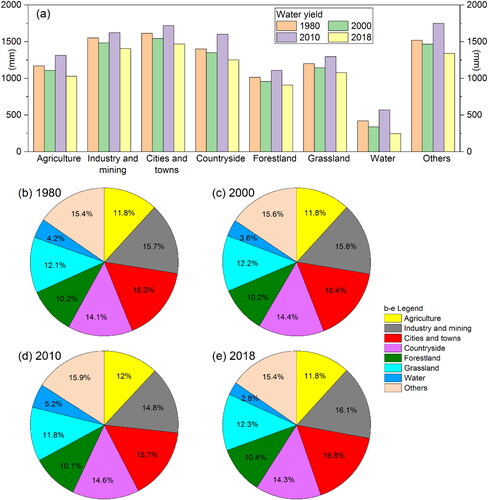
3.2.4. Water yield service difference in PLE space
There were differences in the water yield of different PLE space types, with the highest mean value of water yield in living space (1494.1 mm/a), followed by production space (1335.6 mm/a) and the lowest in ecological space (1022.9 mm/a) (). In 1980–2018, the average proportion of water yield in the three PLE space types were 27.4%, 30.7% and 42%, respectively (). Specifically, the water yield of industrial and mining production space (1405.9–1620.9 mm/a, 14.8%–16.1%), cities and towns living space (1469.9–1720.3 mm/a, 15.7%–16.8%), countryside living space (1252.8–1601.7 mm/a, 14.1%–14.6%) and other ecological space (1342.4–1750.3 mm/a, 15.4%–15.9%) was higher, which may be due to the low evapotranspiration in these areas with less vegetation and weaker ability to trap precipitation. In contrast, agricultural production space (1029.1–1314.2 mm/a, 11.8%–12%), forestland ecological space (908.5–1110.4 mm.a, 10.1%–10.4%), grassland ecological space (1078.2–1296.2 mm/a, 11.8%–12.3%) and the water bodies ecological space (248.4–570.2 mm/a, 2.8%–5.2%) have higher soil water content and high evapotranspiration capacity, and thus lower surface water yield.
Figure 10. Difference of water yield service in PLE space. (a) Changes of water yield, and (b) proportion of water yield of PLE spaces from 1980 to 2018.
3.3. Water yield service change under climate and PLE spaces change scenarios
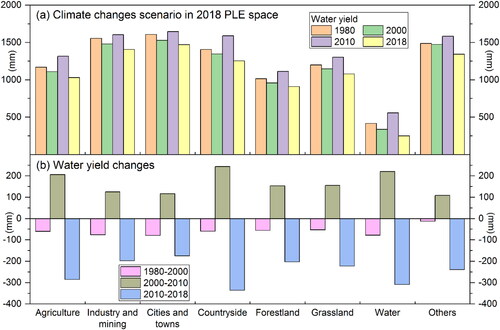
3.3.1. Climate change scenario
Under the 2018 PLE space conditions, the climate change scenario resulted in water yield of 1231.4 mm/a, 1172 mm/a, 1338 mm/a and 1091.9 mm/a from 1980 to 2018, respectively (). Average water yield was 1333 mm/a, 1480.2 mm/a and 1010 mm/a in production space, living space, ecological space lands, respectively (). The water yield decreased 12.7–79.3 mm from 1980–2000 and 174.9–335.8 mm from 2010–2018, and increased 108.4–243.5 mm from 2000–2010 (). The change characteristics of water yield were consistent with those of precipitation ().
Figure 11. Water yield changes under climate changes scenario in 2018 PLE space. (a) Water yield statistics of different PLE space; (b) water yield changes of different PLE space.
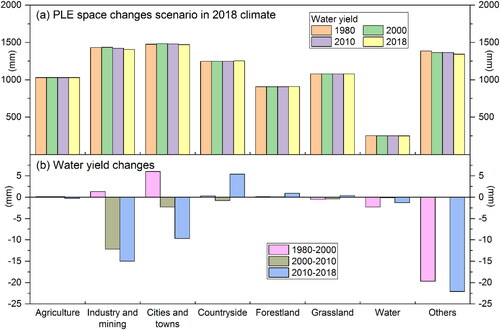
3.3.2. PLE spaces change scenario
Under the 2018 climatic conditions, the PLE space change scenario resulted in water yield of 1100.9 mm/a, 1099.1 mm/a, 1099.1 mm/a and 1091.9 mm/a from 1980 to 2018, respectively (). Average water yield were 1226.1 mm/a, 1362.9 mm/a and 900 mm/a in production space, living space, ecological space lands, respectively (). The water yield change −19.7–6 mm from 1980–2000, −12.2–0.1 mm from 2000–2010, and −22.1–0.9 mm from 2010–2018, respectively ().
Figure 12. Water yield changes under PLE space changes scenario in 2018 climate. (a) Water yield statistics of different PLE space; (b) water yield changes of different PLE space.
4. Discussion
4.1. Value of parameter Z
Z value is a parameter characterizing precipitation characteristics. For areas with similar water resources, more precipitation gives higher Z value (Zhang et al. Citation2004). This study debugged the Z value based on statistical data of total water resources, and obtained 1.555 for Z value (). And the results were similar to the water yield and distribution characteristics shown by the ecosystem service assessment in the entire Ganjiang River Basin (Wang et al. Citation2016), which indicated reliable results. For the same subtropical monsoon region, Z values were 2.32 and 7 in southern and central Hunan Province (located in west of the study area), respectively (Xu et al. Citation2016; Yang et al. Citation2019), and 4 and 11.5285 in southern and whole Fujian Province (located in the east of the study area), respectively (Huang and Peng 2017; Y Liu et al. Citation2021), and 6.5 in northern Zhejiang Province (located in northeastern Jiangxi Province) (Zhang et al. Citation2012). These values were differences, also different from this study, which shows that even under similar climatic conditions, the differences of surface environment and spatial scale in a region may affect the Z value.
Donohue et al. (Citation2012) studied a series of climatic conditions in Australia and showed that the seasonal parameter Z can also be determined by the formula of Z = 0.2 × N (N represents the number of rainfall events per year). The Ganzhou Meteorological Station is located in the middle of the study and recorded 8913 days of precipitation from 1960 to 2016, with an average of 156.4 days of precipitation per year (). According to the formula of Donohue et al. (Citation2012), Z should be 31.28, but it is beyond the value range of 1–30 of parameter Z. This indicates that this method may not be suitable for regions with high precipitation frequency.
Table 5. Precipitation days of Ganzhou Meteorological Station from 1960 to 2016.
4.2. Comparison of water yield service in different study areas
Based on the InVEST model, the water yield of MU-GJR was obtained as 1091.9–1236.3 mm/a (). The study area is located in South China, which is an East Asian monsoon influenced area with high variability of precipitation, so the water resources change greatly. South China has better vegetation coverage and high water conservation capacity. Studies have shown that the water yield was high in South China (Zhang et al. Citation2012; Wang et al. Citation2016; Xu et al. Citation2016; Yang et al. Citation2019; Huang and Peng 2017; Y Liu et al. Citation2021).
InVEST model was widely used in other regions in China (Wang and Dai Citation2020; Gong et al. Citation2021; Ma et al. Citation2021; Song et al. Citation2021). The conflict between water supply and demand is prominent in North China, where agricultural production, urban construction, and population distribution are relatively intensive. Bai et al. (Citation2011) focused on the spatial characteristics of biodiversity and ecosystem services and found a positive correlation between biodiversity and water yield in the Baiyangdian watershed. The fallowing and grass restoration project may have caused the decrease in water yield from 1990 to 2012 in the West Liaoning River Basin (Wu et al. Citation2019). The spatial variation in water yield in North China is large, as water yield is more sensitive to temperature and precipitation fluctuations in wet forest land and warm grasslands, respectively (Yin et al. Citation2020). Cong et al. (Citation2020) compared the simulation results of SWAT and InVEST models on hydrological ecosystem services in the Nansihu Lake Basin. They found that the overall pattern of soil and water conservation services was consistent, the pattern of water yield service was consistent in the mountainous area, while the pattern of water purification services was consistent in the plain. Northwest China is an arid and semi-arid region with scarce water resources and fragile ecological environment. Water yield and changes there are always a hot topic. Several studies based on InVEST model shows that water yields in the Qinghai Lake Basin, the Bosten Lake Basin and the upper reaches of the Shuler River had gradually increased in recent decades, but with spatial differences, as climate change driving more pronounced effect than that from land use changes (Lian et al. Citation2019; Yang et al. Citation2020; Wei et al. Citation2021). The Loess Plateau is an important ecological function area in Northwest China, which is located in the semi-humid to semi-arid transition zone with frequent human activities and gradually increasing water needs. The water holding capacity of different forest types in the region varies widely (Lv et al. Citation2017), water yield was significantly decreasing while evapo-transpiration of different land use types were increasing. The trade-offs and synergies between water yield service and other factors differ with different spatial and temporal scales (Hou et al. Citation2017). Water production services based on the InVEST model have been extensively studied in other locations around the world. Significant spatial variability in water supply and negative impacts on future water security in forested watersheds in the semi-arid zone of Iran further increases the pressure on its inhabitants, economic activities and ecological values (Daneshi et al. Citation2021). The vast majority of the variation in water production in the source region of the Blue Nile Basin in Africa from 2003–2017 was contributed by climate variability (Belete et al. Citation2020). Most areas within and outside the East African forest water towers are under pressure from human impacts, but water production services are more sensitive to climate change (Wamucii et al. Citation2021). As these observed contributions from climate change are more pronounced, it is also a direction to pay attention to the impact of future climate change on water yield and evapotranspiration (Natalia et al. Citation2020; Shirmohammadi et al. Citation2020; Bejagam et al. Citation2022). These studies provide abundant references for the water yield service assessment with different spatial-temporal scales. In addition, it also shows that the environmental background differences will affect the water yield while the water yield has different sensitivity to climate and land use change. Therefore, regional factors need to be considered in the specific study area.
4.3. Impact of climate and LULC changes on water yield service
Climate and land use change are often analyzed together for their impact on water yield services (Mo et al. Citation2021). This topic was also discussed in this study. Under climate change scenarios, water yield decreased by 59.3 mm from 1980–2000, increased by 166 mm from 2000–2010, and decreased by 246 mm from 2010–2018; while under LULC change scenarios, water yield decreases by only 1.8 mm, 1.9 mm and 5.2 mm, respectively. This result indicates that precipitation changes have a more significant effect on water yield service than LULC changes.
There were numerous factors that influence water yield service, among which climatic factors were an important (Sun et al. Citation2011; Pan et al. Citation2013; Chang and Bonnette 2016; Delphin et al. Citation2016; Dai and Wang Citation2020; Bejagam et al. Citation2022). Climatic conditions determine the spatial and temporal distribution of water resources and influence precipitation and potential evaporation (Dai and Wang Citation2020). South China is controlled by the monsoon climate, with high variable temperature and precipitation, leading to great changes of water resources. LULC changes are the most obvious manifestation of the effect of human activities on ecological environment. LULC changes had obvious impact on the spatiotemporal characteristics of ecosystem services such as water yield service (Gao et al. Citation2017; Zhang et al. Citation2019; Akhtar et al. Citation2020; Aneseyee et al. Citation2020; Latinopoulos et al. Citation2021; Liang et al. Citation2021; Singkran et al. Citation2021), even more impact than that from the climate driving effect (Hu et al. Citation2020). LULC changes also have an irreversible changing trend, especially urbanization and the increase of impervious surface, which greatly changes the distribution of surface water and groundwater resources and also affects evapo-transpiration process.
4.4. PLE space optimization suggestions based on water yield service
Combining the distribution of the PLE space (), the importance of water yield service () and the difference of water yield service in PLE space (), we have the following preliminary suggestions. The production space is distributed in a sheet-band, mainly in areas with flat topography and sufficient water resources. There may be competition between production space and water yield service in the north, so the development pattern of both needs to be coordinated. The western is less important, but the mountainous hills are widespread and also not suitable for large-scale development and construction, and production activities should be reduced to be located there. The coverage of living space is small, and it is only distributed in the river valley area. Combined with the natural environment and ecological protection policy of the study area, the scope of living space should not be expanded, so both town and village planning should be intensified to improve land use efficiency. The ecological space covers a wide range. According to the importance assessment of water yield service, the northeast is of high importance and can be used as an important water connotation area, which should focus on ecological protection. Residents can be relocated in ecologically fragile areas to cultivate sustainable industries and reduce the ecological and environmental costs of economic and social construction. It should be noted that these optimization recommendations are only based on the importance of water production services. A variety of factors should be taken into account in territorial spatial planning, and decisions should be made carefully.
5. Conclusion
This study evaluated the water yield service in the middle and upper reaches of the Ganjiang River basin based on the InVEST model. Analyzed the values of parameter Z, the differences in water yield between different PLE space, and the effects of climate and PLE space changes on water yield. The results showed that when the parameter Z value is taken as 1.555, the water yield (928.72 mm/a) was the closest to the statistical data of total water resources (927.99 mm/a in average 2010-2020). The overall distribution of water yield in the MU-GJR was high in the northeast (middle reaches) and low in the southwest (upper reaches), with minimum of 111.8–315.2 mm/a and maximum of 1679.1–2128.4 mm/a from 1980 to 2018. The Getis-Ord Gi results show that high water yield concentrated in the northeast and low water yield concentrated in the southwest. The importance of water yield service was closely related to water yield. The statistical results of water yield in the PLE space show that water yield was highest in the living space and lowest in the ecological space. The distribution of the PLE space, the importance of water yield service and the difference of water yield service in PLE space suggest that the relationship between land development and water yield service should be coordinated. The results of scenario analysis show that climate change had a more significant impact on water yield service than land use change.
Authors’ contributions
Xiaojun Wang: Conceptualization, Investigation, Writing—original draft, Writing—Review & Editing, Project administration. Guangxu Liu: Supervision, Writing—Review & Editing, Project administration, Funding acquisition. Durui Lin, Yingbing Lin, Yi Lu, Aicun Xiang and Shumei Xiao: Methodology, Data processing, Software. All authors have read and agreed to the published version of the manuscript.
Acknowledgements
This work was supported by the Science and Technology Project of Jiangxi Provincial Department of Education (GJJ201419), the Humanities and Social Science Research Planning Project for Universities of Jiangxi Province (GL20116), the University Students Innovation Practice Training Program of The Chinese Academy of Sciences, and the Climbing Program Special Funds for Science and Technology Innovation Strategy of Guangdong Province (pdjh2020b0169). The authors thank editor and anonymous reviewers for their constructive comments, suggestions, and help in enhancing the manuscript.
Data availability statement
All data supporting the findings of this study are included within the article. Data will be made available from authors on reasonable request.
Disclosure statement
The authors declare that they have no known competing financial interests or personal relationships that could have appeared to influence the work reported in this paper.
References
- Akhtar M, Zhao Y, Gao G, Gulzar Q, Hussain A, Samie A. 2020. Assessment of ecosystem services value in response to prevailing and future land use/cover changes in Lahore, Pakistan. Reg Sust. 1(1):37–47.
- Allen RG, Pereira LS, Raes D, Smith M. 1998. Crop evapotranspiration-Guidelines for computing crop water requirements-FAO Irrigation and drainage paper 56. FAO, Rome. 300(9):D05109.
- Aneseyee AB, Soromessa T, Elias E. 2020. The effect of land use/land cover changes on ecosystem services valuation of Winike watershed, Omo Gibe basin, Ethiopia. Hum Ecol Risk Assess. 26(10):2608–2627.
- Babbar D, Areendran G, Sahana M, Sarma K, Raj K, Sivadas A. 2021. Assessment and prediction of carbon sequestration using Markov chain and InVEST model in Sariska Tiger Reserve, India. J Cleaner Prod. 278:123333.
- Bai Y, Zhuang C, Ouyang Z, Zheng H, Jiang B. 2011. Spatial characteristics between biodiversity and ecosystem services in a human-dominated watershed. Ecol Complexity. 8(2):177–183.
- Bao C, Fang CL. 2012. Water resources flows related to urbanization in China: challenges and perspectives for water management and urban development. Water Resour Manage. 26(2):531–552.
- Bejagam V, Keesara VR, Sridhar V. 2022. Impacts of climate change on water provisional services in Tungabhadra basin using InVEST Model. River Res Apps. 38(1):94–106.
- Belete M, Deng J, Abubakar GA, Teshome M, Wang K, Woldetsadik M, Zhu E, Comber A, Gudo A. 2020. Partitioning the impacts of land use/land cover change and climate variability on water supply over the source region of the Blue Nile Basin. Land Degrad Dev. 31(15):2168–2184.
- Bennett EM, Peterson GD, Gordon LJ. 2009. Understanding relationships among multiple ecosystem services. Ecol Lett. 12(12):1394–1404.
- Chang H, Bonnette MR. 2016. Climate change and water‐related ecosystem services: impacts of drought in California, USA. Ecosyst Health Sust. 2(12):e01254.
- Chen X, Li F, Li X, Hu Y, Hu P. 2020. Evaluating and mapping water supply and demand for sustainable urban ecosystem management in Shenzhen, China. J Cleaner Prod. 251:119754.
- Choudhary A, Deval K, Joshi PK. 2021. Study of habitat quality assessment using geospatial techniques in Keoladeo National Park, India. Environ Sci Pollut Res Int. 28(11):14105–14114.
- Cong W, Sun X, Guo H, Shan R. 2020. Comparison of the SWAT and InVEST models to determine hydrological ecosystem service spatial patterns, priorities and trade-offs in a complex basin. Ecol Indic. 112:106089.
- Dai E, Yin L, Wang Y, Ma L, Tong M. 2020. Quantitative assessment of the relative impacts of land use and climate change on the key ecosystem services in the Hengduan Mountain region, China. Sustainability. 12(10):4100.
- Dai E, Wang Y. 2020. Attribution analysis for water yield service based on the geographical detector method: a case study of the Hengduan Mountain region. J Geogr Sci. 30(6):1005–1020.
- Daily GC. 2013. Nature’s services: societal dependence on natural ecosystems (1997). New Haven: Yale University Press. p. 454–464.
- Daneshi A, Brouwer R, Najafinejad A, Panahi M, Zarandian A, Maghsood FF. 2021. Modelling the impacts of climate and land use change on water security in a semi-arid forested watershed using InVEST. J Hydrol. 593:125621.
- Delphin S, Escobedo FJ, Abd-Elrahman A, Cropper WP. 2016. Urbanization as a land use change driver of forest ecosystem services. Land Use Policy. 54:188–199.
- Donohue RJ, Roderick ML, McVicar TR. 2012. Roots, storms and soil pores: incorporating key ecohydrological processes into Budyko’s hydrological model. J Hydrol. 436-437:35–50.
- Fisher B, Turner RK. 2008. Ecosystem services: classification for valuation. Biol Conserv. 141(5):1167–1169.
- Gao J, Li F, Gao H, Zhou C, Zhang X. 2017. The impact of land-use change on water-related ecosystem services: a study of the Guishui River Basin, Beijing, China. J Cleaner Prod. 163:S148–S155.
- Gao M, Xiao Y, Hu Y. 2020. Evaluation of water yield and soil erosion in the three-river-source region under different land-climate scenarios. J Resour Ecol. 11(1):13–26.
- Gong J, Cao E, Xie Y, Xu C, Li H, Yan L. 2021. Integrating ecosystem services and landscape ecological risk into adaptive management: insights from a western mountain-basin area, China. J Environ Manage. 281:111817.
- Guo B, Wang X, Pei L, Su Y, Zhang D, Wang Y. 2021. Identifying the spatiotemporal dynamic of PM2.5 concentrations at multiple scales using geographically and temporally weighted regression model across China during 2015-2018. Sci Total Environ. 751:141765.
- Hou Y, Lü Y, Chen W, Fu B. 2017. Temporal variation and spatial scale dependency of ecosystem service interactions: a case study on the central Loess Plateau of China. Landscape Ecol. 32(6):1201–1217.
- Hu W, Li G, Gao Z, Jia G, Wang Z, Li Y. 2020. Assessment of the impact of the Poplar Ecological Retreat Project on water conservation in the Dongting Lake wetland region using the InVEST model. Sci Total Environ. 733:139423.
- Huang Z, Peng B. 2017. Measuring and mapping the impact of land use and land cover change on the hydropower production: a case study of Jiulong River in Fujian Province. J Water Resour Res. 6(4):370–383.
- Hubacek K, Guan D, Barrett J, Wiedmann T. 2009. Environmental implications of urbanization and lifestyle change in China: ecological and water footprints. J Cleaner Prod. 17(14):1241–1248.
- Kulimushi LC, Maniragaba A, Choudhari P, Elbeltagi A, Uwemeye J, Rushema E, Singh SK. 2021. Evaluation of soil erosion and sediment yield spatio-temporal pattern during 1990–2019. Geomatics Nat Hazards Risk. 12(1):2676–2707.
- Latinopoulos D, Koulouri M, Kagalou I. 2021. How historical land use/land cover changes affected ecosystem services in lake Pamvotis, Greece. Hum Ecol Risk Assess. 27(6):1472–1491.
- Li M, Liang D, Xia J, Song J, Cheng D, Wu J, Cao Y, Sun H, Li Q. 2021. Evaluation of water conservation function of Danjiang River Basin in Qinling Mountains, China based on InVEST model. J Environ Manage. 286:112212.
- Lian XH, Qi Y, Wang HW, Zhang JL, Yang R. 2019. Assessing changes of water yield in Qinghai Lake Watershed of China. Water. 12(1):11.
- Liang J, Li S, Li X, Li X, Liu Q, Meng Q, Meng Q, Lin A, Li J. 2021. Trade-off analyses and optimization of water-related ecosystem services (WRESs) based on land use change in a typical agricultural watershed, southern China. J Cleaner Prod. 279:123851.
- Liu G, Wang X, Xiang A, Wang X, Wang B, Xiao S. 2021. Spatial heterogeneity and driving factors of land use change in the middle and upper reaches of Ganjiang River region, southern China. Ying Yong Sheng Tai Xue Bao. 32(7):2545–2554.
- Liu Y, Shi X, Shi W. 2021. Evaluation of water retention services of forest ecosystems in Fujian Province: comparison between results from the InVEST model and meta-analysis. Acta Ecol Sin. 41(4):1349–1361.
- Lv LG, Zhou SL, Zhou BB, Dai L, Chang T, Bao GY, Zhou H, Li Z. 2013. Land use transformation and its eco-environmental response in process of the regional development: a case study of Jiangsu province. Sci Geogr Sin. 33(12):1442–1449.
- Lv X, Zuo Z, Xiao P. 2017. Evaluation of water conservation capacity of loess plateau typical mountain ecosystems based on InVEST model simulation. IOP Conf Ser: Earth Environ Sci. 69(1):012030.
- Ma S, Wang LJ, Zhu D, Zhang J. 2021. Spatiotemporal changes in ecosystem services in the conservation priorities of the southern hill and mountain belt, China. Ecol Indic. 122:107225.
- Mitchell A. 2005. The ESRI Guide to GIS Analysis, Volume 2: Spartial measurements and statistics. Redlands: ESRI Press.
- Mo W, Zhao Y, Yang N, Xu Z, Zhao W, Li F. 2021. Effects of climate and land use/land cover changes on water yield services in the Dongjiang Lake Basin. IJGI. 10(7):466.
- Natalia P, Silvia F, Silvina S, Miguel P. 2020. Climate change in northern Patagonia: critical decrease in water resources. Theor Appl Climatol. 140(3–4):807–822.
- Pan T, Wu SH, Dai EF, Liu YJ. 2013. Spatiotemporal variation of water source supply service in Three Rivers Source Area of China based on InVEST model. Ying Yong Sheng Tai Xue Bao. 24(1):183–189.
- Ronchi S, Salata S, Arcidiacono A. 2020. Which urban design parameters provide climate-proof cities? An application of the Urban Cooling InVEST Model in the city of Milan comparing historical planning morphologies. Sust Cities Soc. 63:102459.
- Sharp R, Douglass J, Wolny S, Arkema K, Bernhardt J, Bierbower W, Chaumont N, Denu D, Fisher D, Glowinski K, et al. 2020. InVEST 3.10.2 user’s guide. The Natural Capital Project, Stanford University, University of Minnesota, The Nature Conservancy, and World Wildlife Fund. https://naturalcapitalproject.stanford.edu/software/invest.
- Shi Z, Deng W, Zhang S. 2018. Spatio-temporal pattern changes of land space in Hengduan Mountains during 1990–2015. J Geogr Sci. 28(4):529–542.
- Shirmohammadi B, Malekian A, Salajegheh A, Taheri B, Azarnivand H, Malek Z, Verburg PH. 2020. Impacts of future climate and land use change on water yield in a semiarid basin in Iran. Land Degrad Dev. 31(10):1252–1264.
- Singkran N, Intharawichian N, Anantawong P. 2021. Determining land use influences on the hydrologic regime of the Chao Phraya River Basin, Thailand. Phys Chem Earth. 121:102978.
- Song F, Su F, Mi C, Sun D. 2021. Analysis of driving forces on wetland ecosystem services value change: a case in Northeast China. Sci Total Environ. 751:141778.
- Sridharan V, Shivakumar A, Niet T, Ramos EP, Howells M. 2020. Land, energy and water resource management and its impact on GHG emissions, electricity supply and food production-Insights from a Ugandan case study. Environ Res Commun. 2(8):085003.
- Sun G, Caldwell P, Noormets A, McNulty SG, Cohen E, Myers JM, Domec JC, Treasure E, Mu Q, Xiao J, et al. 2011. Upscaling key ecosystem functions across the conterminous United States by a water-centric ecosystem model. J Geophys Res. 116(G3):1–16.
- Terrado M, Acuña V, Ennaanay D, Tallis H, Sabater S. 2014. Impact of climate extremes on hydrological ecosystem services in a heavily humanized Mediterranean basin. Ecol Indic. 37:199–209.
- Wamucii CN, van Oel PR, Ligtenberg A, Gathenya JM, Teuling AJ. 2021. Land-use and climate change effects on water yield from East African Forested Water Towers. Hydrol Earth Syst Sci. 25(11):5641–5665.
- Wang X, Dai E, Zhu J. 2016. Spatial patterns of forest ecosystem services and influencing factors in the Ganjiang River Basin. J Resour Ecol. 7(6):439–452.
- Wang X, Liu G, Xiang A, Xiao T. 2020. Evaluation of comprehensive potential productivity and resource utilization efficiency of Camellia oleifera in Jiangxi Province. Ying Yong Sheng Tai Xue Bao. 31(4):1175–1184.
- Wang Y, Dai E. 2020. Spatial-temporal changes in ecosystem services and the trade-off relationship in mountain regions: a case study of Hengduan Mountain region in Southwest China. J Cleaner Prod. 264:121573.
- Wang X, Zhong W, Li T, Quan M, Wang B, Wei Z. 2021. A 16.2-kyr lacustrine sediment record of mercury deposition in Dahu Swamp, eastern Nanling Mountains, southern China: analysis of implications for climatic changes. Quat Int. 592:12–21.
- Wei P, Chen S, Wu M, Deng Y, Xu H, Jia Y, Liu F. 2021. Using the InVEST model to assess the impacts of climate and land use changes on water yield in the upstream regions of the Shule River basin. Water. 13(9):1250.
- Wu K, Gu J, Zhang N. 2019. Evaluation on water source conservation capacity of West Liaohe River Basin based on InVEST model. In 2019 International Conference on Smart Grid and Electrical Automation (ICSGEA), 443–447.
- Xu J, Xiao Y, Xie G, Wang S, Zhu W. 2016. Spatiotemporal analysis of water supply service in the Dongjiang Lake Basin. Acta Ecol Sin. 36(15):4892–4906.
- Yang D, Liu W, Tang L, Chen L, Li X, Xu X. 2019. Estimation of water provision service for monsoon catchments of South China: applicability of the InVEST model. Landsc Urban Plann. 182:133–143.
- Yang X, Chen R, Meadows ME, Ji G, Xu J. 2020. Modelling water yield with the InVEST model in a data scarce region of northwest China. Water Supply. 20(3):1035–1045.
- Yang X, Guo B, Lu Y, Zhang R, Zhang D, Zhen X, Chen S, Wu H, Wei C, Yang L, et al. 2021. Spatial–temporal evolution patterns of soil erosion in the Yellow River Basin from 1990 to 2015: impacts of natural factors and land use change. Geomat Nat Hazards Risk. 12(1):103–122.
- Yin G, Wang X, Zhang X, Fu Y, Hao F, Hu Q. 2020. InVEST model-based estimation of water yield in North China and its sensitivities to climate variables. Water. 12(6):1692.
- Zhang C, Li W, Zhang B, Liu M. 2012. Water yield of Xitiaoxi river basin based on InVEST modeling. J Resour Ecol. 3(1):50–54.
- Zhang F, Yushanjiang A, Jing Y. 2019. Assessing and predicting changes of the ecosystem service values based on land use/cover change in Ebinur Lake Wetland National Nature Reserve, Xinjiang, China. Sci Total Environ. 656:1133–1144.
- Zhang L, Hickel K, Dawes WR, Chiew FH, Western AW, Briggs PR. 2004. A rational function approach for estimating mean annual evapotranspiration. Water Resour Res. 40(2):W0250.