
 ?Mathematical formulae have been encoded as MathML and are displayed in this HTML version using MathJax in order to improve their display. Uncheck the box to turn MathJax off. This feature requires Javascript. Click on a formula to zoom.
Abstract
Increasing drought patterns with profound effects on livelihoods and food security have been documented in Ethiopia. From previous studies', assessments at various timescales, Ethiopia is regarded as a drought-prone country in East Africa. However, there is no documentation available. This paper investigates the spatiotemporal patterns of drought characteristics in 16 woredas (districts) as well as in the 14 homogeneous rainfall zones of homogeneous using monthly rainfall and temperature data over the period 1983 to 2020. The Standardized Precipitation Index (SPI) and Standardized Precipitation Evapotranspiration Index (SPEI) were computed using time-series meteorological data to depict the spatial extent of drought characteristics and patterns at 4- and 12-month timescales. Within the period investigated, 12-month, 2015, and 2019 recorded the most extreme countrywide drought. The most prolonged drought duration lasted for 12 months in 2015. Although Ethiopia is a drought-prone country, the frequency, magnitude, and severity vary spatially by region. In planning for future actions, particular emphasis must be paid to the northeastern, eastern, northwestern, and southeastern parts of the country, which are more vulnerable. The findings could potentially influence and redirect national drought management and disaster preparedness programs for the affected areas.
HIGHLIGHTS
1984 and 2015 were years with the most severe and countrywide extreme drought episodes.
The average SPI and SPEI from 1983 to 2020 showed a weak positive trend.
Drought magnitude ranges from −1.7 to −2.1 for SPEI 4 and −1.9 to −2.1 for SPEI-12-months.
2015 experienced the most prolonged drought with a length of about 12 months.
Stakeholders should give particular attention to Ethiopia's northeastern, central, and southeastern parts.
1. Introduction
Ethiopia is mainly characterized as an arid and semi-arid country with high precipitation variability (Negash et al., Citation2020; Kourouma et al. Citation2021; Eze et al. Citation2022). Over the past 57 years, Ethiopia has experienced various forms of drought with different duration and severity, with (1965, 1969, 1973, 1983, 1987, 1989, 1997, 1998, 1999, 2003, 2005, 2008, 2009, 2012, 2015), identified as drought-stricken years by (Degefu Citation1987; Quinn et al. Citation1987; Nicholls Citation1993; Webb and von Braun Citation1994; Ayalew Citation1996; Gebrehiwot et al. Citation2011; Tagel et al. Citation2011; Masih et al. Citation2014; Manpreet Citation2018; Bisrat and Berhanu Citation2019). In the past century, 30 historical drought events hit the country, 13 of which were severe and are known to have covered the entire nation (McCann Citation1995; Gebrehiwot et al. Citation2011).
From 1970 onwards, drought hits Ethiopia at least once every ten years. In the past decades, the intensity and frequency of drought have increased significantly across the country, exacerbated by the El Niño phenomenon, almost every 3 to 5 years (Margaret Citation2003; Qu et al. Citation2019). Nevertheless, drought intensity, frequency, severity, and impacts vary spatially across Ethiopia (Web and Braun Citation1990; Mera 2018; Araya et al. Citation2011; Meze- Elisabeth, 2004), with certain regions more prone to drought than others (Nkomo and Kulindwa Citation2006).
Agriculture is the Ethiopian economy's mainstay, contributing about 49% of the Gross Domestic Product (GDP), employing 80% of the population and 80% of the foreign exchange earnings for Ethiopia (CSA Citation2014). However, despite its contribution, agriculture remains one of the country's most vulnerable economic sectors to severe drought events, with a GDP highly sensitive to climate-related catastrophes such as drought, floods, and irregularities in seasonal rainfall amount and distribution (Deressa Citation2007; Jaewon et al. Citation2015). Therefore, any shortage in rainfall or, worse, any drought event that occurs in Ethiopia can negatively impact small-scale farmers that rely on rain-fed farming for subsistence and livelihood. In 2017, the Federal Democratic Republic of Ethiopia (FDRE) estimated the losses in the Gross Domestic Product (GDP) due to climate variability and recurrent drought events to be approximately 1– 4% (FDRE Citation2017).
Nevertheless, even in the most severe drought event, disparities persist in how regions within the country are stricken by drought. Web and Braun (Citation1990) identify Ethiopia's southern, eastern, northern, and northeastern parts as drought-prone and famine-affected areas. A study by Eze et al. (Citation2020a) showed that some villages in Northern Ethiopia reported 100% yield losses in agricultural crop yields against amplified climatic water deficit. The combination of these factors combined with human-induced crises usually leads to wide-ranging famine incidents, migration, and deaths with disastrous consequences on the country's economy (Demissie et al., Citation2022).
Previous studies assessing Ethiopia's climate change impacts have used very small-scale or large-scale Global Climate Models (GCMs). Such GCMs provide minimally helpful information to decision-makers about the precise effects and spatial extent of meteorological drought, climate variability, and change, especially for locations without a meteorological station (Prudhomme et al. Citation2014; Gebrechorkos et al. Citation2019; Citation2020; Haile et al. Citation2020; Hirko et al. Citation2021). The lack of data due to the erratic distribution of weather stations countrywide is one of the problems hindering the efforts to forecast or predict extreme climatic events with accuracy and confidence in many parts of Africa, including Ethiopia
We computed the Standardized Precipitation Index (SPI) and Standardized Precipitation Evapotranspiration Index (SPEI) to quantify the precipitation deficit for multiple time scales using daily rainfall, maximum and minimum temperatures retrieved from the National Meteorological Agency (NMA) of Ethiopia for the period 1983 to 2020. The SPI is the meteorological drought index adopted by the World Meteorological Organization (WMO) for national and regional drought assessments (Rolbiecki et al. Citation2022). This study is delimited to 37 years because computing SPI and SPEI need an active sum of at least 20–30 consecutive years of data to calculate drought (Guttman Citation1994).
However, despite the fact they all depict drought conditions, drought indices differ in estimating drought conditions given the time scale and drought types. Therefore, the World Meteorological Organization (WMO) and Global Water Partnership (GWP) (WMO and GWP 2016) recommend the use of various SPI timescales (namely SPI-3, 6, and 12) for basic, agricultural, and hydrological drought monitoring. Previous studies found SPI-3 as very effective in depicting a dry period (Tsakiris et al. Citation2007; Farhat et al. Citation2013; Tigkas et al. Citation2015). Further, SPI-4 and SPI-6 are more effective in depicting meteorological drought (Adnan et al. Citation2015; Mondol et al. Citation2016), depending on the climate of the geographical locations. Whereas SPI-9 is effective in assessing agricultural droughts (Oki and Kanae Citation2006; Sarwar Citation2008; Kaniewski et al. Citation2012), SPI-12 is effective in depicting hydrological drought (Tigkas et al. Citation2017; Adnan et al. Citation2018) and SPI-24 month for extreme hydrological drought (Adnan et al. Citation2015). This index was developed by McKee et al. (Citation1993) to monitor drought conditions in Colorado, USA, by extracting information on different timescales from precipitation observations.
Furthermore, we chose SPI and SPEI because they are easy but ideal means for assessing drought risks due to their ‘intrinsic probabilistic nature’ (Yildirak and Selcuk-Kestel Citation2015). SPEI was mainly used to cover the deficiency of SPI in explaining the contribution of temperature, evapotranspiration, wind speed, and humidity to drought, given that SPI is solely computed using cumulative precipitation data (Eze et al. Citation2022).
Although concrete national statistical analyses on positive and negative SPI and SPEI dominate the literature, these factors have not yet been analyzed holistically, along with the patterns of positive and negative dominants of SPI and SPEI. Previously the National Meteorological Agency of Ethiopia developed a classification of 8 homogeneous rainfall zones that were upgraded after thorough assessment and validation by (Korecha and Sorteberg Citation2013) to 14 homogeneous rainfall zones. This study used, with a slight modification, the same methodology developed by Korecha and Sorteberg (Citation2013) to subdivide Ethiopia into 14 homogeneous rainfall zones as a basis for our analysis. The spatial and temporal rainfall variability over Ethiopia were addressed by applying Ward’s hierarchical and K-means cluster analysis techniques. The K-means method created twelve rainfall clusters, which were further delineated into fourteen regions or zones. The stations were grouped in the same cluster where those highly associated geographically and with the same seasonal rainfall characteristics. In contrast, each cluster has slightly shifted seasons or amplified its amplitudes. Moreover, the dynamics of PET depicting water surplus and deficits as results of drought are still scarce if not inexistent, to make a rigorous scientific conclusion.
This study is the first to analyze holistically meteorological drought in Ethiopia using four-month and twelve-month time-step (SPI-4, SPI-12, SPEI-4, and SPEI-12). We spatially determine the drought patterns, magnitude, frequency, and spatial extent of the hotspots and coldspots of SPI and SPEI. We used the period 1983 to 2020 because it includes years with minimal rainfall, years with above-average rainfall, and years with medium rainfall. Such a country-wide analysis is essential for managing agricultural systems, water resource planning, and adapting ecological systems to future climate change. This study furthers the works conducted at regional and local levels using hydro-meteorological variables (Edossa et al. Citation2010; Araya et al. Citation2011; Gebrehiwot et al. Citation2011; Bayissa et al. Citation2015). New insights and techniques for identifying drought hot spots have been proposed through this study that will be valuable to policymakers and deciders and could cost-effectively contribute to managing drought events by concentrating efforts on the most vulnerable areas.
2. Material and methods
2.1. Description of the study area
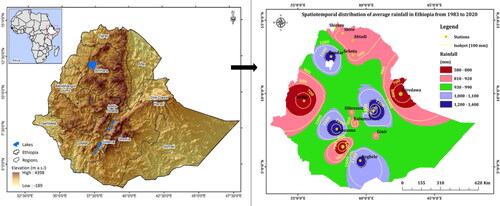
Ethiopia, the area for this study, is in the northeast part of Africa. Sited between 3° 23′ and 14° 51′ North and 32° 59′ and 47° 58′ East, it covers about 1,221,900 km2. Climatic, edaphic factors and land tenure systems have prominent influences on the area's crop production and population distribution. Ethiopia’s elevation ranges from −130 m in the Afar depression to 4550 m at the peak of Mount Ras Dashen (Kaluski et al. Citation2002). Therein exists a diversity of vegetation types (Abebe et al. Citation2013; Gebre et al. Citation2019), six traditional or 33 elaborated agro-ecological zones (EIAR Citation2011), and geological formations (igneous, sedimentary, and metamorphic rock formations) (see ). Climate is related to elevation and topography with spatiotemporal variations.
Figure 1. Map of the study area. SNNP = Southern Nations and Nationalities Peoples’ Region.
2.1.1. Climate of the study area
In Ethiopia, the annual rainfall characteristics are classified into three rainy seasons of four months, each well documented by many authors (Seleshi and Demaree Citation1995; Shanko and Camberlin Citation1998; Camberlin and Philippon Citation2002; Gissila et al. Citation2004; Segele and Lamb Citation2005; Korecha and Barnston Citation2007; Diro et al. Citation2011; Korecha and Sorteberg Citation2013). These distinct seasons are the dry season from October to January (ONDJ, Bega), the small rainy season, starting from February to May (FMAM, Belg), and the main rainy season from June to September seasons (JJAS, Kiremt). The annual rainfall ranges from less than 582 mm in the east of the Afar and Somali region to 2200 mm yearly around Limu, in the Oromia region. The short raining season, also called “Belg”, is generally highly variable in quantity and distribution. Southwestern Ethiopia and some areas in the central highlands receive between 500-700 mm of rainfall during the belg season, while some places in the eastern and northeastern parts of the country receive short rains as early as February to May due to the penetration of rain-bearing winds into Ethiopia during this period (Camberlin et al. Citation2001). Ethiopian total rainfall varies across seasonal and spatially divisions (Gissila et al. Citation2004).
The ENSO indicator [(Southern Oscillation Index (SOI), Nino3.4, Pacific Sea surface temperature (SSTs) and Multivariate ENSO Index (MEI)] and the Sub-Tropical Jet (STJ), Red Sea Convergence Zone (RSCZ), Inter-Tropical Convergence Zone (ITCZ), Tropical Easterly Jet (TEJ), and Somalia Jet are the crucial rain-causing weather systems for Ethiopia (NMA, 1996). Previous studies have demonstrated that El Nino-Southern Oscillation (ENSO) has more influence on the amount of rainfall and distribution (Kiem and Verdon-Kidd Citation2009; Davey et al. Citation2014; Gleixner et al. Citation2017; Worku and Sahile Citation2018), and the variance in annual streamflow (Curry and Zwiers Citation2018). Babu (Citation1999) found a negative relationship between the pacific SST, belg season, and the SOI. It was observed that during the ENSO years (e.g., 1982/83, 1987/88, 1992/93, 1998/99, and 2000/2001), the belg rains were above-normal, while below-normal rainfall was observed in the belg-producing regions of Ethiopia during La Niña years. The vegetation is dominated by natural gum- and resin-producing tree species such as Boswellia, Commiphora, and Acacia (Gebrehiwot et al. Citation2003).
2.2. Data acquisition
The Climate Hazards Group InfraRed Precipitation with Station data (CHIRPS) products were used to analyze drought patterns and severity in Ethiopia's 14 homogenous rainfall zones using CHIRPS satellite rainfall data. The CHIRPS was developed by the Climate Hazards Group (CHG) at the University of California (Knapp et al. Citation2011; Funk et al. Citation2015). The analysis was done at both station level and homogenous rainfall zones. The number of stations is relatively low (16) compared to homogeneous coverage. The lack of ground-based observed data for many weather stations justified this low number, which also explained the choice of the analysis at a regional level. Many other scholars adopted the same approach to estimate drought severity (Sujitha and Shanmugasundaram Citation2017; Duan and Bastiaanssen Citation2013; Ezzine et al. Citation2014; Mohammed et al. Citation2018). Similarly, Yared (Citation2015) assessed the spatial and temporal variation of meteorological droughts in the Upper Blue Nile (UBN) basin in Ethiopia using long historical records (1953-2009) for 14 meteorological stations and relatively short records (1975-2009) for 23 others stations. shows the list of 16 weather stations of Ethiopia's National Meteorological Agency (NMA).
Table 1. List of selected 16 meteorological stations in Ethiopia.
2.3. Classification techniques
Our study used the14 homogeneous rainfall zones classified by Korecha and Sorteberg (Citation2013) ().
Figure 2. Flow chart showing the methodology applied in this study (adapted and modified from (Korecha and Sorteberg Citation2013).
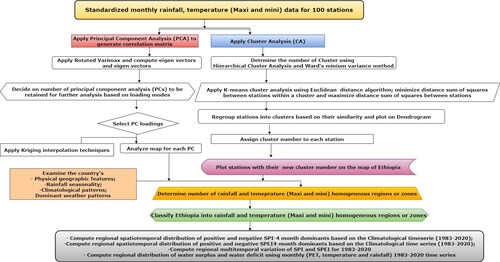
Generally, the presence of numbers of rainfall clusters suggests that rainfall patterns over Ethiopia vary within a short distance, while modulated by topographic variation and orientation, large-scale atmospheric circulation systems, moisture track, and local dynamical conditions. This approach was proposed by Korecha and Sorteberg (2013). The fourteen homogeneous rainfall regions were delineated by consolidating multivariate rainfall statistics using data from the 100 stations, topography, climate, and seasonal synoptic systems classifications made using the 600 random points demarcated some of the masked rainfall heterogeneity over the southeastern lowlands and the adjoining rangelands as suggested by Korecha and Sorteberg (2013). The Principal Component Analysis was used to reduce the number of variables and to extract three large rainfall regimes over Ethiopia, namely, the northeastern, southern, and western regions, and the Cluster analysis was used to further classify the Ethiopian rainfall features into fourteen clusters. PCA method allowed reduction of the number of variables. A study done by Baeriswyl and Rebetez (Citation1997), in Switzerland, adopted this method to divide the study area into 6 principal components based on their rainfall regime. Combining the PCA and CA analysis suggest it is possible to identify distinct regions that have mono-modal or bimodal type rainy season(s). When common climatological patterns and physical geographical features are superimposed on clusters, twelve distinct homogeneous rainfall regions emerge.
Zone (I) corresponds to the Northeastern Rift Valley, a semi-arid region, the driest in Ethiopia (less than 250 mm/year). It receives the major and small rains during the Kiremt and Belg seasons with rainfall maxima occurring in July/August and in March/April. Zone II corresponds to the Northeastern Escarpments, which has the long and short rainy seasons (Kiremt and Belg) seasons, respectively, but is different from Region I in both rainfall amount and the length of rainy seasons. Zone (III) corresponds to the Northwestern highlands and extends from northern mountain chains to the northern tip of the country. It mainly receives rain during the Kiremt season. It differs from Zone II as it is a mono-modal type of seasonal cycle. Zone IV corresponds to the eastern and southern sectors of southwestern Ethiopia. The region corresponds to the wettest corridor of the country with the mean annual rainfall amounts of stations in the region varying between 750 mm and 2400 mm (Gissila et al. Citation2004).
Zone (V) corresponds to the southern outlet of Rift Valley and the southwest marginal lowlands. It is a bimodal rainy season, ranging from 300-800 mm. Zone (VI) corresponds to the central Rift Valley, which receives an annual rainfall of between 1000-1750 mm. Zone (VII) corresponds to the central Ethiopian highland and encompasses the areas extending from the central Rift Valley to the Blue Nile valleys. Zone (VIII) corresponds to the eastern Rift Valley escarpment and eastern highlands. Intra-annual and seasonal rainfall variability are comparatively high compared to Region VII. Rainfall over this region is mainly associated with easterly waves (easterly perturbations) originating in the Arabian Sea and northern Somalia as well as the intensity of southwest monsoon flow. The Zone (IX) and Zone (X) correspond to the central and eastern parts of Ethiopia. Zone (XI) falls also in the eastern part of Ethiopia. The Zone (XII) and Zone (XIII) and Zone (XIV) correspond respectively to the central, the southeastern rangelands, lying between southeastern lowlands and eastern highlands and the southwestern part of Ethiopia. These regions are characterized by a bimodal type of rainy season, Belg and Bega seasons with Belg and Bega accounting respectively for 60% and 30% of the annual rainfall amounts.
2.4. Data processing and quality control
The data quality control was undertaken for a total number of 16 ground-based meteorological stations and 100 merged station-satellite rainfall data, spatially distributed with 600 random grid locations. This number only includes stations with less than 20% of missing values. The missing values were filled using high-quality bias error-corrected satellite rainfall estimation data known as CHIRPS (Shen et al. 2020) and the temperature data gaps were filled by using ENACTS (Enhancing National Climate Services) data. A systematic error minimization technique using climatological daily mean bias error was also applied (Dinku et al. Citation2018). ENACT was used in this study to obtain and fill in missing temperature data. ENACT provides high-resolution (4 km) temperature data which is of better quality (Dinku et al. Citation2018).
Dinku et al. (Citation2018) for example, presented the findings of a validation of the CHIRPS satellite rainfall estimates over eastern Africa, the geographic location of Ethiopia. Rain-gauge data from over 1,200 locations were compared to daily, decadal (10 days), and monthly evaluations of several satellite products. At decadal and monthly time scales, an and-comparison of the satellite products CHIRPS, African Rainfall Climatology version 2 (ARC2), a Tropical Applications of Meteorology using Satellite data (TAMSAT) revealed that both CHIRP and CHIRPS are significantly better than ARC2 with higher skill and low or no bias, and better than the latest version of the TAMSAT product.
Furthermore, Gebrechorkos et al. (2018) support Dinku et al. (Citation2018) findings by recommending that inter (rainfall) data with better spatial resolution be used for hydrological and climate studies. Finally, recent re’s have used CHIRPS data to examine drought, drought risk management, and crop yield estimation in the area using CHIRPS data for our present study (Eze et al. Citation2020b; Citation2022). The preceding researchers’ recommendations and successes are considered sufficient to warrant our preference for the CHIRPS data for our study and the aforementioned methodology and techniques used.
Multiple studies have done this comparison and concluded that CHIRPS data and ground-based rainfall data are in good agreement on daily and monthly scales. In comparison to the Climate Forecasting System Reanalysis (CSFR) products. For instance ascertained that CHIRPS data are in good agreement with ground-based rainfall at daily and monthly scales, with high rainfall detection ability in comparison with the Climate Forecasting System Reanalysis (CSFR) product and concluded that CHIRPS can be used as alternate open access rainfall input to the hydrological model. Akinyemi et al. (Citation2020) compared satellite rainfall datasets from the Tropical Rainfall Measuring Mission (TRMM), Climate Hazards Group Infrared Precipitation with Stations (CHIRPS), and an African Rainfall Estimation (RFE 2.0) with ground meteorological data from the Nigeria Meteorological Agency (NIMET) Lagos office in Oshodi for the selected stations in Southwest of Nigeria, for the period 1998-2016. The correlation results showed appears remarkably high relationships between the satellite datasets and ground observation (NIMET) with R2≥ 0.70 in all stations. A strong relationship was also found between TRMM and NIMET in Abeokuta, Akure, and Osogbo with R2 = 0.99, 0.98, and 0.98, respectively. CHIRPS displayed a high correlation with NIMET in these three stations with R2≥ 0.90, but the RFE-NIMET relationship appears much more in Osogbo with R2 > 0.90. The study also found that TRMM and CHIRPS have a strong relationship in almost all locations with R2≥ 0.87.
According to Paredes-Trejo (Citation2020), CHIRPS performs better in inland regions (R, PBIAS, and ubRMSE median: 0.51, 3.71 percent, and 9.20 mm/day; POD, FAR, and TS median: 0.59, 0.44, and 0.40, respectively) than along the coast (R, PBIAS, and ubRMSE median: 0.36, 5.66 percent, and 12.43 mm/day; (R, PBIAS, and ubRMSE median: 0.36, −5.66 percent, and 12.43 mm/day; POD, FAR, and TS median: 0.32, 0.42, and 0.26, respectively). The author also discovered that CHIRPS performs better in the wettest months (DJF) than the driest months (JJA), and is sensitive to both warm-top stratiform cloud systems and sub-cloud evaporation processes. Paredes-Trejo uses only stations with less than 10% of missing values and used the main monthly rainfall for the period 2000-2020 to fill up the gaps.
2.5. Data analyses techniques
2.5.1. Computation of standardized precipitation index (SPI)
2.6. Data analyses techniques
2.6.1. Computation of standardized precipitation index (SPI)
Computation of drought indices such as SPI and SPEI needs at least 20–30 consecutive years of data to calculate drought (Guttman Citation1994). Gamma distribution functions are most often found to fit the precipitation data well because the distribution of rainfall totals is not normally distributed (US National Drought Mitigation Center Citation2010). Gamma distribution is defined by its frequency or probability density function:
(1)
(1)
in which
and
are the shape and scale parameters respectively, x is the precipitation amount and
is the gamma function. Parameters
and
of the gamma pdf are estimated for each station and for each time scale of interest (4 and 12 months). Maximum likelihood estimations of
and
are:
(2)
(2)
and n is the number of observations. The resulting parameters are then used to find the cumulative probability of an observed precipitation event for the month and time scale for the location in question. Since the gamma function is undefined for x = 0 and a precipitation distribution may contain zeros, the cumulative probability becomes:
(3)
(3)
In which q is the probability of zero precipitation and G(x) is the cumulative probability of the incomplete gamma function. If m is the number of zeros in a precipitation time series, then q can be estimated by m/n. The cumulative probability H(x) is then transformed to the standard normal random variable z with a mean zero and variance of one (Abramowitz and Stegun Citation1965), which is the value of the SPI.
(4)
(4)
In the above-mentioned equation, X is seasonal precipitation at the rain gauge and
observation,
is the long-term seasonal mean and
is the standard deviation. Generally, monthly precipitation is not distributed so a transformation is the number of standard deviations that the observed value would deviate from the long-term, for a normally distributed random variable (Tigkas et al. Citation2015). One interpretation of the resultant values is presented in .
Table 2. Classification criteria for drought indices.
2.6.2. Computation of standardized precipitation evapotranspiration index (SPEI)
The first step in SPEI computation is to estimate the potential evapotranspiration (PET), which represents a simple climatic water balance using the Thornthwaite (Citation1948) method using EquationEquation 5(5)
(5) . Monthly PET is estimated by the Thornthwaite equation (EquationEquation 1
(1)
(1) ) as follows
(5)
(5)
Where: T is the monthly-mean temperature (○C); I is a heat index, which is calculated as the sum of 12 monthly index values I, the latter being derived from monthly temperature using Equationequation 6(6)
(6) :
(6)
(6)
m is a coefficient depending on I: m = 6.75 × 10⁻⁷ I3 −7.71 × 10⁻⁵ I2 +1.79 × 10⁻²I + 0.492; and K is a correction coefficient computed as a function of the latitude and month (Equationequation 7
(7)
(7) ).
(7)
(7)
Here NDM is the number of days of the month and N is the maximum number of sun hours, which is calculated using (EquationEquation 8(8)
(8) )
(8)
(8)
Where is the hourly angle of the sun rising, which is calculated using
where
is latitude in radians and
is the solar declination in radians, calculated using (EquationEquation 9
(9)
(9) )
(9)
(9)
where J is the average Julian day of the month. The next step with the values obtained ETP, then to get the difference between precipitation (P) and the potential evapotranspiration (ETP) month i is calculated using the equation climatic water balance. It is a simple measure of the water surplus or deficit for one month. The ratio of P to PET is a suitable parameter for obtaining a drought index that accounts for global warning processes
(10)
(10)
This approach has some disadvantages: the parameter is not defined when PET 5.0 (which is common in many regions of the world during winter), and the P/PET quotient reduces dramatically the range of the variability and the role of temperature in droughts.
Creation of cumulative series at desired time scale, fitting the data to an adequate distribution function (Log Logistic) and transforming the data into (standardized) z-values.
Calculated Di at different time scales, following the same as with the SPI procedure. The difference in the specific month j and year, it depends on the selected time scale k. For example, the accumulated difference for one month each year with a 12-month time scale is calculated using (EquationEquation 11
(11)
(11) )
(11)
(11)
If j < k and where is the P-PET difference in the first month of the year I, in millimeters.
2.6.3. Duration, severity, and intensity of drought for SPI and SPEI
A drought event based on the SPI and SPEI is defined as a period in which the values of the indices are continuously negative and ≤ −1 (Nedealcov et al. Citation2015; Lee et al. Citation2017; Mesbahzadeh et al. Citation2020). According to the run theory developed by (Yevjevich Citation1967), drought severity is equal to the sum of the SPI/SPEI values below the threshold level (SPI= 0 or SPEI = 0) the length of time during which the SPI/SPEI value continuously below the threshold level is drought duration; and the frequency of drought is the number of events when the SPI/SPEI is below the threshold (SPI =0 or SPEI = 0). The features of each drought event such as severity (S), peak (P), and duration (D) are extracted based on the procedure shown in . In is the period (number of months) of uninterrupted negative SPI, P is the maximum drought intensity of a specific drought event, and S is the aggregation of drought intensity (SPI values) of a drought event (Yevjevich Citation1967; Sharafati et al. Citation2019). Calculations of P and S are as follows:
(12)
(12)
(13)
(13)
Figure 3. SPI and SPEI drought features extraction using runs theory for different drought events proposed by Yevjevich (Citation1967) and adopted by (Sharafati et al. Citation2019).
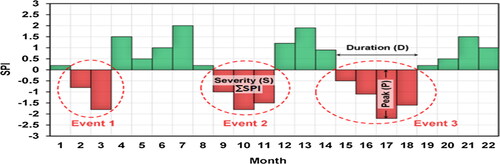
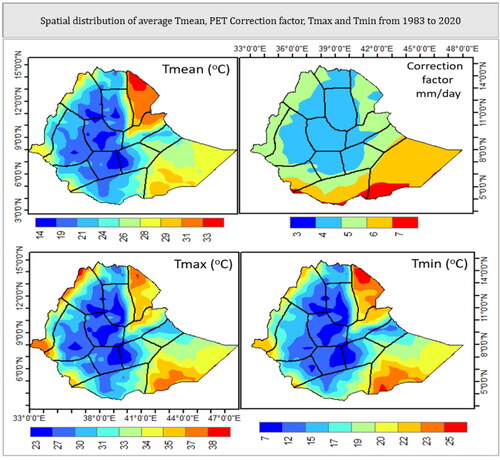
Figure 4. Spatial distribution of Tmean, PET corrector factor, Tmax, and Tmin from 1983 to 2020.
Likewise the same was applied to SPEI
(14)
(14)
(15)
(15)
In this research, the meteorological drought indicator used are SPI and SPEI (Vicente-Serrano et al. Citation2010), and is calculated for 4- and 12-time scales.
The negative and positive values of SPEI are considered as the drought and the non-drought event. As drought is defined when the values of SPEI fall below zero, a drought event is considered a period with negative SPEI values. To measure the length of drought duration and the magnitude of drought severity, a threshold value must be defined. The drought duration (D) is the period length in which the SPEI is continuous negative, starting from the SPEI values are equal to −1 and ends when the SPEI values turn out to be positive. The drought severity (S) is the cumulated SPEI values within the drought duration, which is defined by Vicente-Serrano et al. (Citation2010) in :
Inverse-Distance weighting interpolation (Equationequation 16(16)
(16) ) and Thiessen polygons techniques (EquationEquation 17
(17)
(17) ) were used to display the area averages from point measurements and the spatial distribution of precipitation ArcGIS v.10.8 software using the mathematical expressions.
(16)
(16)
(17)
(17)
Where d is the distance between two rainfall stations, A is the area covered by the rainfall, and n is the number of stations. a is the area of each polygon, is used to calculate the weight associated with each gauge.
2.7. Evapotranspiration, water deficit, and water surplus
2.7.1. Evapotranspiration
Evapotranspiration (ET) is the leakage of water into the atmosphere by combined processes of soil and plant surface evaporation and plant transpiration (Droogers and Allen Citation2002). Potential evapotranspiration (PET) is the estimated amount of water that would be extracted by evapotranspiration and can be measured using the Kharrufa method, depending on the climate data obtainable for the region being studied. Kharrufa (Citation1985) resulting a simple equation to calculate PET values dependent on the relation between temperature and sunshine duration, the equation is:
(18)
(18)
Where: t is the Mean monthly temperature
is the percentage of the sum of sunshine hours in each month to the sunshine hours of one year; m is constant (1.31); a is constant (0.33).
2.7.2. Water deficit (WD) and water surplus (WS)
Considering the months of the year, there is a water surplus when the precipitation value exceeds the value of corrected evapotranspiration (WS = P > PET). Whereas water deficit occurred when the values of corrected evapotranspiration exceed the precipitation value through the same year’s residual months (WD = P < PET). (WS stands for Water deficit and WS stands for Water Surplus).
2.8. Trend tests
Trend analysis along with non-parametric tests was performed using XLSTAT to determine if the series of observations of SPI and SPEI are increasing or decreasing with time. Sen’s slope estimator method was then used to characterize the seasonality of the precipitation data (Sen Citation1968).
3. Results
3.1. Spatiotemporal distribution of temporal distribution of precipitation, temperature, and potential evapotranspiration (PET) for Kiremt season (Jun-Sep) in Ethiopia
The analysis of Kiremt season (Jun-Sep) annual temperature (Maxi and Mini) and Tmean shows that the highest temperature is recorded in the Northeastern and Southeastern parts of the country, while the northwestern and central parts of the country were the coolest during the study period. The temperature ranges between 7 and 38
().
Figure 5. Spatial distribution of precipitation and Potential evapotranspiration from 1983 to 2020.
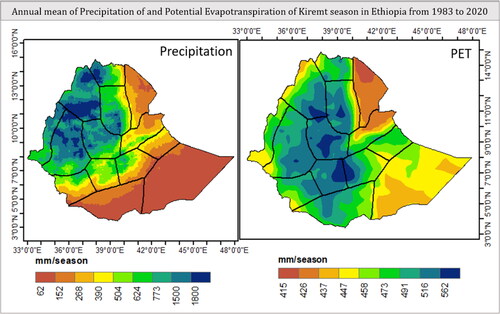
Like the temperature distribution, the analysis of average rainfall amount recorded between 1983 to 2020, the wettest part of the country is in the west and central Ethiopia. The driest parts are found in the Northeastern and Southeastern parts of the country ().
3.2. Spatiotemporal analysis of drought in Ethiopia using SPI
The trend analysis for both SPI and SPEI showed consistent results, with positive slopes for both SPI-4 and SPEI-4 from 1983 to 2020 in all the 14 homogeneous rainfall zones () showing a persistent tendency toward wetter conditions in general despite some intermittent drought periods. However, from a time-series perspective, the variations of SPI and SPEI were quite similar with a slight difference in the drought intensity and severity.
Figure 6. Variation of 14 zonal averages of SPI and SPEI at 4-month timescale SPI values in 14 homogeneous rainfall zones in Ethiopia from 1983 to 2020.
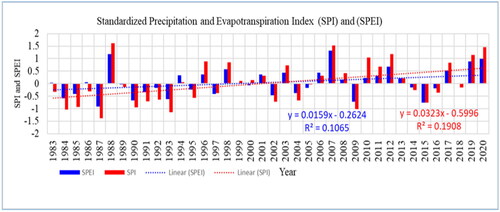
The analysis of the average SPI and SPEI from 1983 to 2020 of the 14 homogenous rainfall zones showed a weak positive trend (). An index value below −1 depicts the beginning of moderately dry conditions, which is the threshold used to estimate drought occurrence trends. A repetition of consecutive SPEI and SPI values below −1 for consecutive months or years, stands for an increased monthly or annual severity of droughts. An increase or repetition of years and months with negative values of SPI increases with area deficit, while a positive value reduces the deficit (Wu et al. Citation2001).
3.3. SPI-based drought identification and spatiotemporal pattern
The spatial distribution zonal negative and positive dominants of the SPI in the 14 homogeneous rainfall zones despite the observed positive trend in the time series analysis of both SPI-4 and SPEI-12 months were quite different. This difference can be explained by the topography, relief, climatic conditions, and vegetation cover (Vicente-Serrano et al. Citation2015; Labudová et al. Citation2017; Tirivarombo et al. Citation2018; Mehr and Vaheddoost Citation2020). The temporal and spatial characteristics of droughts in the Ethiopia region were assessed by analyzing the SPI values of each of the 14 Homogeneous rainfall Zones and at 16 meteorological stations in Ethiopia from 1983 to 2020 (). The computed 4-month SPI values of each homogeneous rainfall zones for the study period 1983-2020 were analyzed and mapped using R statistical software.
Figure 7. Spatiotemporal variation of zonal positive and negative dominants of 4-month timescale SPI values in 14 homogeneous rainfall zones in Ethiopia from 1983 to 2020.
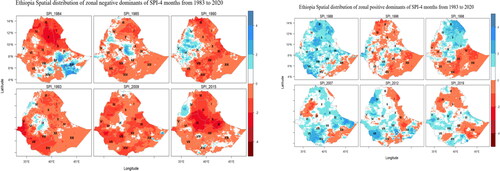
The analysis shows that zone to severe droughts, based on the zonal negative dominance of SPI, occurred in the northern part of the country in 1984, in the northern, eastern, and southern parts of the country in 1985, northern, the central, and southern part of Ethiopia in 1990, and the entire country except northwestern part of the country in 1993. The drought pattern in Ethiopia based on the zonal negative dominance of a standardized precipitation index equally shows not much difference in pattern between 1993 and 2009. The 2015 drought in Ethiopia was highly concentrated and severe in the central and the northern part of the country.
The analysis of zonal positive dominance of an SPI shows moderate to extreme drought events occurring in the southeastern and southern parts of the country in 1988. Moderate to extreme drought events were observed across the country in 1996. In the year 1998, only the northeastern and large portion of the northern part was exempted and wet. A sparsely distributed drought event occurred in the country in the year 2007, mainly in the western, eastern, and southeastern parts of Ethiopia.
3.4. SPEI-based drought identification and spatiotemporal pattern
The analysis of zonal negative dominance of SPEI, a moderate to extreme drought concentrated in the Northern part of Ethiopia in the year 1984, highly concentrated in the western part (Gambela region) of Ethiopia in 1993, while the 2015-drought event was highly localized in the central and eastern part of the country ().
Figure 8. Spatiotemporal variations of zonal positive and negative dominants of 4-month timescale SPEI values in 14 homogeneous rainfall zones in Ethiopia from 1983 to 2020.
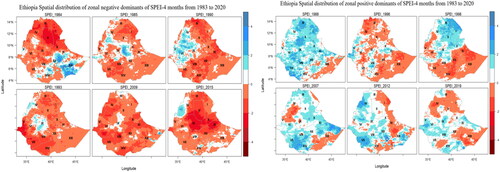
The analysis of zonal positive dominance of SPEI shows a moderate to extreme drought occurred in the years 1984, 1993, 2009, and 2015 and affected the entire country ().
3.5. Drought duration, severity, and intensity
The longest drought occurred about 12 months in 2015 with the highest incidences in Dila, Shire, Sekota, and Gelemso districts and surroundings with duration ranging between 4 to 12 months and drought severity evaluated as extreme (see and ), and (). During the period 1983-2020, the analysis of drought duration, severity, and intensity showed 30-63 drought events for SPEI-4 months and 41-68 drought events for SPI-4 months with a length of 4 months and above, occurring in the years 1984/85, 1986/87, 1992, 1997/98, 1999, 2008/09, 2015/16 (). The drought duration and severity based on SPI-4 months and SPI-12 months are found in in the Appendices.
Figure 9. (a) Drought severity (b) Drought duration (c) Proportion of land under annual drought conditions (d) Drought frequency maps from 1983 to 2020 using SPEI-4 month and SPEI-12 month.
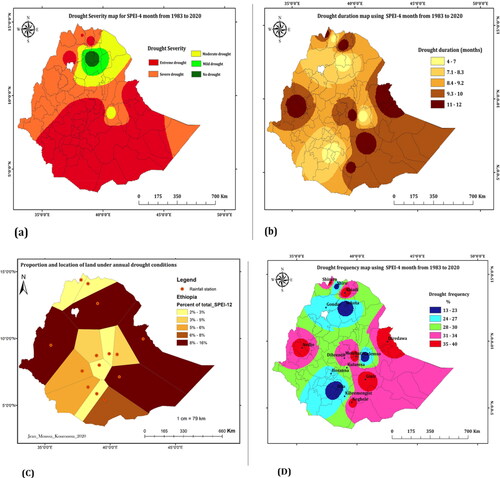
Table 3. Meteorological drought based on SPEI-4 months for (1983–2020).
Table 4. Meteorological drought based on SPEI-12 months for (1983–2020).
Table 5. Numbers of drought events for 1983–2020 in 16 meteorological stations in Ethiopia.
The analysis showed a highly localized pattern of drought events during the past decades (1983-2020). The station-based spatial distribution of drought episodes at Abiadi, Ginir, Shiraro, Neghele, Nedjo, and Diredawa with a frequency of occurrence ranging between 36 to 40% (). The drought events of the year 2015 hit the entire country except for a small portion of the southwestern and northeastern parts of the country. The timely information obtained through various drought indices about the start and areal extent of droughts is beneficial for making appropriate contingency plans (Morid et al. Citation2006). Some studies on drought assessment focus on a single index (Du et al, Gocic and Trajkovic Citation2014; Adnan et al. Citation2018).
3.6. Patterns of drought incidence
The patterns of drought magnitude and severity from 1983 to 2020 derived from 4-months steps SPEI (June-September) range from moderately wet to extremely dry.
shows that the drought of the year 1984/85 was very severe in the northern, eastern, and central regions of Oromia. The drought of 1997 hit major parts of the country specifically the northern, central, and western parts of Ethiopia. The drought of 1998, only hit some of the southeastern and southern parts of the country. The northern and northeastern parts of Ethiopia, which are depicted to be driest, contrarily, experienced no drought. However, the year 2007 was one of the wettest years in the history of Ethiopia with no drought event experienced across the country. In the year 2008, the northern, and eastern parts of Ethiopia, experienced moderate to severe while the western part was sparsely wet with localized droughts in some districts of the western region. The year 2015/16, has been categorized as the most severe drought year in Ethiopia’s history.
3.7. SPEI-based drought identification and spatiotemporal pattern
The analysis of SPEI-4 showed that severe to extreme drought episodes occurred in the temporal evolution of the SPEI-4 month during 1983/84, 1997/98, 1999/20, 2008/09, and 2015/16 rainy season. The 1984 drought affected the whole of Ethiopia, but mainly the northeastern, northwestern, Eastern, and Southeastern parts of the country. However, even though the overall analysis of the temporal drought pattern (1983-2020), showed that the central and southwestern part of the country is less affected by eastern drought events, these locations are far to be exempted from drought. The 1997 drought event affected mainly the southwestern part (Gambella region), the northern part (Amhara region), and to some extent the central part of the country (Oromia region). In the years 1999 and 2008, discrete pockets of severe droughts affected some pockets areas across the country. shows a drought with an extreme severity located in the eastern, southeastern, and central parts of Ethiopia with a severity ranging from (-12 to − 19). The spatial distribution of the drought from 1983 to 2020 has shown an occurrence of drought with tremendous impacts on livelihood zones. The identified years of drought 1983/84, 1997/98, 2008/09 were also among the ones (1965, 1969, 1973, 1983, 1987, 1989, 1997, 1998, 1999, 2003, 2005, 2008, 2009, and 2012) identified by Masih et al. (Citation2014), as the most severe drought years with large coverage, affecting millions of peoples across Ethiopia. The risk of drought occurrence was high at the stations of Diredawa, Nedjo, Ginir, Metehara, Abiadi, and Kibremengist about 36 to 40% ().
3.7.1. SPI and SPEI trend analysis
The trend analysis was applied to SPI-4 and SPEI-4 to all the 16 stations and 14 homogeneous rainfall zones. The R2 values vary from 0.039 to 0.21 for SPI and 0.02 to 0.18 for SPEI. The R2 for the average SPI and SPEI for all 14 homogeneous rainfall zones is (R2 = 0.11) for SPEI and (R2 = 0.19) for SPI in . The Z statistics obtained from MK and SR tests showed a positive trend at a 95% confidence level.
Table 6. Summary statistics and Z values from MK and SR tests.
3.7.2. Consistency of the SPI and SPEI
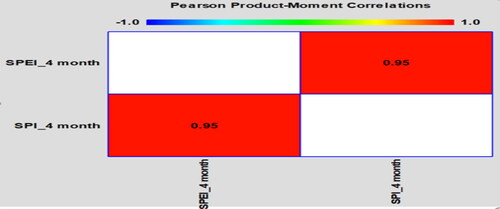
To analyze the consistency of the SPI and SPEI, typical meteorological stations in different climatic regions were selected, and we analyzed the correlation between the SPI and SPEI monthly at a 4-month timescale (). SPEI and SPI values are consistently positively and strongly correlated throughout the study period (1983-2020).
Figure 10. Comparison of 4-month timescale SPEI and SPI average values in 14 homogeneous rainfall zones in Ethiopia from 1983 to 2020.
3.7.3. Comparison between SPI-4 month and SPEI-4 month
This comparison allows us to understand the addition of the PET to SPI to obtain SPEI produces significantly different index values. The abnormality observed can be explained by the difference in the climatic, topographic, and vegetation conditions between homogeneous rainfall Zones of Ethiopia. The time-series analysis found very little difference between SPI and SPEI. However, the drought onset, magnitude, and severity were higher for SPI for the homogeneous rainfall zones where the water deficit was more pronounced and the temperature higher. This is consistent with the results of some studies that show an increase in future drought severity caused by a temperature increase (Beniston et al. Citation2007; Sheffield and Wood Citation2008). There were also some differences between the SPI and SPEI in regional drought monitoring, which can be found in most studies (Vicente-Serrano et al. Citation2015; Labudová et al. Citation2017; Tirivarombo et al. Citation2018; Mehr and Vaheddoost Citation2020). The SPEI can account for the possible effects of temperature variability and temperature extremes beyond the context of global warming. Therefore, given the minor additional data requirements of the SPEI relative to the SPI, vegetation is preferable for the identification, analysis, and monitoring of droughts in any climate region of the world. In summary, the SPEI fulfills the requirements of a drought index, as indicated by Nkemdirim and Weber (Citation1999), since its multiscalar character multi-scalar is to be used by different scientific disciplines to detect, monitor, and analyze droughts.
3.8. Water surplus and deficit analysis
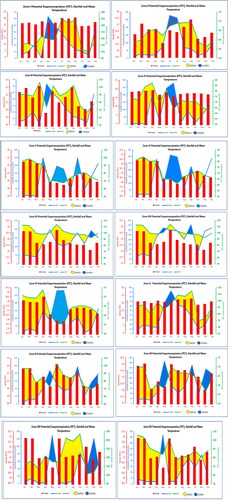
Rainfall deficit and surplus analysis were done on the monthly time scale for the 14 homogeneous rainfall zones between 1983 and to people as shown in . Our study revealed that the wettest homogeneous rainfall zones during the study period were Zone V with a surplus of rainfall of 100 mm each observed during Belg (FMAM) season and Kiremt (JJAS), Zone VIII (108 mm during belg season and 115 mm during Kiremt)), Zone XI (108 mm during Belg) season and 92 mm during Kiremt)), Zone XII (75 mm during Belg season and 72 mm during Kiremt), Zone XIII (320 mm during Bega season (ONDJ), and 350 mm during Belg season). The driest homogeneous rainfall zones identified were Zone I with a surplus of rainfall (-210 mm observed during 2 months for respectively Bega and Kiremt) season, and a water deficit of −340 mm observed during 3 months of Kiremt season). The others driest months were Zone III ((Bega (-90 mm, 3 months); Belg (-105.3 mm, 3 months); Kiremt (-100 mm, 4 months)), Zone VII ((Bega (-110 mm, 2 months); Belg (-112 mm, 3 months); Kiremt (-114 mm, 3 months)); Zone XIII (Bega (-170 mm, 1 month); Belg (-220 mm, 3 months); Kiremt (-350 mm, 4 months)). These zones (I, III, VII, XIII) experienced the highest rainfall deficit and highest evapotranspiration, thus, were likely to experience severe drought conditions (see in the Appendix).
Figure 11. Water Surplus and Deficit derived from Potential Evapotranspiration (PET), Rainfall, and Mean Temperature in 14 homogeneous rainfall zones from 1983-to 2020.
All abbreviations and acronyms are defined in in the Appendix.
3.9. Limitations of the study
This study only used two (2) timescales (4 and 12 months) and used a limited number of weather (16) stations as it has been widely. Although the data were complemented by The Climate Hazards Group InfraRed Precipitation with Station data (CHIRPS). Moreover, the drought duration, intensity, and severity were estimated only by using SPI 4-month, SPI 12-month, SPEI 4-month, and SPEI 12- months, which were used for trend analysis, and the Spatio-temporal distribution of positive and negative SPI and SPEI dominants. The potential evapotranspiration was estimated to determine water surplus and water deficit for the study period (1983 to 2020).
4. Discussion
This research characterized historical drought patterns, magnitude, and spatiotemporal distribution (with a focus on 14 homogeneous rainfall zones and 16 meteorological stations. The observed recent trends in the intensity and frequency of extreme climate events such as drought with negative implications on the society (Neely et al. Citation2009; Giddens Citation2009) and the fact that global warming will increase the risk of famine in drought-prone areas (IPCC, 2014), highly dependent on rainfall and water resource motivated this research.
The results from this study indicate important inter-annual rainfall fluctuation and a significant increasing trend in most of the selected meteorological stations. The estimated drought indices indicated that 85% of the selected areas experienced in the past a long dry period with a severity ranging from mild to extreme. However, most of the drought years were followed by a long-wet period as a relief and most of the drought events are highly localized and differ in magnitude, frequency, and severity. The analysis showed that only southwestern, the northern, and some parts of the central region of Ethiopia are less affected by drought. These areas have a rainfall deficit ranging from 1 to 7%.
During the period 1983-2020, the results of SPEI-4 at 16 stations of Ethiopia, 30 to 63 drought events which have a length of more than 2 months that occurred in 1984, 1985, 1986, 1987, 1992, 1997, 1998, 1999, 2008, 2009, 2015 and 2016. This finding resonates with previous studies that identified the years (1982/83, 1983/84, 1984/85, 1986/87, 1987/88, 1990/91, 1991/92, 1993/94, 1997/98, 1999/2000;2008/2009, 2015/2016) as drought-stricken years (Degefu Citation1987; Quinn et al. Citation1987; Nicholls Citation1993; Webb and von Braun Citation1994; Ayalew Citation1996; Gebrehiwot et al. Citation2011; Tagel et al. Citation2011; Manpreet Citation2018; Bisrat and Berhanu Citation2019) as the worse drought-stricken years of the past recent decades in the history of Ethiopia. The years 1983/84 and 2015/16 have been reported by many studies to have caused the loss of lives of millions of people, crops, and livestock destruction, forced displacement, and destitution (El Kenawy et al. Citation2016; Khadr Citation2016; Degefu and Bewket Citation2017). In the province of Punjab Hina and Saleem (Citation2019) found the years (1984, 1993, 2000) of moderate droughts and the years (1986, 1988, and 2000) of moderate to severe drought years. The increase in frequency and magnitude of drought and its associated impacts has given impetus to drought studies using historic time series data of hydro-meteorological variables at regional, national, and local levels. Drought management is thus, an important issue in drought-prone countries such as Ethiopia. For several decades now, the country has striven to develop effective and efficient solutions to reduce the adverse effects of drought as well as select relevant prevention and mitigation measures. This study also identified 2015 as the longest drought for about 12 months 2015 with the highest incidences in the agricultural sector. Eze et al. (Citation2020) and Eze et al. (Citation2022) confirmed that some smallholders in the northern part of Ethiopia lost up to 100% of their crops due to the 2015 drought. The results indicated that occurrences of drought in the 16 meteorological stations as well as within the 14 rainfall homogenous zones of Ethiopia are much localized and usually coincided with the occurrence of the ENSO phenomena such as [(Southern Oscillation Index (SOI), Nino3.4, Pacific sea surface temperature (SSTs) and Multivariate ENSO Index (MEI)] as well as the Sub-Tropical Jet (STJ), the Red Sea Convergence Zone (RSCZ), Inter-Tropical Convergence Zone (ITCZ), the Tropical Easterly Jet (TEJ), and the Somalia Jet. Similar observations have been by (Kiem and Verdon-Kidd Citation2009; Davey et al. Citation2014; Gleixner et al. Citation2017; Worku and Sahile Citation2018), occurring in the two to three years intervals (Ferris-Morris Citation2003; Mwangi Citation2016). The influence of ENSO indicators on the drought occurrence and severity in Ethiopia has been established by many scholars (Glantz et al. Citation1991; Cane Citation1993; Degefu et al. Citation2017). This influence is also called atmospheric teleconnection or the “linkage over a great distance of seemingly disconnected weather anomalies” and the monitoring of this phenomena could help to predict drought with a longer lead time and take prevention measures.
A study by Diro et al. (Citation2011) subdivided Ethiopia into six climatically homogeneous rainfall zones and analyzed separately for the influence of SST anomalies on each zone with a focus on Kiremt (JJAS) rainfall. The results showed that Kiremt rainfall in various parts of Ethiopia is controlled or influenced by the equatorial Pacific, the midlatitude northwest Pacific, and the Gulf of Guinea. A warm anomaly in the equatorial pacific reduces rainfall in the northeast and western part of Ethiopia, while a cold anomaly has the opposite effect. Furthermore, a warm SST anomaly produces excess rainfall via weakening of the TEJ and the East African Low-Level Jet (EALLJ), a southward shift in the AEJ, and reduced moisture inflow. Diro discovered that both warm and cold anomalies produce a slight increase in total Kiremt rain in northern Ethiopia but the effects are not the same in individual months. The month of September displayed the greatest contrast when warm SST occasioned increased rainfall and cold anomaly caused a decrease. Cane (Citation1993), indicated that an increase by an average of 2 degrees Celsius and an exceeding 6 degrees Celsius in the equatorial SSTs in the Pacific Ocean on the coast of Peru, triggered one of the most extreme drought events of the past century in the year 1982/83. In the following years 1983/84, Ethiopia experienced one of the worst drought events of its history with the death of millions of people and animals and the destruction of crops. Drought was higher in summer (Kiremt) which is the main rainy season than during spring (Belg). According to Edossa et al. (Citation2010) and Viste et al. (Citation2013), the absence of rain during the summer season in Ethiopia ultimately leads to the failure of 85% to 95% of the food crops in Ethiopia.
Most parts of the study area witnessed extreme magnitude droughts. The years 1984 and 2015 were the most utmost with distinct-wide drought episodes. All stations experienced extreme magnitude drought ranging from −2.8 to −1.6 for 4-month (seasonal) and from −2.9 to −1.6 for 12-month (annual) timescales for SPEI, while SPI-4 month it ranges from −3.2 to −1.8 and SPI 12-month ranges −3.2 to −1.8. The selected meteorological were affected from moderate drought to extreme drought during the historical drought episodes in Ethiopia, specifically those of 1983/84, 1986/87, 1991/92, 1998/99, 2015/16. Considering the occurrence of drought and the ENSO phenomena, the drought of 1984 can be explained by an El Nino and that of 1999 is related to the La Niña phenomena.
Dila stations were specifically affected by the 1999 drought event and Gelemso was affected by both the 1986 and 2015 droughts. These findings agree with the findings of Mohammed et al. (Citation2018), who found that all stations in the South Wollo zone (northeast) of Ethiopia experienced extreme magnitude droughts in 1999, except for Wereilu and Haik (which had severe magnitude). Segele and Lamb (Citation2005) and Viste et al. (Citation2013) also confirm the 1984 summer drought severity across Ethiopia. Many pieces of research have shown that occurrences of extreme magnitude droughts have important implications on rainfed agriculture (Bhuiyan and Kogan Citation2010; Ellis et al. Citation2010), with impacts extending to several years if there is no effective coping mechanism. The 1984 and 2015 droughts resulted in widespread malnutrition, food insecurity, devastated livelihoods, and deaths.
Our study revealed considering the 14 homogeneous rainfall zones proposed by (Korecha and Sorteberg Citation2013) that between 1983 to 2020, water deficit and recurrent drought spells were more pronounced in the Northern (Zone III), Southwestern (Zone VII), Southeastern (Zone XIII) and Northeastern (Zone I) parts of Ethiopia. Kaniewski et al. (Citation2012) and Oki and Kanae (Citation2006), have had similar observations over the region of central Southwest Asia, where, water deficit and recurrent drought spells dramatically affected the socio-economic conditions of the inhabitants. Zhou (Citation2013) found an uneven distribution of drought in Mongolia. The author found that drought was more pronounced and intense in the eastern part than the western part of the country which is similar to the changing pattern of drought found in this study per homogeneous rainfall zones. It has been ascertained that climate change and variability will affect the water cycle and availability (IPCC, 2014). According to Sarwar (Citation2008), a long-term drought episode can affect the yield of rainfed crops by about 60-80% and 15-20% for irrigated crops. Tigkas (Citation2008) reported that longer drought episodes would negatively affect the length of the growing season and crop yields. On the other hand, an increase in annual rainfall or increase of surplus in rainfall has been reported to positively influence vegetation greenery and decrease dust loading in an arid or desertic area (Hanif et al. Citation2013; Zhang et al. Citation2015; Zhao and Dai Citation2015; Jin and Wang Citation2018). In a study by Birsan et al. (Citation2014), in Roumania, a constant increase in climatic water deficit over decades led to lower streamflow rates in almost all catchments countrywide. Wu et al. (Citation2019) found a strong positive correlation between SPI/SPEI and soil relative humidity but discovered a better and stronger relationship between SPI and soil relative humidity (R = 0.598). Xu et al. (Citation2015) argued that the relationship between SPI and soil relative humidity may be better than that between the SPEI and soil relative humidity because SPI is mainly derived from precipitation and soil humidity is also mainly affected by precipitation.
Our analysis showed that SPI is slightly severe compared to SPEI and this observation was made from the comparison of average SPI-4 months and SPEI-4 months from 1983 to 2020. The pair-wise comparison between SPI-4 month and SPEI-4 month of the 14 homogeneous rainfall zones. Although the SPI can describe the variations of drought, it ignores the effect of evaporation on drought. However, the SPEI considers both precipitation and evapotranspiration, and in the context of global warming, it is more suitable for drought monitoring in arid and semiarid areas (Tan et al. Citation2015; Labudová et al. Citation2017; Tirivarombo et al. Citation2018).
5. Conclusion
This study estimated meteorological droughts by using the standardized precipitation index (SPI) and the standardized precipitation evapotranspiration index (SPEI) in Ethiopia from 1983 to 2020. The analysis of the average trend of SPI and SPEI from 1983-to 2020 showed a weak positive trend. Likewise, similar trends were observed in the individual 14 rainfall homogenous zones of Ethiopia. The 4- and 12-month time scales were used to analyze drought occurrences in 16 stations in Ethiopia. The study observed that during the study period, drought events vary spatially and temporally. The years 1984/85, 1997/98, and 2015/16 witnessed the most impactful and countrywide drought episodes. Almost all stations experienced extreme drought at a 4-month scale and 12-month timescales in the specified years. The magnitude of droughts deep to extremes of ‘−2.9′ for both SPEI 4 and SPEI-12 timescale in the area. This drought magnitude portends the likelihood of inescapable food insecurity and the need for preparedness in adapting to these situations as they will be more frequent in the face of climate change. From the findings of this study, the attention of policymakers with local-scale planning must be focused on the Northwestern, northeastern and southeastern parts of Ethiopia. Government interventions and preparedness for drought should focus more on effective strategies to cope with drought through developing more resilient ecosystems, adaptation strategies like water harvesting, making irrigation systems more efficient, and a geographical shift of the agricultural system. The rainfall deficit according to the geographical location should be a good guide for future interventions. Areas with a rainfall deficit between 8% and 16% should be prioritized, given their vulnerability to drought conditions. This study provides foundational information for future studies on drought assessments for the development of early warning systems, drought preparedness, contingency planning, and climate change adaptation.
Acknowledgments
The authors acknowledge the National Meteorological Agency of Ethiopia for providing the rainfall and surface air temperature measurement data. We also express our gratitude to the Institute of Climate and Society at Mekelle University for the administrative and technical assistance.
Disclosure statement
No potential conflict of interest was reported by the author(s).
Data availability statement
The data and materials that support the findings of this study are freely available from the corresponding author, [Kourouma, J.M], and can be shared upon reasonable request. The Climate Hazards Group Infrared Precipitation with Station data (CHIRPS) rainfall estimates can be obtained from the Climate Hazard Group (https://chg.geog.ucsb.edu/data/chirps/).
Additional information
Funding
References
- Abebe T, Sterck FJ, Wiersum KF, Bongers F. 2013. Diversity, composition, and density of trees and shrubs in agroforestry homegardens in Southern Ethiopia. Agroforest Syst. 87(6):1283–1293.
- Abramowitz M, Stegun IA. 1965. Handbook of mathematical functions: With formulas, graphs, and mathematical tables. US Department of Commerce. National Bureau of Standards Applied Mathematics series. p.953.
- Adnan S, Ullah K, Shuanglin L, Gao S, Khan AH, Mahmood R. 2018. Comparison of various indices to monitor drought status in Pakistan. Clim Dyn. 51(5–6):1885–1899.
- Adnan S, Ullah K, Gao S. 2015. Characterization of drought and its assessment over Sindh, Pakistan during 1951-2010. J Meteorol Res. 29(5):837–857.
- Akinyemi DF, Ayanlade OS, Nwaezeigwe JO, Ayanlade A. 2020. A comparison of the accuracy of multi-satellite precipitation estimation and ground meteorological records over Southwestern Nigeria. Remote Sens Earth Syst Sci. 3(1–2):1–12.
- Araya A, Habtu S, Haile M, Sisay F, Dejene T. 2011. Determination of local barley (Hordeum vulgare) crop coefficient and comparative assessment of water productivity for crops grown under the present pond water in Tigray, northern Ethiopia. MEJS. 3(1):65–79.
- Ayalew M. 1996. Former head of the early warning and planning department, The relief and rehabilitation commission. Addis Ababa, Ethiopia: Letter.
- Babu A. 1999. The impact of pacific sea surface temperature on the Ethiopian rainfall (Lecture Notes-NMSA), s.l.: 1st DMC Nairobi Capacity Building Workshop, 11 January to February 1999. Unpublished Lecture Notes (quoted T.W.Giogis, The Case of Ethiopia and R.G. Worku, 2012).
- Baeriswyl PE, Rebetez M. 1997. Regionalization of precipitation in Switzerland using principal component analysis. Theor Appl Climatol. 58(1–2):31–41.
- Bayissa YA, Moges SA, Xuan Y, Van Andel SJ, Maskey S, Solomatine DP, Griensven AV, Tadesse T. 2015. Spatio-temporal assessment of meteorological drought under the influence of varying record length: the case of Upper Blue Nile Basin, Ethiopia. Hydrological Sci J. 60(11):1927–1942.
- Beniston M, Stephenson DB, Christensen OB, Ferro CAT, Frei C, Goyette S, Halsnaes K, Holt T, Jylhä K, Koffi B, et al. 2007. Future extreme events in European climate: An exploration of regional climate model projections. Clim Change. 81(S1):71–95.,
- Bhuiyan C, Kogan FN. 2010. Monsoon variation and vegetative drought patterns in the Luni Basin in the rain-shadow zone. Int J Remote Sens. 31(12):3223–3242.
- Birsan MV, Zaharia L, Chendes V, Branescu E. 2014. Seasonal trends in Romanian streamflow. Hydrol Process. 28(15):4496–4505.
- Bisrat, Berhanu B. 2019. Drought in Ethiopia: Temporal and spatial characteristics in Ethiopia. Addis Ababa, Ethiopia: Addis Ababa University, Institute of Technology (AAIT).
- Camberlin P, Janicot S, Poccard I. 2001. Seasonality and atmospheric and atmospheric dynamics of teleconnection between African rainfall and tropical sea-surface temperature: Atlantic vs ENSO. Int J Climatol. 21(8):973–1005.
- Camberlin P, Philippon N. 2002. The East African March-May rainy season: Associated atmospheric dynamics and predictability over the 1968-97 period. J Climate. 15(9):1002–1019.
- Cane MA. 1993. ENSO and its prediction: How well can we forecast it?. Usable Science: Food Security, Early Warning, and El Nino, Budapest, Hungary, Boulder National Center for Atmospheric Research, 25–28 October.
- CSA. 2014. CSA, The Federal Democratic Republic of Ethiopia Statistical abstract for 2013, Central Statistics Authority.
- Curry CL, Zwiers W. 2018. Examining controls on peak annual streamflow and floods in the Fraser River Basin of British Columbia. Hydrol Earth Syst Sci. 22(4):2285–2309. (),
- Davey MK, Brookshaw A, Ineson S. 2014. The probability of the impact of ENSO on precipitation and near-surface temperature. Clim Risk Mgt. 1:5–24.
- Degefu W. 1987. Some aspects of meteorological drought in Ethiopia. In: Drought and hunger in Africa. Cambridge: Cambridge University Press.
- Degefu MA, Bewket W. 2017. Variability, trends, and teleconnections of stream flows with large-scale climate signals in Omo-Ghibe River Basin, Ethiopia. Environ Monit Assess. 129(2):173–186..
- Degefu MA, Rowell DP, Bewket W. 2017. Teleconnections between Ethiopian rainfall variability and global SSTs: observations and methods for model evaluation. Meteorol Atmos Phys. 129(2):173–186.
- Demissie B, Amsalu A, Tesfamariam Z, Nyssen J, Meaza H, Asfaha T G, Zenebe A, Gregoretti C, Van Eetvelde V, 2022. Landscape changes in the semi-closed Raya agricultural graben floor of Northern Ethiopia. ‘Earth Syst. Environ. 6(2):453–468.
- Deressa T. 2007. Measuring the economic impact of climate change on Ethiopian agriculture: Ricardian approach. Washington, DC: World Bank Policy Research Paper No.4342, World Bank.
- Dinku T, Thomson MC, Cousin R, del Corral J, Ceccato P, Hansen J, Connor SJ., 2018. Enhancing national climate services (ENACTS) for development in Africa. Development. 10(7):664–672.
- Diro GT, Grimes DI, Black E. 2011. Teleconnections between Ethiopian summer rainfall and sea surface temperature: part II. Seasonal forecasting. Clim Dyn. 37(1–2):121–131.
- Droogers P, Allen RG. 2002. Estimating reference evapotranspiration under inaccurate data conditions. Irrigation and Drainage Syst. 16(1):33–45.
- Duan Z, Bastiaanssen WG. 2013. First results from Version 7 TRMM 3B43 precipitation product in combination with a new downscaling-calibration procedure. J Remote Sens Environ. 131:1–13.
- Du L, Tian Q, Yu T, Meng Q, Jancso T, Udvardy P, Huang Y. 2013. A comprehensive drought monitoring method integrating MODIS and TRMM data. Int J Appl Earth Obs Geoinf. 23:245–253.
- Edossa DC, Babel MS, Gupta AD. 2010. Drought analysis in the Awash River Basin, Ethiopia. Water Resour Manage. 24(7):1441–1460.
- EIAR. 2011. Coordination of national agricultural system. Addis Ababa: EIAR (Ethiopian Institute of Agricultural Research).
- El Kenawy AM, McCabe MF, Vicente-Serrano SM, López-Moreno JI, Robaa SM. 2016. Change in the frequency and severity of hydrological droughts over Ethiopia from 1960 to 2013. CIG. 42(1):145–166.
- Ellis AW, Goodrich GB, Garfin GM. 2010. Hydroclimatic index for examining patterns of drought in the Colorado River Basin. Int J Climatol. 30(2):236–255.
- Eze E, Girma A, Kourouma JM, Zenebe A. 2020b. Exploring the possibilities of remote yield estimation using crop water requirement for area yield index insurance in data-scarce dryland. J Arid Environ. 183:104–261.
- Eze E, Atkilt G, Zenebe AA, Zenebe G. 2020. Feasible crop insurance indexes for drought risk management in Northern Ethiopia. Int J Disaster Risk Reduc. 47:101544.
- Eze E, Girma A, Zenebe A, Okolo CC, Kourouma JM, Negash E. 2022. Predictors of drought-induced crop yield/losses in two agro-ecologies of Southern Tigray, Northern Ethiopia. Sci Rep. 12(1):62–84.
- Ezzine H, Bouziane A, Ouazar D. 2014. Seasonal comparisons of meteorological and agricultural drought indices in Morocco using open short time-series data. Int J Appl Earth Obs Geoinf. 26:36–48.
- Farhat A, et al. 2013. Changes in precipitation extremes over arid to semiarid and subhumid Punjab. Theor Appl Climatol. 116:671–680.
- FDRE. 2017. Multi-sector investment plan for climate resilient agriculture and forest development 2017–2030. Addis Ababa: Federal Democratic Republic of Ethiopia (FDRE).
- Ferris-Morris M. 2003. Planning for the next drought: Ethiopia case study. Washington: USAID.
- Funk C, Peterson P, Landsfeld M, Pedreros D, Verdin J, Shukla S, Husak G, Rowland J, Harrison L, Hoell A, et al. 2015. The climate hazards infrared precipitation with a stations-A new environmental record for monitoring extremes. Sci Data. 2(150066):621.
- Gebre AB, Birhane E, Gebresamuel G, Hadgu KM, Norgrove L. 2019. Woody species diversity and carbon stock under different land-use types at Gergera watershed in eastern Tigray, Ethiopia. Agroforest Syst. 93(3):1191.
- Gebrechorkos SH, Hulsmann S, Bernhofer C. 2019. Regional climate projections for impact assessment studies in East Africa. Environ Res Lett. 14(4):044031.
- Gebrechorkos SH, Hulsmann S, Bernhofer C. 2020. Analysis of climate variability and droughts in East Africa using high-resolution climate data. Global Planet Change. 186:103130–103130.
- Gebrehiwot K, Muys B, Haile M, Mitloehner R. 2003. Introducing Boswellia papyrifera (Del.) Hochst and its non-timber forest product, frankincense. J Int For Rev. 5(4):348–353.
- Gebrehiwot T, van der Veen A, Maathuis B. 2011. Spatial and temporal assessment of drought in the Northern highlands of Ethiopia. Int J Appl Earth Obs Geoinf. 13(3):309–321.
- Giddens A. 2009. Politics of climate change. Cambridge: Polity Press.
- Gissila T, Black E, Grimes DI, Slingo JM. 2004. Seasonal forecasting of the Ethiopian summer rains. Int J Climatol. 24(11):1345–1358.
- Glantz MH, Katz RW, Nicholls N. 1991. Teleconnections linking worldwide climate anomalies. Cambridge: Cambridge University Press.
- Gleixner S, Keenlyside N, Viste E, Korecha D. 2017. The El Nino effect on Ethiopian summer rainfall. Clim Dyn. 49(5–6):1865–1883.
- Gocic M, Trajkovic S. 2014. Drought characterization based on water surplus variability index. Water Resour Manage. 28(10):3179–3191.
- Guttman NB. 1994. On the sensitivity of sample L moments to sample size. J Climate. 7(6):1026–1029.
- Haile GG, Tang Q, Hosseini‐Moghari S‐M, Liu X, Gebremicael TG, Leng G, Kebede A, Xu X, Yun X. 2020. Projected impacts of climate change on drought patterns over East Africa. Earth's Future AGU-Adv Earth and Space Sci. 8(7):1–23.,
- Hanif M, Khan AH, Adnan S. 2013. Latitudinal precipitation characteristics and trends in Pakistan. J Hydrol Amst. 492:266–272.
- Hina S, Saleem F. 2019. Historical analysis (1981-2017) of drought severity and magnitude over a predominantly arid region of Pakistan. Clim Res. 78(3):189–204. (
- Hirko A, Mergia G, Nigussie A, Dandesa T. 2021. Meteorological drought assessment using GeoCLIM: Case study East and West Hararghe, Oromia, Ethiopia. Int J Res Environ Sci. 7(1):31–37.
- Jaewon K, et al. 2015. Impact of climate change on hydrological droughts in the upper Namhan River Basin. Korea. J Civil Eng. 19:376–384.
- Jin Q, Wang C. 2018. The greening of northwest Indian subcontinent and reduction of dust abundance resulting from Indian summer monsoon revival. Sci Rep Band. 8:4573.
- Kaluski DN, Ophir E, Amede T. 2002. Food security and nutrition: the Ethiopian case action. Public Health Nutr. 5(3):373–381.
- Kaniewski D, Van Campo E, Weiss H. 2012. Drought is a recurring challenge in the Middle East. Proc Natl Acad Sci U S A. 109(10):3862–3867.
- Khadr M. 2016. Forecasting of meteorological drought using {The} upper {Blue} {Nile} river basin, {Ethiopia}). AIN SHAMS Eng J. 7(1):47–56.
- Kharrufa NS. 1985. Simplified equation for evapotranspiration in arid region. Beitragezur Hydrologie. 5(1):39–47.
- Kiem AS, Verdon-Kidd DC. 2009. Climatic drivers of Victorian streamflow- Is ENSO the dominant influence? Austr J Water Resour. 1:13.
- Knapp KR, Ansari S, Bain CL, Bourassa MA, Dickinson MJ, Funk C, Helms CN, Hennon CC, Holmes CD, Huffman GJ, et al. 2011. Globally gridded satellite observations for climate studies. Bull Am Meteorol Soc. 92(7):893–907.
- Korecha D, Barnston A. 2007. Predictability of June-September rainfall in Ethiopia. Monthly Weather Rev. 135(2):628–650.
- Korecha D, Sorteberg A. 2013. Construction of homogeneous rainfall regimes for Ethiopia. Int J Climatol. 49:7681–7697.
- Kourouma JM, et al. 2021. Assessing the Spatio-temporal variability of NDVI and VCI as indices of crops productivity in Ethiopia: a remote sensing approach. Geo Nat Hazards Risk. 12(1):2880–2903.
- Labudová L, Labuda M, Takáč J. 2017. Comparison of SPI and SPEI applicability for a drought impact assessment on crop production in the Danubian Lowland and the East Slovakian Lowland. Theor Appl Climatol. 128(1–2):491–506.
- Lee SH, Yoo SH, Choi JY, Bae S. 2017. Assessment of the impact of climate change on drought characteristics in the Hwanghae Plain, North Korea using time series SPI and SPEI: 1981-2100. Water. 9(8):579.
- Li W. 2020. Spatiotemporal characteristics of drought in a semi-arid grassland over the past 56 years based on the Standardized Precipitation Index. Meteorol Atmos Phys.
- Manpreet SM. 2018. Ethiopia drought analysis using remote sensing. Ontario, Canada: University of Waterloo.
- Margaret FM. 2003. Planning for the next drought: Drought case study. Washington (DC): USAID.
- Masih I, Maskey S, Mussa FE, Trambauer P. 2014. A review of drought on the African continent: a geospatial and long-term perspective. Hydrol Earth Syst Sci. 18(9):3635–3649.
- McCann J. 1995. People of the plow: an agricultural history of Ethiopia, 1800-1990. Wisconsin: The University of Wisconsin Press.
- McKee TB, Doesken NJ, Kleist J. 1993. The relationship of drought frequency and duration to time scales. In: Proceedings of the 8th Conference on Applied Climatology, 17, p. 179–183.
- Mehr AD, Vaheddoost B. 2020. Identification of the trends associated with the SPI and SPEI indices across Ankara, Turkey. Theor Appl Climatol. 139(3–4):1531–1542.
- Mesbahzadeh T, Mirakbari M, Mohseni Saravi M, Soleimani Sardoo F, Miglietta MM. 2020. Meteorological drought analysis using copula theory and drought indicators under climate change scenarios (RCP). Meteorol Appl. 27(1):20.
- Mohammed Y, Yimer F, Tadesse M, Tesfaye K. 2018. Meteorological drought assessment in Northeast highlands of Ethiopia. IJCCSM. 10(1):142–160.
- Mondol MA, Das SC, Islam MN. 2016. Application of standardized precipitation index to assess meteorological drought in Bangladesh. Jamba. 8(1):280.
- Morid S, Smakhtin V, Moghaddasi M. 2006. Comparison of seven meteorological indices for drought monitoring in Iran. Int J Climatol. 26(7):971–985.
- Mwangi M. 2016. Diverse drought spatiotemporal trends, diverse etic-emic perceptions and knowledge: Implications for adaptive capacity and resource management for indigenous maasai-pastoralism in the rangelands of Kenya. Climate. 4(2):22.
- Nedealcov M, Raileanu V, Sirbu R, Cojocari R. 2015. The use of standardized indicators (SPI and SPEI) in predicting droughts over the Republic of Moldova territory. PESD J. 9(2):151–158.
- Neely C, Bunning S, Wilkes A. 2009. Review of evidence on drylands pastoral systems and climate change: implications and opportunities for mitigation and adaptation. In: Land Water Discuss Pap. Rome, Italy: FAO; p. 8.
- Negash E, Gebresamuel G, Embaye TA, Nguvulu A, Meaza H, Gebrehiwot M, Demissie B, Gebreyohannes T, Nyssen J, Zenebe A. 2020. Impact of headwater hydrological deficit on the downstream flood-based farming system in northern Ethiopia. Irrig Drain. 69(3):342–351.
- Nicholls N. 1993. What are the potential contributions of El Nino-Southern Oscillation Research to Early Warning of Potential Acute Food-deficit Situations. Workshop on Usable Science: Food Security, Early Warning, and El Nino, Budapest, Hungary, Boulder: National Center for Atmospheric Research, 25–28 October, 169–177.
- Nkemdirim L, Weber L. 1999. Comparison between the droughts of the 1930s and the 1980s in the southern prairies of Canada. J Climate. 12(8):2434–2450.
- Nkomo JC, Kulindwa K. 2006. The impact of climate change in Africa. Final Draft Submitted to the Stern Review on the Economics of Climate Change.
- Oki T, Kanae S. 2006. Global hydrological cycles and world water resources. Science. 313(5790):1068–1072.
- Paredes-Trejo F. 2020. Assessment of the CIRPS-based satellite precipitation estimates. Technopen:1–14.
- Pachauri RK. 2014. IPCC Climate change: synthesis report. In: Meyer L, editor. Core writing team, Contribution of working groups I, II, and III to the Fifth Assessment Report of the intergovernmental panel on climate change. Geneva: IPCC.
- Prudhomme C, Giuntoli I, Robinson EL, Clark DB, Arnell NW, Dankers R, Fekete BM, Franssen W, Gerten D, Gosling SN, et al. 2014. Hydrological droughts in the 21st century, hotspots and uncertainties from global multimodel ensemble experiment. Proc Natl Acad Sci U S A. 111(9):3262–3267.
- Qu C, Hao X, Qu JJ. 2019. Monitoring extreme agricultural drought over the horn of Africa (HOA) using remote sensing measurement. Remote Sens. 11(8):902.
- Quinn WH, Neal VT, Antunez de Mayolo SE. 1987. El Nino occurrence over the past four and half centuries. J Geophys Res. 92(C13):14449–14461.
- Rolbiecki R, Yücel A, Kocięcka J, Atilgan A, Marković M, Liberacki D. 2022. Analysis of SPI as a drought indicator during the maize growing period in Çukurova Region (Turkey). Sustainability. 14(6):3697–3697.
- Sarwar A. 2008. Droughts in Pakistan: a socio-political perspective. In: Jairath J, Ballabh V, editor. Droughts and integrated water resource management in South Asia: issues, alternatives, and futures. New Delhi: SAGE Publications; p. 200–230.
- Segele ZT, Lamb PJ. 2005. Characterization and variability of Kiremt rainy season over Ethiopia. Meteorol Atmos Phys. 89(1–4):153–180.
- Seleshi Y, Demaree GR. 1995. Rainfall variability in the Ethiopian and Eritrean highlands and its links with the southern oscillation index. J Biogeography. 22(4/5):945–952.
- Sen PK. 1968. Estimates of the regression coefficient based on Kendall's tau. J Am Stat Assoc. 63(324):1379–1389.
- Shanko D, Camberlin P. 1998. The effect of the southwest Indian Ocean tropical cyclones on Ethiopian drought. Int J Climatol. 18(12):1373–1378.
- Sharafati A, Nabaei S, Shahid S. 2019. Spatial assessment of meteorological drought features over different climate regions in Iran. Int J Climatol. 40(3):1864–1884.
- Sheffield J, Wood EF. 2008. Projected changes in drought occurrence under future global warming from multi-model, multi-scenario, IPCC AR4 simulations. Clim Dyn. 31(1):79–105.
- Sujitha E, Shanmugasundaram K. 2017. Analysis of dry/wet conditions using the Standardized Precipitation Index and its potential usefulness for drought/flood monitoring in the regions of Trichy. J pharmacogn phytochem. 6(4):452–457.
- Tagel G, Veen V. d, Maathuis B. 2011. Spatial and temporal assessment of drought in the Northern highlands of Ethiopia. Int J Appl Earth Obs Geoinform. 13(3):309–321.
- Tallaksen LM, Lanen HA. 2004. Hydrological drought: processes and estimation methods for streamflow and groundwater. Vol. 48: Elsevier.
- Tan C, Yang J, Li M. 2015. Temporal-spatial variation of drought indicated by SPI and SPEI in Ningxia Hui autonomous region, China. Atmosphere. 6(10):1399–1421.
- Thornthwaite CW. 1948. An approach toward a rational classical of climate. Geogr Rev. 38(1):55.
- Tigkas D. 2008. Drought characterization and monitoring in regions of Greece. Eur Water. 23:29–39.
- Tigkas D, Vangelis H, Tsakiris G. 2015. DrinC: a software for drought analysis based on drought indices. Earth Sci Inform. 8(3):697–709.
- Tigkas D, Vangelis H, Tsakiris G. 2017. An enhanced effective drought index for the characterization of agricultural drought. Environ Process. 4(S1):137–148.
- Tirivarombo S, Osupile D, Eliasson P. 2018. Drought monitoring and analysis: Standardized Precipitation Evapotranspiration Index (SPEI) and Standardized Precipitation Index (SPI). Phys Chem Earth Parts A/B/C. 106:1–10.
- Tsakiris G, Pangalou D, Vangelis H. 2007. Regional drought assessment based on the Reconnaissance Drought Index (RDI). Water Resour Manage. 21(5):821–833.
- US National Drought Mitigation Center. 2010. The Standardized precipitation index, s.l.: https://www.drought.unl.edu/monitor/spi/program/SPI. Zimbabwe.doc.
- Vicente-Serrano SM, Begueria S, Lopez-Moreno JI. 2010. A multiscalar drought index sensitive to global warming: the standardized precipitation evapotranspiration index. J Climatol. 23(7):1696–1718.
- Vicente-Serrano SM, Beguería S, Lorenzo-Lacruz J, Camarero JJ, López-Moreno JI, Azorin-Molina C, Revuelto J, Morán-Tejeda E, Sanchez-Lorenzo A., 2012. Performance of drought indices for ecological, agricultural, and hydrological applications. J.Earth Interact. 16(10):1–27.
- Vicente-Serrano SM, Chura O, López-Moreno JI, Azorin-Molina C, Sanchez-Lorenzo A, Aguilar E, Moran-Tejeda E, Trujillo F, Martínez R, Nieto JJ, et al. 2015. Spatio-temporal variability of droughts in Bolivia: 1955-2012. Int J Climatol. 35(10):3024–3040.
- Viste E, Korecha D, Sorteberg A. 2013. Recent drought and precipitation tendencies in Ethiopia. Theor Appl Climatol. 112(3–4):535–551.
- Web P, Braun J. 1990. Drought and food shortages in Ethiopia: a preliminary review of effects and policy implications in Ethiopia. International Food Policy Research Institute; p. 169.
- Webb P, von Braun J. 1994. Famine and food security in Ethiopia: Lessons for Africa. Chichester: John Wiley & Sons.
- WMO & GWP. 2016. Handbook of drought indicators and indices (M. Svoboda and BA Fuchs). Integrated Drought Management Programme (IDMP), Integrated Drought Management Tools and Guidelines Series.
- Worku M, Sahile S. 2018. Review on the impact of El Nino Southern Oscillation (ENSO) climate changes in Ethiopia. J Climatol Weather Forecast.
- Wu D, Fang S, Li X, He D, Zhu Y, Yang Z, Xu J, Wu Y. 2019. Spatial-temporal variation in irrigation water requirement for the winter wheat-summer maize rotation system since the 1980s on the North China Plain. Agric Water Manag. 214:78–86.
- Wu H, Hayes MJ, Weiss A, Hu Q. 2001. An evaluation of the standardized precipitation index, the China-Z-index, and the statistical Z-score. Int J Climatol. 21(6):745–758.
- Xu K, Yang D, Yang H, Li Z, Qin Y, Shen Y. 2015. Spatio-temporal variation of drought in China during 1961-2012: A climatic perspective. J Hydrol. 526:253–264.
- Yared BA. 2015. Spatio-temporal assessment of meteorological drought under the influence of varying record length: the case of Upper Blue Nile Basin, Ethiopia. Hydrol Sci J. 60(11):1927–1939.
- Yevjevich V. 1967. An objective approach to definitions and investigations of continental hydrologic drought. Hydrology Paper No.23. Fort Collins (CO): Colorado State University.
- Yildirak K, Selcuk-Kestel AS. 2015. Adjusting SPI for crop-specific agricultural drought. Environ Ecol Stat. 22(4):681–691.
- Zhang A, Zheng C, Wang S, Yao Y. 2015. Analysis of streamflow variations in the Heihe River basin, northwest China: trends, abrupt changes, driving factors, and ecological influences. J Hydrol Reg Stud. 3:106–124.
- Zhao T, Dai A. 2015. The magnitude and causes of global drought changes in the twenty-first century under a low-moderate emissions scenario. J Clim. 28(11):4490–4512.
- Zhou Y. 2013. Temporal and spatial patterns of droughts based on standardized precipitation index (SPI) in inner Mongolia during 1981-2010. J Nat Resour. 28:1694–1706.
Appendices
Table A1. Summary of Number of months of deficit, Maximum water surplus, and deficit from 1983 to 2020.
Table A2. Abbreviations.
Table A3. Meteorological drought-based SPI-4 months for (1983–2020).
Table A4. Meteorological drought-based SPI-12 months for (1983–2020).