
 ?Mathematical formulae have been encoded as MathML and are displayed in this HTML version using MathJax in order to improve their display. Uncheck the box to turn MathJax off. This feature requires Javascript. Click on a formula to zoom.
Abstract
We utilized a two-branch end-to-end network (MultiSenCNN) for land use and land cover (LULC) classification and flood event mapping using multispectral (MS), panchromatic (Pan) and synthetic aperture radar (SAR) images, where flooding was induced by typhoon Lekima in August 2019. Flood damages were assessed by considering both the LULC and flood maps. We defined three strategies to compare the MS + SAR and MS + Pan images to demonstrate the ability of the MultiSenCNN algorithm for LULC classification. The three strategies yielded an average overall accuracy of ∼98% and an average Kappa of ∼0.98 for LULC classification. The overall accuracy of the fused MS + SAR images is slightly higher than the MS + Pan images when using the same model training samples. The flood mapping shows an overall accuracy of 97.22% and a Kappa of 0.94, with a flood inundation area of 101 km2 that mainly inundated cropland and urban areas. Compared to other LULC types, the flooded cropland has caused more loss of ecosystem service values during typhoon Lekima, accounting for 81.19% of the total. Using SAR mages can well monitor the start/end states of flood events and the inundated areas, providing the flood status information to rescuers and governments for making timely decisions.
1. Introduction
Coastal areas are among the most environmentally vulnerable regions and are frequently affected by typhoons and heavy rainfall brought about by extreme marine climates (Yin et al. Citation2013; Modrick and Georgakakos Citation2015). Disastrous weather usually causes flooding and geological hazards, resulting in the loss of human life and property (Elkhrachy Citation2015; Tripathi et al. Citation2020). The coastal areas of southeast China are typical of rapidly urbanizing and industrializing regions with high levels of socioeconomic development, and are widely selected as research areas for urban sprawl simulation and disaster assessment (Zhang et al. Citation2017; Feng et al. Citation2019; Wang et al. Citation2020). Therefore, disasters may cause huge losses of economically valuable land and put great pressure on urban operations. Spaceborne and airborne remote sensing is an effective technique for observing surface changes and various hazards, especially in examining the coastal environment (Hussein et al. Citation2020; Kocaman et al. Citation2020; Ahammed and Pandey Citation2021). It is essential to identify typhoon-induced floods and analyse their effects on land use and land cover (LULC) and their related properties, thus providing useful recommendations for policy regulation in coastal areas to achieve more sustainable development.
Optical remote sensing and synthetic aperture radar (SAR) images are effective materials for mapping LULC change and investigating flood occurrence (Weiss et al. Citation2020; Bhatt et al. Citation2021). However, optical remote sensing is sensitive to weather conditions, thus the image quality is typically poor in periods of cloudy or thunderstorm weather (Huang and Jin Citation2020). In comparison, SAR can work all-day and in all-weather to detect LULC change and monitor natural hazards. The digital numbers in SAR images indicate the backscattering characteristics of the ground targets and the changes in backscattering coefficients can reveal the property changes of the ground targets (Amitrano et al. Citation2018). In particular, the backscattering coefficients in SAR images usually change when flooding occurs in areas with different LULC types.
Hitherto, various SAR satellites with sensors of different microwave wavelengths have been launched, for example, RADARSAT-2 and Sentinel-1 in C-band, COSMO-SkyMed constellation, and TerraSAR-X in X-band, and ALOS-1/2 in L-band. SAR actively transmits microwave signals to the Earth, and its return signal can reflect meaningful information about surface parameters (Moreira et al. Citation2013), which can be used to produce topographic maps, detect land resources, and monitor natural hazards. Dual polarization or full polarization SAR images can be applied or integrated with the optical images to produce maps of urban lands, wetlands, and forests using many methods such as deep learning classifiers (Adeli et al. Citation2021). To monitor disasters such as flood inundation using SAR images, scientists have proposed a few automatic algorithms such as seeded region growing and random forest (Kussul et al. Citation2011; Hao et al. Citation2021). The crucial issue in flood detection and mapping is to improve the accuracy of flood area extraction and to perform accurate damage assessment.
Different from optical remote sensing, SAR as an active detection technique can measure the dielectric and geometric properties of ground targets (Li et al. Citation2014; Mondini Citation2021). This suggests that SAR can provide critical information for LULC classification in addition to that provided by optical sensors (Salentinig and Gamba Citation2015; Tavus et al. Citation2022b). For example, Shakya et al. (Citation2020) described fusion methods to combine different spectral, spatial, temporal, and radiometric data for acquiring better quality images and improving classification results. This work demonstrates the potential of using convolutional neural networks to integrate Sentinel-1 SAR images and Sentinel-2 optical images in detecting agricultural land. Recently, Adrian et al. (Citation2021) compared standalone optical, standalone SAR, and SAR-optical fusion images in crop mapping using a 3D deep learning network and demonstrated that the overall accuracy of the SAR-optical fusion images was higher. While these useful efforts have contributed to the improvement of SAR and optical imagery for LULC mapping, the use of medium-resolution imagery (e.g. Landsat-8 and Sentinel-1) may provide new knowledge about LULC mapping in coastal areas.
Polarimetric SAR (PolSAR) produces common medium-resolution images that measure the scattering behaviour of ground targets in various states of transmission and receiving polarization (Lee and Pottier Citation2017). These images provide more details to distinguish between different LULC types. Classification methods for PolSAR images usually fall into three categories (Ren et al. Citation2021): (1) classifiers that use the physical scattering properties of ground targets; (2) classifiers that use the statistical properties of PolSAR images; (3) machine learning or deep learning classifiers. For example, based on the polarization scattering mechanisms, methods such as the Freeman decomposition and the H/A/alpha decomposition were proposed for ground target identification and image classification (Eini-Zinab et al. Citation2020). Statistics from PolSAR images, such as the covariance matrix and the consistency matrix, were introduced into LULC classification and showed good robustness in the application (Ren et al. Citation2021). Machine learning methods can classify PolSAR images for LULC by analysing data structures and extracting knowledge (Paoletti et al. Citation2019; Wang et al. Citation2021). However, a scene of PolSAR image usually covers a limited area and the image availability sometimes restricts the application in large-scale areas.
With regard to various LULC types and ancillary properties, the use of SAR images to estimate flood damage is of great importance for integrated regional management. The methods for estimating flood inundation typically include (Huang and Jin Citation2020): (1) thresholding algorithms for SAR backscattering coefficients; (2) Red-Green-Blue (RGB) composition methods; (3) classification-based methods. For the thresholding algorithms, the literature commonly applies single or multiple thresholds to identify the flood areas (Shivaprasad Sharma et al. Citation2017; Elkhrachy et al. Citation2021). For example, a two-step automatic change detection chain was proposed by Li et al. (Citation2018) for rapid mapping of flooding by using Sentinel-1 SAR images, and the method shows good performance in detecting multiple flood events in Greece and United Kingdom. The literature also indicates that although thresholding algorithms can conduct fast detection and extraction of flood inundation, they are more suitable for detecting completely inundated areas instead of partially inundated areas.
The RGB composition method can be used for both displaying the region of interest and preprocessing to assist flood identification (Dellepiane and Angiati Citation2012). The RGB composition has been introduced in flood inundation mapping using different types of remotely sensed images (Cossu et al. Citation2009; Kotaridis and Lazaridou Citation2021). For example, an integrated approach of the RGB composition method and the thresholding method was applied to mapping the flood inundation in the Ebro River using Sentinel-1 data (Carreño Conde and De Mata Muñoz Citation2019). The results show that the flood inundation areas are consistent with those identified using aerial orthophotos. Some studies utilized unsupervised or supervised remote sensing classifiers to extract flood inundation areas using SAR images, avoiding the definition of thresholds that may lead to uncertainties (Amitrano et al. Citation2018; Tavus et al. Citation2020; Elkhrachy Citation2022). For example, Vanama and Rao (Citation2019) introduced an active self-learning convolution neural network-based classifier to extract urban floods in Houston using TerraSAR-X images. Tavus et al. (Citation2022a) employed the U-Net architecture for multi-class segmentation of flooded areas and flooded vegetation using Sentinel-1 SAR data. Despite the progress, few studies have focused on the use of medium-resolution SAR and optical imagery for LULC classification and flood inundation assessment in densely populated coastal areas. Therefore, it is necessary to examine the fusion of SAR and optical images to classify LULC and assess flood inundation over a wide coastal area of about several thousand square kilometres.
This study aims to exploit deep learning methods for LULC mapping and typhoon-induced flood assessment in coastal areas using medium-resolution SAR and optical fusion images, ultimately improving the accuracy of mapping and assessment. Specifically, we applied the multi-sensor convolutional neural network (MultiSenCNN) to extract the spatial spectrum contexts from both SAR and optical images to produce LULC patterns at Linhai, a coastal city in China. In previous studies, MultiSenCNN was employed to process panchromatic (Pan) and multispectral (MS) remote sensing images for LULC classification, which demonstrates the multipurpose property of MultiSenCNN (Gaetano et al. Citation2018). In addition, MultiSenCNN was used for multi-resolution land cover classification with better results than deep multi-instance learning (Liu et al. Citation2022). To reduce the flood mapping uncertainties, we calculated the differences between the pre-typhoon and post-typhoon SAR images to improve the identification accuracy. Our study should have practical implications for using the medium-resolution SAR and optical images for LULC mapping and flood assessment in other coastal areas.
2. Methodology
2.1. Study area and the datasets
Our case study area is Linhai city in Taizhou, Zhejiang Province, southeast of China (). According to the official report (TZnews Citation2021), from 1949 to 2020 a total of 304 typhoons transited through Taizhou, an average of 4–5 typhoons of varying degrees per year; among these, 19 typhoons have directly landed in Taizhou. On 10 August 2019, typhoon Lekima made landfall on the coast of Chengnan Town (121.443°E, 28.266°N) at the Wenling City of Taizhou. Lekima moved northward through Taizhou and caused severe rainfall in the central area of Linhai city (), making this area heavily flooded. Thus, Linhai was selected as the ideal area to investigate the flood inundation and assess its effects on LULC via the fusion of multitemporal SAR and optical images.
Figure 1. The study area of Linhai and the footprints of the SAR and optical images.
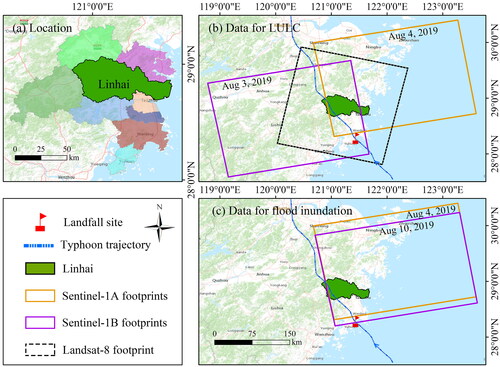
In this study, the selected SAR images are the Sentinel-1 level-1 SLC datasets, which were acquired using the interferometric wide (IW) swath mode. The width of the IW mode is 250 km and the ground resolution is 15 m. shows three SAR images, where two (see also ) acquired on 4 and 10 August 2019 were from Sentinel-1A/B and the other (see also ) acquired on 10 August 2019 was from Sentinel-1B. The optical image used in this study is a Landsat-8 OLI image (see also ) acquired on 17 December 2018, with a spatial resolution of 30 m. For LULC classification, the VV-polarized SAR images are input to SAR-CNN to extract spatial information. Grassland has a higher signal in VV polarization than in VH polarization, and the VV signal size varies more between LULC types than VH signal, therefore VV signal can achieve a better classification than VH signal (Abdel-Hamid et al. Citation2020; Shakya et al. Citation2020). In addition, Sentinel-1’s VV polarization images have been widely used for land cover, flood, and soil moisture mapping (Tavus et al. Citation2018; Orlíková and Horák Citation2019; Sica et al. Citation2019; Vanama and Rao Citation2019). These applications have successfully demonstrated the potential of VV polarization in LULC mapping.
Table 1. The Sentinel-1 SAR and Landsat-8 optical images used in this study.
2.2. Selection of the training and test samples
We divided the LULC types into cropland, woodland, urban, and water body by comparing the high-resolution Google Earth images on 9 October 2019, Landsat-8 OLI images, and SAR images. To interpret LULC types, training samples were selected based on high-resolution Google Earth images (). A total of 132,045 pixels (samples) including 4 types were selected in Linhai, accounting for 1.36% of the study area (). The pixels were divided into two sets: 70% were used as the training samples and the remaining 30% were used as the test samples (). For flood inundation mapping, a total of 173,234 pixels covering both the flood and non-flood areas were used as the training and test sets (), accounting for 1.8% of the study area (). The samples of flood mapping are larger than those of LULC mapping because the heavy rainfall increased the water extent of woodland and agricultural land; therefore, we increased the samples of both flood and non-flood to highlight their differences.
Figure 2. The training and test sets for LULC classification and flood mapping, where each selected area is highlighted by the subset images of MS, SAR, and Pan (the right panel).
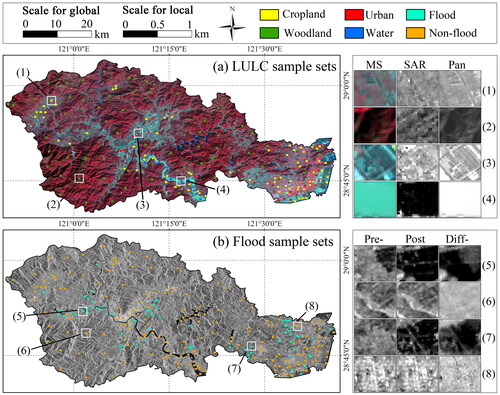
Table 2. The number and percent of the training and test samples for land use classification and flood mapping.
2.3. Procedure of LULC and flood mapping
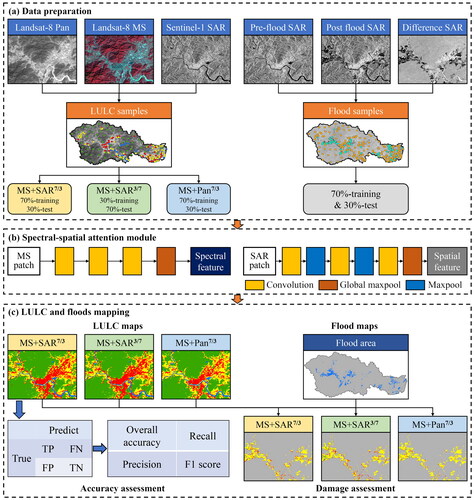
shows that the research procedure consists of three steps including 1) data pre-processing, (2) image fusion and classification, and (3) inundation mapping and damage assessment. First, the data pre-processing of the three Sentinel-1 SAR images includes multi-directional viewing, speckle filtering, and geocoding of VV polarization. The pixel values were converted to backscattering in decibels to increase the variation in SAR imagery for different LULC types. The final SAR images were resampled to a ground sampling distance of 15 m and projected to the WGS84/UTM coordinate system (Elkhrachy Citation2022). In addition, radiometric and atmospheric corrections were performed to calibrate the Landsat-8 optical images. A high-resolution Google Earth map was used to select samples for the supervised LULC classification, then the samples were randomly divided into the training and test sets. Second, the MS and SAR images were input to the MS-CNN and SAR-CNN networks, respectively, and for comparison, Pan images were also input to SAR-CNN. The MS-CNN network-based classifier was trained through the training samples, then the classifier was verified using the test sets. Finally, we utilized the pre-typhoon and post-typhoon SAR images and their difference maps as the inputs to SAR-CNN for deriving the flood inundation. The overlaying of the LULC and flood maps then jointly produced the inundation areas related to various LULC types.
Figure 3. The procedure of LULC mapping, flood mapping, and the consequent damage assessment.
2.4. MultiSenCNN structure
shows that the MultiSenCNN model is a two-branch CNN structure, i.e. MS-CNN for the MS images and SAR-CNN for the SAR images. The model processes the MS and SAR information at the initial resolution of the remote sensing images (Gaetano et al. Citation2018). For capturing the spectrum context information from MS and SAR images to label the sample, the pixel at the same location was represented by a pair of patches clipped from both the MS and SAR images. To ensure the spatial correlation of the MS and SAR image patches, the MultiSenCNN model was formulated with two preconditions as follows. One is that the spatial resolution ratio of the two kinds of images is equal to integer r, which means that if the patch size is d × d for the SAR image, then the patch size is d/r × d/r for the MS image. The other is to define d as a multiple of r, and this ensures that the number of patches is an integer. Each patch pair was associated with the centre pixel of the SAR patches and the land type label of the corresponding pixel.
Figure 4. The dedicated CNN structure to manage MS and SAR information for constructing the SoftMax classifier.
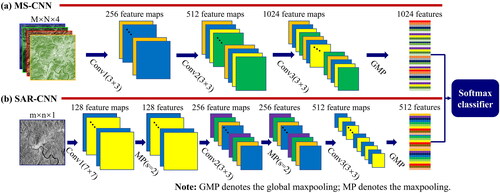
shows that each subcategory MultiSenCNN model transforms the input patch into two feature sets, which summarize the spatial and spectral information from the MS and SAR sources. Then, the two feature sets are combined by a simple concatenation and the features are used to directly label each pixel via the SoftMax classifier (Zhang et al. Citation2016). In this study, the final output is a LULC map of Linhai at the spatial resolution of SAR images.
shows that, for MS-CNN, no maxpooling operation was performed between two adjacent successive convolution stages, facilitating preserve the spectral information in the processing flow as much as possible. In the three convolutional layers, the kernel size was defined as 3 × 3 to reduce the spectral information loss. Thus, the convolutional layers produced 256, 512, and 1024 feature maps, respectively, increasingly improving the richness of the spectral information. After the last convolution, the MS-CNN model applied global maxpooling to extract 1024 features that correspond to the 1024 feature maps.
shows that to input the most important information of the patches to SAR-CNN, a maxpooling operation was performed between two successive convolutional stages to reduce the number of features for further efficient processing. All the maxpooling was defined using a pooling size of 3 × 3 with a stride of 2. The first convolutional layer had a kernel of 7 × 7 to generate 128 feature maps, while the second and third convolutional layers had a kernel of 3 × 3 to generate 256 and 512 feature maps, respectively. After the final convolutional operation, a global maxpooling was utilized to extract 512 features related to the 512 feature maps. The MS-CNN and SAR-CNN models extracted a total of 1536 features, which were merged using concatenation. These features were then fully connected to the SoftMax classifier to perform the final LULC classification. The SoftMax layer produced the probability distribution for the labels of each LULC type, where the model weights were assigned using backpropagation.
For MultiSenCNN, a linear filter and a Rectifier Linear Unit (ReLU) are associated with each convolution to induce the non-linearity and a batch normalization step, thus simplifying the problem and accelerating the network model training (Nair and Hinton Citation2010; Ioffe and Szegedy Citation2015). The reason for choosing the ReLU activation function is that it can guarantee good convergence and provide low computational complexity. The ReLU can be defined as:
(1)
(1)
where x is the input feature vector, W is the weight vector, b is the learned bias.
Considering the different scales and sensor bands input to MS-CNN and SAR-CNN, the cost function in MultiSenCNN was defined as:
(2)
(2)
where
(3)
(3)
where
is the true value of the LULC type label; f is the feature from SAR and MS. The cost function was modelled through cross-entropy, a typical choice for supervised classification of multiple LULC types (Ienco et al. Citation2017).
2.5. Methods for comparison
To validate the accuracy of MultiSenCNN, we compared it with the support vector machine (SVM) supervised classifier regarding LULC classification. In view of flood inundation mapping, we compared MultiSenCNN with the OTSU thresholding algorithm and the SVM method.
2.5.1. SVM classifier
SVM is a supervised classifier and image processing method based on statistical learning theory, which has been successfully applied to, for example, LULC classification, flooded area extraction and geographic simulation (Huang and Zhao Citation2018; Lamine et al. Citation2018). SVM provides the best separation between two classes in multidimensional feature space by fitting a separation hyperplane, which is the decision surface capable of resulting in the best class separation (Petropoulos et al. Citation2012). Suppose a set of training data with k samples can be expressed as (Xi, Yi) with i = 1,…k, where Xi∈Rn is an n-dimensional vector and Y∈{1,−1} denotes the label of each class, the optimization problem to be solved by SVM can be given by (Karan and Samadder Citation2016):
(4)
(4)
where W and b denote the normal vector and intercept of the hyperplane, respectively;
denotes the slack variables; the constant C is the regularization coefficient.
To project nonlinear data into a higher dimensional space to generate hyperplanes that can be linearly separated, a projection function Φ needs to be applied to represent the input data, which transforms the input vector x in the feature space into an n-dimensional construction space. The increase of n leads to an increase in the computational load, thus this is addressed by the kernel function (Szuster et al. Citation2011):
(4)
(4)
where
and
represent two low-dimensional vectors;
is the kernel function. This function allows projecting the training data into a larger space where it is increasingly possible to find a superior separation margin for the optimal separation hyperplane.
In this study of multiple LULC classification, the SVM classifier outputs an optimal hyperplane for each LULC type by learning a training sample of the given markers in the SAR and MS images. This optimal hyperplane is then used to classify the images and finally generate a LULC map.
2.5.2. OTSU thresholding algorithm
OTSU is an algorithm for binarizing or segmenting an image by maximizing the variance between the grayscale levels of the segmented object and the background parts to determine the optimal threshold (Otsu Citation1979). Assuming that there is a threshold Th to divide all pixels of the image into two types C1 (smaller than Th) and C2 (greater than Th), the averages of the two types are, respectively, m1 and m2, and the global average of the image is mG. The pixels are classified into classes C1 and C2 with probabilities P1 and P2, respectively. Thus, there are:
(5)
(5)
where P1 and P2 are given by:
(6)
(6)
where k is the grayscale levels. The between-class variance expression is:
(7)
(7)
When the variance reaches its maximum, the corresponding grayscale level k is the final OTSU algorithm Th. In this study, the OTSU algorithm was performed on the difference map between the pre-typhoon and post-typhoon SAR (DSAR) images to generate the flood extent map.
3. Results
3.1. Multiple LULC mapping in Lihai
To produce the LULC maps, we defined the patch size as 5 for the MS image and 10 for the SAR images because the spatial resolution of MS is twice coarser than that of SAR. The learning rate, batch_size and the epoch were, respectively, assigned as 0.0001, 128, and 50 to learn the deep features through backpropagation. We run the MultiSenCNN model 10 times to evaluate its stability and the result of the 10th iteration was considered the outcome. For comparison, we applied sample sets of three strategies: (1) MS + SAR7/3, where the model was trained using 70% samples and validated using the remaining 30% samples; (2) MS + SAR3/7, where the model was trained using the 30% samples and validated using the 70% samples as defined in Strategy-1; (3) MS + Pan, where the model was performed using the same samples as Strategy-1. In the fourth experiment, we also compared the performance of the MultiSenCNN models and SVM in LULC mapping (Petropoulos et al. Citation2012; Lamine et al. Citation2018), where we used the same sample set in SVM as in strategy-1.
shows that the overall patterns of LULC produced by the four experiments are highly similar, but differences exist in local areas. The LULC maps display that the croplands are mainly located in the east and west of Linhai, while the urban lands are mainly located in the middle areas. The agricultural lands are relatively fragmented and some of which are scattered over large areas of woodland, reducing the integrity of the woodland. Most of the water bodies are composed of the Lingjiang river, which passes through the middle of Linhai city. When comparing MultiSenCNN with SVM, we found that the LULC patterns generated by SVM are relatively fragmented and the forested and urban lands in MultiSenCNN are more aggregated. The comparison of the enlarged area shows that the urban lands by MS + Pan are fewer than those of the MS + SAR results, which are different from the urban areas classified by the optical image. Additionally, the urban patterns generated by both MS + SAR and optical image share high similarities, whereas the urban pattern generated by MS + Pan is quite different.
Figure 5. Four LULC maps with an enlarged area to show more details for the three strategies using MultiSenCNN.
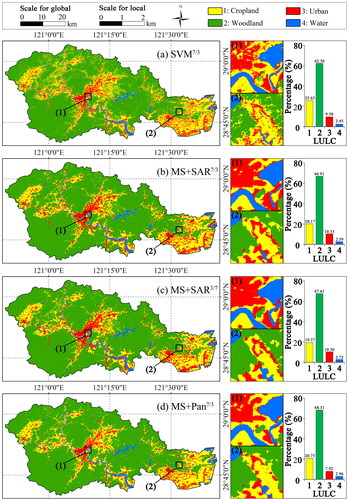
For evaluating the performance of the MultiSenCNN and SVM models, we used five metrics including overall accuracy (OA), Kappa, precision, recall, and F1-score. summarizes the accuracy of the three strategies in Linhai, demonstrating the very high accuracy achieved by MultiSenCNN compared to conventional classification methods. SVM produced 95.12% of OA and 0.93 of Kappa, while MultiSenCNN (strategy-1) achieved accuracy improvements with 3.74% of OA and 5% of Kappa. This indicates that MultiSenCNN can generate more accurate LULC maps than SVM. The MS + SAR7/3 and MS + Pan7/3 strategies, respectively, yield an OA of 98.86% and 98.47%, while the MS + SAR3/7 has achieved slight improvements with 0.26% and 0.65% compared to the former two strategies. For the other four metrics, MS + SAR3/7 yielded the highest accuracy while the other two strategies showed only very minor differences.
Table 3. Land use classification assessment of MultiSenCNN for the three strategies in Linhai.
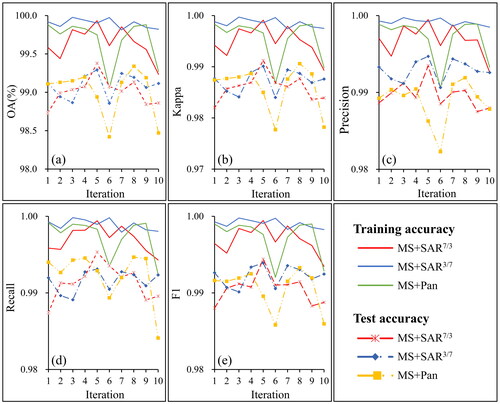
shows that, with the iteration of the classifiers, the three strategies performed on MultiSenCNN display similar trends in accuracies and errors. Compared with the other two strategies, MS + SAR7/3 yielded smaller accuracy changes, with a standard deviation of 0.06% in OA and 0.0008 in Kappa in the training stage, and 0.16% in OA and 0.002 in Kappa in the test stage. For the classifications using the same training and test samples, the standard deviation of MS + SAR7/3 was lower than that of MS + Pan7/3, indicating greater stability of the former method. Besides, all three strategies generated the lowest accuracy at the sixth iteration, which could be because more training samples could lead to a decrease in the network performance of MultiSenCNN. Overall, MS + SAR3/7 produced the highest accuracy in the classification by using fewer training samples. The two MS + SAR strategies produced more stable classifications compared with the MS + Pan7/3 strategy, suggesting that the SAR images could replace the Pan images to integrate with the MS images for LULC mapping.
Figure 6. The accuracy of the LULC classification varies with the iteration of the algorithms.
3.2. Flood inundation mapping results
For flood inundation mapping, the pre-typhoon and post-typhoon SAR images (PSAR) were input into MS-CNN while the DSAR was input into SAR-CNN. The patch sizes of the PSAR and DSAR images were both 5, for the same as their spatial resolution. For MS-CNN and SAR-CNN, the other parameters were defined in the same way as for LULC classification, i.e. learning rate, batch_size, and epoch were specified as 0.0001, 128, and 50, respectively. To demonstrate the capability of MultiSenCNN in flood mapping, we compared it with the OTSU algorithm and the SVM classifier, where OTSU has been used for cell images, oil spill, and flood pixels detection (Xu et al. Citation2011; Yu et al. Citation2017). shows the classified flood inundation pattern that is very similar to that of the difference map (), indicating that the three methods had similar performance in identifying flood areas. The differences exist in localized areas as shown in the enlarged areas (–a4)). There are significantly more small regions in the flooding results generated by OTSU and SVM than by MultiSenCNN, indicating that MultiSenCNN can well eliminate the effect of vegetation water content on flooding identification. Compared with the other two results, OTSU identified the least flooded areas in the enlarged area-4. The MultiSenCNN identified the flood inundated areas caused by Lekima in Aug 2019 were about 101 km2, mainly distributed in the west and east of the Linhai city centre. About half of the flooded areas were located along rivers, indicating the limited drainage capacity of Linhai and the great severity of the typhoon disaster. Although the identified flood areas by MultiSenCNN well match the pattern displayed in the SAR images, a few minor areas were missed because of the effects of the heavy rainfall.
Figure 7. The difference map of the pre-typhoon and post-typhoon SAR images (a), and the classified flood inundation pattern (b–d).
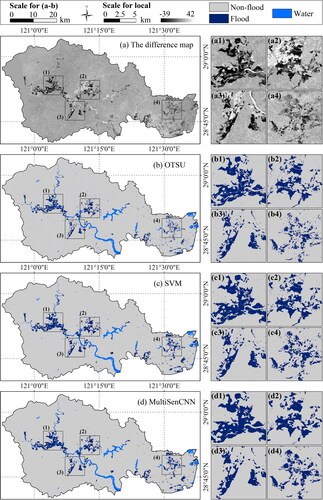
shows that in identifying floods, OTSU produced 94.05% of OA and 0.88 of Kappa; the accuracy using SVM increased by about 2.2% of OA and 4% of Kappa, which implies that the supervised classification method can well identify flood inundation extent than the thresholding method. Compared to these two methods, MultiSenCNN produced the highest OA (97.22) and Kappa (0.94), indicating its superior ability in flood mapping.
Table 4. Results of the flood identification assessment using the three methods.
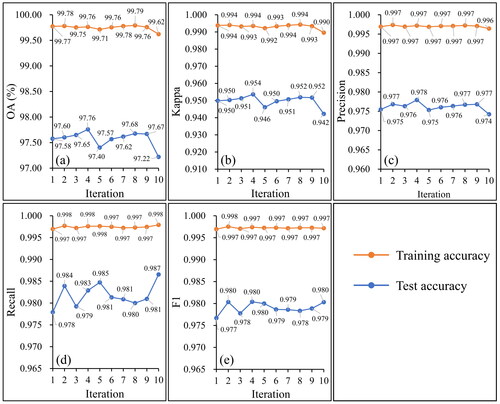
To examine the stability of MultiSenCNN for flood identifications, the training and test samples were utilized to calculate the accuracy metrics. The results show that the flood identifications yielded 99.75% of OA and 0.99 of Kappa while the other three metrics all exceed 0.99, showing a superior ability of MultiSenCNN in the training stage. The accuracies using the test samples decreased by about 2% for OA, precision, recall and F1-score, and 4% for Kappa. Although the accuracies related to the test samples are lower, they are still high enough to demonstrate the credibility of flood classifications. As flood identification progressed, the accuracies remain stable with the maximum standard deviation of only 0.16% for OA and 0.003 for Kappa (). This suggests that the flood inundation extent can well be identified by the proposed method with high accuracy.
Figure 8. The accuracy of the flood identification varies with the iteration of the algorithms.
3.3. Flood-caused land loss assessment
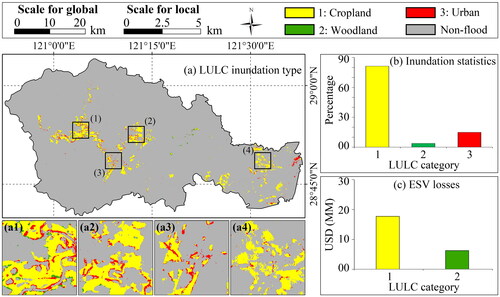
For assessing the land loss due to flooding, we overlaid the identified flood areas on the LULC map produced from the MS + SAR images. shows that the largest amount of LULC type inundated by the flooding was cropland (81.32%), followed by urbanized land (14.91%) and woodland (3.77%). The inundated urban areas were about 14.90 km2 while those of the woodland were about 3.77 km2. The inundated areas are mainly found in the west and east of the Linhai city centre. A digital elevation model of Linhai shows that the flood inundated areas are low-laying regions with an average altitude of about only 13 m. By drawing on earlier studies (Xie et al. Citation2017; Chen et al. Citation2020), we assessed the losses in ecosystem service values (ESVs) caused by the flooding. The ecosystems were classified into six primary services including farmland, forest, grassland, wetland, barren land, and water area (Xie et al. Citation2017). In our work, the inundated LULC types include cropland (farmland), woodland (forest), and urban, thus the ESV losses were mainly induced by cropland and woodland. The unit equivalent coefficients of the primary service were determined by the average of the secondary ecosystems. The ESV losses were estimated at ∼20.10 MM USD, where the largest losses were attributed to cropland (∼16.32 MM USD). The loss assessment reveals that typhoon Lekima caused a large amount of inundated cropland, and this finding may provide useful instructions for local government and agricultural administrations to regulate measures to prevent disasters and reduce agricultural losses.
Figure 9. The inundation pattern related to the three LULC types and the corresponding statistics of ESV.
We further analysed the rainfall in Linhai during typhoon Lekima, 2019. The rainfall data of Linhai from 5 to August 13 was downloaded from the Copernicus Climate Data Store (https://cds.climate.copernicus.eu) with a temporal resolution of hours. We used the cumulative rainfall of 24 h as the total rainfall, and shows the summary statistics of the daily average rainfall for the 9 days. shows that the heavy rainfall mainly occurred on 8–10 August and covered the entire Linhai. The maximum rainfall reached 193 mm/day on 9 August, which has brought severe challenges to the drainage system of Linhai. shows the flow direction of rainfall, which suggests that the rainwater could likely collect in the east, middle, or west. The stagnant water in the central and western parts was drained through the Lingjiang River. However, the width of Lingjiang gradually increases from west to east, meaning that the stagnant water in the central and western regions caused by heavy rainfall could not be drained in time. In addition, the high urbanization level in the central area of Linhai exacerbates the difficulty of drainage because of the large impervious surfaces and unobstructed sewers. The stagnant water in the east can be discharged in several ways (e.g. the agricultural canals) because the agricultural land of Linhai is mainly distributed in the east. However, the drainage capacity of agricultural canals is limited and it is difficult to timely emit the stagnant water caused by heavy rainfall. Overall, the heavy rainfall, the mountainous terrain, and the limitation of drainage conditions are the main causes of the flood inundation.
Figure 10. The rainfall patterns of 8–10 August 2019 in Linhai and the estimated flow directions.
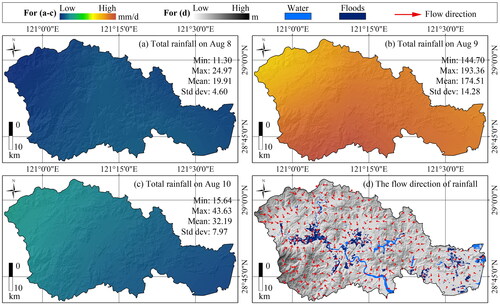
Table 5. The summary statistics of daily average rainfall in Linhai from 5 to 13 August 2019.
4. Discussion
4.1. The advantages of MultiSenCNN
LULC mapping and flood assessment are essential to provide references for territorial spatial planning and land use management. SAR sensors are powerful instruments due to their all-weather and all-time imaging capabilities, and can offer first responders and decision-makers the status of flood events at mesoscales in near real-time. We utilized deep learning methods (i.e. MultiSenCNN, branch-one: MS-CNN and branch-two: SAR-CNN) to disclose the LULC features in SAR and optical images for producing LULC patterns and assessing the flood inundation during typhoon Lekima coming in August 2019. The LULC mapping yielded an OA of 98.82% and a Kappa of 0.98, while the flood assessment yielded an OA of 97.22% and a Kappa of 0.94. The results demonstrated the performance of medium-resolution images in LULC and flood mapping using deep learning methods (i.e. MultiSenCNN in this study).
The MultiSenCNN deep learning structure encompasses feature classification and extraction from multisource images in a unified framework (Zhang et al. Citation2016). MultiSenCNN is composed of two branches (i.e. MS-CNN and SAR-CNN) that exploit MS and SAR features at their native resolutions to perform LULC classification at the pixel level (Gaetano et al. Citation2018). Unlike the CNN framework proposed by other publications (Bergado et al. Citation2018), MultiSenCNN provides an end-to-end solution for large-area LULC classification characterized by spatially sparse reference data. Different from widely used GAFnet (Liu et al. Citation2021), MultiSenCNN uses two CNN branches to implement up-sampling of the MS image to avoid discarding possible useful spectral information. To accelerate the learning processing, the convolution in MultiSenCNN was assigned as a kernel of 3 × 3 when dealing with the spectral and spatial information of large-scale MS and SAR images.
4.2. Performance in LULC and flood mapping
The MultiSenCNN model also showed great ability for SAR/optical image classification, and can extract discriminative features at different scales. In LULC classification, the MultiSenCNN model achieved an OA of 98-99% with a high Kappa of 0.98 under different sampling strategies, while the conventional SVM classifier produced a lower OA of 95.12% with a Kappa of 0.93. When using a small sample set (e.g. 0.39% for MS + SAR3/7), MultiSenCNN showed superior LULC classification ability with an OA of 99.12% and a precision of 0.99. For all three strategies, MultiSenCNN maintained stability in all 10 iterations of processing in LULC classification with a standard deviation of 0.31 for OA and 0.004 for Kappa. In our work, MS + SAR generated a higher accuracy than MS + Pan, showing that the fusion of SAR and optical images is an effective way for accurate LULC mapping in coastal areas.
Considering the strong cloud cover in typhoon weather, the radar data provide cost-effective ways for near real-time monitoring and mapping of floods (Tripathi et al. Citation2020). We utilized the pre-typhoon and post-typhoon SAR images at the dual-polarization as well as the difference map between them to implement the flood extent mapping using MultiSenCNN. The difference between the pre-typhoon and post-typhoon images was highlighted by SAR-CNN through learning the flood feature in the DSAR map. The flood identification results yielded an OA higher than 97% and an F1-score of about 0.98. Since the OA and Kappa produced by OTSU and SVM are lower than MultiSenCNN, it indicates that MultiSenCNN has a stronger capability to perform flood mapping.
4.3. Misclassification in LULC and flood mapping
There is also misclassification of LULC and missed identification of small zones in flood mapping. The reason for the misclassification could be that the SAR sensors use a slanted-range imaging model, resulting in severe geometric distortion of the SAR images (Xiang et al. Citation2022). The widely distributed SAR geometric distortion introduces errors regarding the identification of LULC types, such as the identification of shadows as built-up areas (Sun et al. Citation2021). Topographic corrections can minimize geometric distortions such as foreshortening and spreading effects, but do not eliminate them completely (Steinhausen et al. Citation2018). In addition, in the northwest, layover and shadowing caused by mountains on either side of the river may affect the imaging of the river in SAR images, leading to the river being misclassified as urban.
There may be two reasons for the loss of small zones in the flood mapping results. The first reason is the speckle filtering in the SAR image pre-processing, because the speckle filtering smooths the SAR image (Chen Citation2020), which leads to the missing of small zones of flooding. Another reason is the use of maxpooling operation between two successive convolution stages of SAR-CNN, which also reduces the flooding features in the difference map (Verdhan Citation2021). In addition, the patch size disrupted the structure of the small flooding zones, which further contributed to the miss identifications. To improve the flood identification accuracy, we used the difference map to eliminate the shadows and used the LULC maps as prior references to remove the negative effects of the river's confusing backscattering (Martinis and Rieke Citation2015). Owing to the unavailability of useful optical images for the flood event, we could not able to use multi-sensor imagery to verify the flooding range like other studies (Tong et al. Citation2018; Grimaldi et al. Citation2020). However, the selected verification samples are strictly covered by the possible flooding areas, thus they are valid to test the flood identification results.
For our case study in Linhai, the flood damage assessment illustrated high inundation in croplands, moderate inundation in urban lands, and low inundation in woodlands. Although the inundation in the urban areas was not the highest (about only 15 km2), the risks were much greater because of the high density of population and economy in these areas. In addition, the croplands (82 km2) were largely affected by the inundation that destroyed many of the nearly mature crops in August 2019 in the fields, leading to serious economic losses (ESV losses at 16.32 MM USD). Overall, this is a study that uses SAR and optical images to produce maps of LULC and flood extent through deep learning methods. The work can improve our understanding of flood events and their effects in coastal areas when the typhoon occurring, and can provide related information on flood status for rescuers and governments to make timely decisions. In coastal areas, a combination of SAR and optical imagery allows time-series monitoring of LULC, and the use of pre- and post-typhoon SAR images allows monitoring of the status of flooding events and informs planners and decision makers for sustainable coastal development, thereby reducing the loss of economically valuable land and ESV from marine hazards.
5. Conclusions
Identification of flooding caused by typhoons through remote sensing analysis can identify its impact on LULC and related properties, thus giving useful suggestions for policy regulation in coastal areas. In this work, we assessed flood damage by considering LULC and inundation maps derived from multisource remote sensing images. Highlights of this work include (1) the MultiSenCNN model was utilized to produce maps of multiple LULC and flooding in Linhai, Southeast China; (2) different images were used to compare their ability to identify different LULC types; (3) the loss of economically valuable land and ESV due to floods was examined and the causes of floods were analysed. The results show that the MultiSenCNN model yielded average OA and Kappa that are 3.7% and 5% higher than those of the SVM classifier, respectively. The OA of MS + SAR7/3 classification was 0.4% higher than MS + Pan classification when using the same samples. Flood classification using the MultiSenCNN model outperformed OTSU and SVM with an OA of 97.22% and a Kappa of 0.94. Cropland is the main inundated LULC type, causing $16.32 million in ESV losses, while heavy rainfall and limited drainage capacity are the main causes of flooding. To address the impacts caused by typhoons, this study provides a useful application of deep learning methods in mapping LULC and flooding using SAR and optical images.
When SAR images combined with optical images are used for LULC classification, severe image distortion at the edge of the satellite SAR sensor can lead to misclassification. The low temporal resolution of SAR satellite imagery does not allow for all-day monitoring of floods and suffers from coherent speckling, which may lead to misclassification of flood zones. The smaller imaging range of the airborne SAR sensor allows for reduced distortion and full-link near real-time monitoring of flood conditions in severe weather. Future work should integrate satellite and airborne SAR images to monitor LULC change and flood change, and reduce speckle noise in SAR images to improve the accuracy of land use and flood mapping.
Disclosure statement
No potential conflict of interest was reported by the authors.
Additional information
Funding
References
- Abdel-Hamid A, Dubovyk O, Graw V, Greve K. 2020. Assessing the impact of drought stress on grasslands using multi-temporal sar data of sentinel-1: a case study in Eastern Cape, South Africa. Eur J Remote Sens. 53(sup2):3–16.
- Adeli S, Salehi B, Mahdianpari M, Quackenbush LJ, Chapman B. 2021. Moving toward l-band NASA-ISRO SAR mission (NISAR) dense time series: multipolarization object-based classification of wetlands using two machine learning algorithms. Earth Space Sci. 8(11):e2021EA001742.
- Adrian J, Sagan V, Maimaitijiang M. 2021. Sentinel SAR-optical fusion for crop type mapping using deep learning and google earth engine. ISPRS J Photogramm Remote Sens. 175:215–235.
- Ahammed KB, Pandey AC. 2021. Characterization and impact assessment of super cyclonic storm Amphan in the Indian subcontinent through space borne observations. Ocean Coastal Manage. 205:105532.
- Amitrano D, Martino GD, Iodice A, Riccio D, Ruello G. 2018. Unsupervised rapid flood mapping using sentinel-1 GRD SAR images. IEEE Trans Geosci Remote Sens. 56(6):3290–3299.
- Bergado JR, Persello C, Stein A. 2018. Recurrent multiresolution convolutional networks for VHR image classification. IEEE Trans Geosci Remote Sens. 56(11):6361–6374.
- Bhatt CM, Gupta A, Roy A, Dalal P, Chauhan P. 2021. Geospatial analysis of September, 2019 floods in the lower Gangetic plains of Bihar using multi-temporal satellites and river gauge data. Geomat Nat Hazards Risk. 12(1):84–102.
- Carreño Conde F, De Mata Muñoz M. 2019. Flood monitoring based on the study of sentinel-1 SAR images: the Ebro river case study. Water-Sui. 11(12):2454.
- Chen S. 2020. Sar image speckle filtering with context covariance matrix formulation and similarity test. IEEE Trans Image Process. 29:6641–6654.
- Chen S, Feng Y, Tong X, Liu S, Xie H, Gao C, Lei Z. 2020. Modeling ESV losses caused by urban expansion using cellular automata and geographically weighted regression. Sci Total Environ. 712:136509.
- Cossu R, Schoepfer E, Bally P, Fusco L. 2009. Near real-time SAR-based processing to support flood monitoring. J Real-Time Image Proc. 4(3):205–218.
- Dellepiane SG, Angiati E. 2012. A new method for cross-normalization and multitemporal visualization of SAR images for the detection of flooded areas. IEEE Trans Geosci Remote Sens. 50(7):2765–2779.
- Eini-Zinab S, Maghsoudi Y, Sayedain SA. 2020. Assessing the performance of indicators resulting from three-component Freeman–Durden polarimetric SAR interferometry decomposition at p-and l-band in estimating tropical forest aboveground biomass. Int J Remote Sens. 41(2):433–454.
- Elkhrachy I. 2015. Flash flood hazard mapping using satellite images and GIS tools: a case study of Najran City, Kingdom of Saudi Arabia (KSA). Egypt J Remote Sens Space Sci. 18(2):261–278.
- Elkhrachy I. 2022. Flash flood water depth estimation using SAR images, digital elevation models, and machine learning algorithms. Remote Sens-Basel. 14(3):440.
- Elkhrachy I, Pham QB, Costache R, Mohajane M, Rahman KU, Shahabi H, Linh NTT, Anh DT. 2021. Sentinel‐1 remote sensing data and hydrologic engineering centres river analysis system two‐dimensional integration for flash flood detection and modelling in new Cairo City, Egypt. J Flood Risk Manag. 14(2):e12692.
- Feng Y, Wang J, Tong X, Shafizadeh-Moghadam H, Cai Z, Chen S, Lei Z, Gao C. 2019. Urban expansion simulation and scenario prediction using cellular automata: comparison between individual and multiple influencing factors. Environ Monit Assess. 191(5):1–20.
- Gaetano R, Ienco D, Ose K, Cresson R. 2018. A two-branch CNN architecture for land cover classification of pan and MS imagery. Remote Sens-Basel. 10(11):1746.
- Grimaldi S, Xu J, Li Y, Pauwels VRN, Walker JP. 2020. Flood mapping under vegetation using single SAR acquisitions. Remote Sens Environ. 237:111582.
- Hao C, Yunus AP, Siva Subramanian S, Avtar R. 2021. Basin-wide flood depth and exposure mapping from SAR images and machine learning models. J Environ Manage. 297:113367.
- Huang M, Jin S. 2020. Rapid flood mapping and evaluation with a supervised classifier and change detection in Shouguang using sentinel-1 sar and sentinel-2 optical data. Remote Sens-Basel. 12(13):2073.
- Huang Y, Zhao L. 2018. Review on landslide susceptibility mapping using support vector machines. Catena. 165:520–529.
- Hussein K, Alkaabi K, Ghebreyesus D, Liaqat MU, Sharif HO. 2020. Land use/land cover change along the eastern coast of the UAE and its impact on flooding risk. Geomat Nat Hazards Risk. 11(1):112–130.
- Ienco D, Gaetano R, Dupaquier C, Maurel P. 2017. Land cover classification via multitemporal spatial data by deep recurrent neural networks. IEEE Geosci Remote Sens Lett. 14(10):1685–1689.
- Ioffe S, Szegedy C. 2015. Batch normalization: accelerating deep network training by reducing internal covariate shifted. International Conference on Machine Learning PMLR. p. 448–456.
- Karan SK, Samadder SR. 2016. Accuracy of land use change detection using support vector machine and maximum likelihood techniques for open-cast coal mining areas. Environ Monit Assess. 188(8):1–13.
- Kocaman S, Tavus B, Nefeslioglu HA, Karakas G, Gokceoglu C. 2020. Evaluation of floods and landslides triggered by a meteorological catastrophe (Ordu, Turkey, August 2018) using optical and radar data. Geofluids. 2020:1–18.
- Kotaridis I, Lazaridou M. 2021. Integrating object-based image analysis and geographic information systems for waterbodies delineation on synthetic aperture radar data. Geocarto Int. 1–16.
- Kussul N, Shelestov A, Skakun S. 2011. Flood monitoring from SAR data. In: Use of satellite and in-situ data to improve sustainability. Dordrecht: Springer,p. 19–29.
- Lamine S, Petropoulos GP, Singh SK, Szabó S, Bachari NEI, Srivastava PK, Suman S. 2018. Quantifying land use/land cover spatio-temporal landscape pattern dynamics from hyperion using SVMS classifier and Fragstats. Geocarto Int. 33(8):862–878.
- Lee J-S, Pottier E. 2017. Polarimetric radar imaging: from basics to applications. Boca Raton: CRC Press.
- Li Y, Martinis S, Plank S, Ludwig R. 2018. An automatic change detection approach for rapid flood mapping in sentinel-1 SAR data. Int J Appl Earth Obs Geoinf. 73:123–135.
- Li Y, Zhang Y, Chen J, Zhang H. 2014. Improved compact polarimetric SAR quad-pol reconstruction algorithm for oil spill detection. IEEE Geosci Remote Sens Lett. 11(6):1139–1142.
- Liu S, Zhao H, Du Q, Bruzzone L, Samat A, Tong X. 2022. Novel cross-resolution feature-level fusion for joint classification of multispectral and panchromatic remote sensing images. IEEE Trans Geosci Remote Sens. 60:1–14.
- Liu X, Li L, Liu F, Hou B, Yang S, Jiao L. 2021. Gafnet: group attention fusion network for pan and ms image high-resolution classification. IEEE Trans Cybern. 99:1–14.
- Martinis S, Rieke CJRS. 2015. Backscatter analysis using multi-temporal and multi-frequency Sar data in the context of flood mapping at river Saale, Germany. Remote Sens-Basel. 7(6):7732–7752.
- Modrick TM, Georgakakos KP. 2015. The character and causes of flash flood occurrence changes in mountainous small basins of southern California under projected climatic change. J Hydrol: Reg Stud. 3:312–336.
- Mondini AC. 2021. Sar amplitude exploitation for systematic landslide failure detectioned. 2021 IEEE International Geoscience and Remote Sensing Symposium IGARSS, pp. 1800–1803.
- Moreira A, Prats-Iraola P, Younis M, Krieger G, Hajnsek I, Papathanassiou KP. 2013. A tutorial on synthetic aperture radar. IEEE Geosci Remote Sens Mag. 1(1):6–43.
- Nair V, Hinton GE. 2010. Rectified linear units improve restricted Boltzmann machinesed. In Proceedings of the 27th International Conference on Machine Learning, Haifa, Israel; 807–814.
- Orlíková L, Horák J. 2019. Land cover classification using sentinel-1 sar dataed. 2019 International Conference on Military Technologies (ICMT); pp. 1–5.
- Otsu N. 1979. A threshold selection method from gray-level histograms. IEEE Trans Syst Man Cybern. 9(1):62–66.
- Paoletti M, Haut J, Plaza J, Plaza A. 2019. Deep learning classifiers for hyperspectral imaging: a review. ISPRS J Photogramm Remote Sens. 158:279–317.
- Petropoulos GP, Kalaitzidis C, Prasad Vadrevu K. 2012. Support vector machines and object-based classification for obtaining land-use/cover cartography from hyperion hyperspectral imagery. Comput Geosci. 41:99–107.
- Ren B, Zhao Y, Hou B, Chanussot J, Jiao L. 2021. A mutual information-based self-supervised learning model for polsar land cover classification. IEEE Trans Geosci Remote Sens. 59(11):9224–9237.
- Salentinig A, Gamba P. 2015. Combining sar-based and multispectral-based extractions to map urban areas at multiple spatial resolutions. IEEE Geosci Remote Sens Mag. 3(3):100–112.
- Shakya A, Biswas M, Pal M. 2020. Cnn-based fusion and classification of SAR and optical data. Int J Remote Sens 41(22):8839–8861.
- Sica F, Pulella A, Nannini M, Pinheiro M, Rizzoli P. 2019. Repeat-PASS SAR interferometry for land cover classification: a methodology using sentinel-1 short-time-series. Remote Sens Environ. 232:111277.
- Steinhausen MJ, Wagner PD, Narasimhan B, Waske B. 2018. Combining sentinel-1 and sentinel-2 data for improved land use and land cover mapping of monsoon regions. Int J Appl Earth Obs Geoinf. 73:595–604.
- Sun Z, Li J, Liu P, Cao W, Yu T, Gu X. 2021. SAR image classification using greedy hierarchical learning with unsupervised stacked CAEs. IEEE Trans Geosci Remote Sens. 59(7):5721–5739.
- Shivaprasad Sharma SV, Roy PS, Chakravarthi V, Srinivasarao G, Bhanumurthy V. 2017. Extraction of detailed level flood hazard zones using multi-temporal historical satellite data-sets: a case study of Kopili River Basin, Assam, India. Geomat Nat Hazards Risk. 8(2):792–802.
- Szuster BW, Chen Q, Borger M. 2011. A comparison of classification techniques to support land cover and land use analysis in tropical coastal zones. Appl Geogr. 31(2):525–532.
- Tavus B, Can R, Kocaman S. 2022a. A CNN-based flood mapping approach using sentinel-1 data. ISPRS Ann Photogramm Remote Sens Spatial Inf Sci. V-3-2022:549–556.
- Tavus B, Kocaman S, Gokceoglu C. 2022b. Flood damage assessment with sentinel-1 and sentinel-2 data after Sardoba dam break with GLCM features and random forest method. Sci Total Environ. 816:151585.
- Tavus B, Kocaman S, Gokceoglu C, Nefeslioglu HA. 2018. Considerations on the use of sentinel-1 data in flood mapping in urban areas: Ankara (Turkey) 2018 floods. Int Arch Photogramm Remote Sens Spatial Inf Sci. XLII-5:575–581.
- Tavus B, Kocaman S, Nefeslioglu HA, Gokceoglu C. 2020. A fusion approach for flood mapping using sentinel-1 and sentinel-2 datasets. Int Arch Photogramm Remote Sens Spatial Inf Sci. XLIII-B3-2020:641–648.
- Tong X, Luo X, Liu S, Xie H, Chao W, Liu S, Liu S, Makhinov AN, Makhinova AF, Jiang Y. 2018. An approach for flood monitoring by the combined use of landsat 8 optical imagery and COSMO-SKYMED radar imagery. ISPRS J Photogramm Remote Sens. 136:144–153.
- Tripathi G, Pandey AC, Parida BR, Kumar A. 2020. Flood inundation mapping and impact assessment using multi-temporal optical and SAR satellite data: a case study of 2017 flood in Darbhanga District, Bihar, India. Water Resour Manage. 34(6):1871–1892.
- Tznews. 2021. In 70 years, 19 typhoons landed in taizhou, 10 of which were in wenling [online]. http://tznews.taizhou.com.cn/news/NewsDetails?newsId=137638.
- Vanama VSK, Rao YS. 2019. Change detection based flood mapping of 2015 flood event of Chennai city using sentinel-1 SAR Imagesed. IGARSS 2019-2019 IEEE International Geoscience and Remote Sensing Symposium IEEE; p. 9729–9732.
- Verdhan V. 2021. Image classification using Lenet. Computer vision using deep learning. Berkeley: Apress, p. 67–101.
- Wang J, Feng Y, Ye Z, Tong X, Wang R, Gao C, Chen S, Lei Z, Liu S, Jin Y. 2020. Simulating the effect of urban light rail transit on urban development by coupling cellular automata and conjugate gradients. Geocarto Int. 37:2346.
- Wang X, Zhang L, Wang N, Zou B. 2021. Joint polarimetric-adjacent features based on LCSR for polsar image classification. IEEE J Sel Top Appl Earth Observ Remote Sens. 14:6230–6243.
- Weiss M, Jacob F, Duveiller G. 2020. Remote sensing for agricultural applications: a meta-review. Remote Sens Environ. 236:111402.
- Xiang Y, Peng L, Wang F, Qiu X. 2022. Fast registration of multiview slant-range SAR images. IEEE Geosci Remote Sens Lett. 19:1–5.
- Xie G, Zhang C, Zhen L, Zhang L. 2017. Dynamic changes in the value of China’s ecosystem services. Ecosyst Serv. 26:146–154.
- Xu X, Xu S, Jin L, Song E. 2011. Characteristic analysis of OTSU threshold and its applications. Pattern Recognit Lett. 32(7):956–961.
- Yin J, Yin Z, Xu S. 2013. Composite risk assessment of typhoon-induced disaster for China’s coastal area. Nat Hazards. 69(3):1423–1434.
- Yu F, Sun W, Li J, Zhao Y, Zhang Y, Chen G. 2017. An improved OTSU method for oil spill detection from SAR images. Oceanologia. 59(3):311–317.
- Zhang L, Zhang L, Du B. 2016. Deep learning for remote sensing data: a technical tutorial on the state of the art. IEEE Geosci Remote Sens Mag. 4(2):22–40.
- Zhang Y, Fan G, He Y, Cao L. 2017. Risk assessment of typhoon disaster for the Yangtze river delta of China. Geomat Nat Hazards Risk. 8(2):1580–1591.