
 ?Mathematical formulae have been encoded as MathML and are displayed in this HTML version using MathJax in order to improve their display. Uncheck the box to turn MathJax off. This feature requires Javascript. Click on a formula to zoom.
Abstract
The optimized location and allocation of earthquake emergency shelters are critical for improving the resilience of communities. However, the existing disaster shelters location–allocation optimization models usually select new shelters from candidate shelters neglecting the existing or planned shelters. The research into comparisons before and after location–allocation optimization between the current planning scenario (CLA scenario) and the supplementary new candidate shelter scenario (SLA scenario) is thus imperative for disaster risk reduction. This article develops a multi-criteria multi-objective multi-scenario supplemental location–allocation optimization model that addresses the concerns related to optimization comparison based on the above two scenarios and provides a higher degree of realism by integrating multi-criteria evaluation and optimization comparison into location–allocation problems. The solutions obtained under the two scenarios are then compared with a case study in Huairou Science City. The results show that the solution under the SLA scenario is superior to the corresponding CLA scenario regardless of the minimal-distance scheme or the minimal-area scheme. The proposed model is proven to be useful for the location–allocation optimization of earthquake emergency shelters, and the presented results can be used as a reference for balancing the interests of the government and residents during the reconstruction and expansion projects of shelters.
1. Introduction
The frequency and severity of extreme weather events such as droughts, fires, storms, floods, heatwaves are increasing in a warming world (IPCC. Citation2021). According to the records of Emergency Events Data (EM-DAT), the period 2000–2019 compared with the period 1980–1999, climate-related disasters have nearly doubled (6,681 for 2000–2019 and 3,656 for 1980–1999), and the number of people affected has increased by nearly 700 million (UNDRR (UN Office for Disaster Risk Reduction)) Citation2020). However, the number of people killed by climate-related disasters is decreasing from 995,330 in the period 1980–1999 to 510,837 in the period 2000–2019. The decreased mortality could be attributed to the enhanced awareness of risk governance, as well as the improvement of various public service facilities (Shi Citation2012). As a kind of emergency service facility, disaster shelter plays an important role in reducing disaster risks and improving the communities' resilience (Ma et al. Citation2019; Zhao, Chen et al. Citation2019; Uddin and Matin Citation2021; He and Xie Citation2022). Hence, the research on disaster shelters specifically have drawn considerable attention in responding to the frequent natural disasters as well as their impacts on how society copes with emerging risks and recover from disasters.
Our study was undertaken for the Huairou Science City in Beijing, the capital city of China. The work seeks to gain insight into different schemes before and after location–allocation optimization between the current planning scenario (CLA scenario) and the supplementary new candidate shelter scenario (SLA scenario) based on multi-objective location–allocation optimization model and algorithm for disaster shelters. More specifically, the focus is on the incorporation of suitability evaluation (including safety, connectivity, accessibility and general suitability), and comparison of optimization results (including comparison of spatial allocation results and non-inferior solutions under CLA and SLA scenarios) into multi-objective location–allocation problems for earthquake emergency shelters.
The article is organized as follows. First, we review the relevant literature and provide the methods for selecting candidate shelters and evaluating all shelters, as well as methods for developing the location–allocation optimization model and algorithm. Next, to explore the practical usefulness and potential insights that might be derived from multi-objective optimization models, we applied this in a case study in Huairou Science City, Beijing, China. Sections 4.2 and 4.3 present the results as the suitability of disaster shelters and comparison of location–allocation optimization results. This is followed by a discussion on the verification of the results in Section 4.4 and the limitations of the study with regard to suitability evaluation method, evacuation means and influencing factors of evacuation needs in Section 5.
2. Literature review
The analysis of the site selection of disaster shelters is the focus and core of the disaster shelter research, which mainly includes the construction of the suitability evaluation model and the location–allocation optimization model (He and Xie Citation2022).
2.1. Suitability evaluation
A sound methodology to rank suitability of existing and candidate shelters (schools, colleges, open spaces, etc.) can greatly benefit emergency planners in disaster relief and mass care (Kar and Hodgson Citation2008; Anhorn and Khazai Citation2015). Consequently, quite a few researches on suitability evaluation have been carried out. Evaluation indicators and criteria selection may differ but generally include safety, accessibility, connectivity, etc. (Xu et al. Citation2007, Citation2008, Citation2014; Lee et al. Citation2008; Liu et al. Citation2011; Tsioulou et al. Citation2021). The relevant indicators are selected separately, and then related methods such as the analytical hierarchy process (AHP) (Chu and Su Citation2012; Tsioulou et al. Citation2021; Uddin and Matin Citation2021) and TOPSIS (Chu and Su Citation2012; Yao et al. Citation2021) are developed to comprehensively evaluate the suitability of existing shelters. However, suitability evaluation and location–allocation optimization of shelters are seldom examined as a whole, even though they are usually closely related tasks in disaster management (Yu et al. Citation2018).
2.2. Location–allocation optimization
The location–allocation optimization model can be divided into single-objective model and multi-objective model according to the objective types (Ma et al. Citation2019). A single-objective model is too simplified to effectively address the location–allocation problem for disaster shelters because it cannot cover all important objectives (Xu et al. Citation2018a). Consequently, the multi-objective location–allocation optimization model has attracted increasing attention for the planning of disaster shelters (Ma et al. Citation2019), which combine two or more objectives based on single-objective models to jointly determine the location of shelters and evacuation paths for residents, usually choosing to minimize evacuation distance or time, the number of open facilities, facility area or costs, disaster risks and other objectives (Boonmee et al. Citation2017; Shaw et al. Citation2022). The multi-objective model has been applied to earthquakes (Ghasemi et al. Citation2019; Ma et al. Citation2019), fires (Alçada-Almeida et al. Citation2009; Coutinho-Rodrigues et al. Citation2012), tsunamis (Doerner et al. Citation2009), hurricanes (Yushimito et al. Citation2012; Qin et al. Citation2020; Zhao et al. Citation2020), floods (Nolz et al. Citation2011; Rodríguez-Espíndola and Gaytán Citation2015) and other disaster types of shelter location–allocation optimization problems. The models are usually solved by genetic algorithm (Zhong et al. Citation2022), non-dominated sorting genetic algorithm (NSGA) (Hu et al. Citation2014), NSGA-II algorithm (Doerner et al. Citation2009; Saadatseresht et al. Citation2009; Nolz et al. Citation2011; Zhao and Chen Citation2015; Zhao et al. Citation2017; Seraji et al. Citation2021), non-dominated sorting genetic algorithm-cellular automata (NSGA-II-CA) (Guo et al. Citation2021), genetic algorithm-simulated annealing algorithm (GA-SA) (Haghi et al. Citation2017), multi-objective firefly algorithm (MOFA) (Gharib et al. Citation2022), modified particle swarm optimization algorithm (MPSO) (Bozorgi-Amiri et al. Citation2012; Samany et al. Citation2021), particle swarm optimization-simulated annealing algorithm (PSO-SA) (Zhao et al. Citation2015, Citation2017; Xu et al. Citation2018a, Citation2018b; Ma et al. Citation2019) and particle swarm optimization-simulated annealing-genetic algorithm (PSO-SA-GA) (Zhao et al. Citation2019), respectively. However, the above-mentioned single-objective model and multi-objective model usually select new shelters from candidate shelters, without considering the limitation of shelter resources and the objective reality of existing or planned shelters. Hence, the existing location–allocation optimization model is difficult to realize the effective allocation of disaster prevention resources and may even cause the waste of some resources. It is of great practical significance to carry out comparisons before and after location–allocation optimization between CLA scenario and SLA scenario in actual research, but this part of the work is very lacking.
This article therefore aims to develop a multi-criteria multi-objective multi-scenario supplemental location–allocation optimization model to compare CLA scenario and SLA scenario. This model highlights the importance of integrating multi-criteria evaluation and location–allocation optimization of earthquake emergency shelters. With the help of interleaved PSO-SA-GA, the outputs can additionally help to identify the strengths and weaknesses of different schemes before and after location–allocation optimization between CLA scenario and SLA scenario, hence the model can provide useful further information for planners and decision-makers concerned with the reconstruction and expansion projects of shelters.
3. Methods
3.1. Suitability evaluation method
In order to ensure the validity of the results, it is necessary to analyze and evaluate the suitability of planned shelters and candidate sites before the start of location–allocation optimization, so as to select candidate shelters and evaluate all shelters through scoring. In accordance with the planning principles of earthquake emergency shelters, three evaluation indicators were selected. The first is safety. Earthquake emergency shelters should be far away from dangerous zones such as fault zones and the slope should not be too high. The second is connectivity. Earthquake emergency shelters should be as close as possible to fire stations, hospitals, disaster supply warehouses, etc. The third is accessibility. The evacuation distance or time for residents to reach the corresponding emergency shelter should be as short as possible. In addition, land use that did not meet the requirements was eliminated accordingly. shows the suitability evaluation process of earthquake emergency shelters. The calculation of the suitability score is shown in EquationEquations (1)–(5).
(1)
(1)
where R is the suitability score of the evaluation unit as an earthquake emergency shelter, and Fk (k = 1, 2, 3) is the score of the kth factor that affects the rationality of the shelters. Candidate shelters with a safety score of 1 will be eliminated. The higher the R score, the more reasonable it is as an emergency shelter. The maximum score is 8, which means that the safety, connectivity and accessibility of the shelter are all very suitable.
(2)
(2)
where F1 is the comprehensive evaluation score of the safety of the shelter, and ai (i = 1, 2, ⋯n) is the single-factor score of the safety of a certain location. Score of 1 indicates that it is not safe as a shelter. Once a score of 1 is achieved, the corresponding candidate shelters should be eliminated. A score of 2 indicates medium safe, and a score of 3 indicates safe ().
(3)
(3)
where F2 is the comprehensive evaluation score of the connectivity of the shelter, and bi (i = 1, 2, ⋯m) is the single-factor score of the connectivity of a certain location. In the evaluation, the scores of each factor will be added together. A score of 1 or 0.5 indicates that the connectivity of the factor as a shelter is good, and a score of 0 indicates that the connectivity is poor. The specific scoring criteria are shown in .
(4)
(4)
(5)
(5)
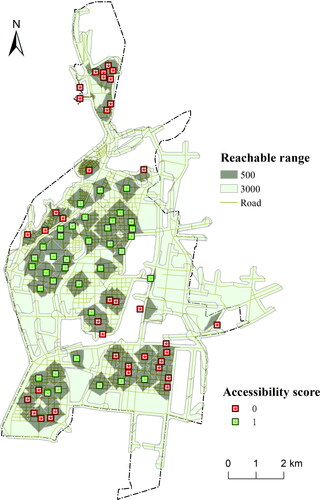
where F3 is the evaluation score of the accessibility of the shelter. σi is the coverage area ratio of shelter i, Med is the median of the coverage area ratio, Si is the coverage area of shelter i within its road evacuation reachable range of 3000 m as shown in , and S is the total area of the study area. A score of 1 indicates that the earthquake emergency shelter has high accessibility, and a score of 0 indicates that the earthquake emergency shelter has low accessibility.
Figure 1. Suitability evaluation process of earthquake emergency shelter.
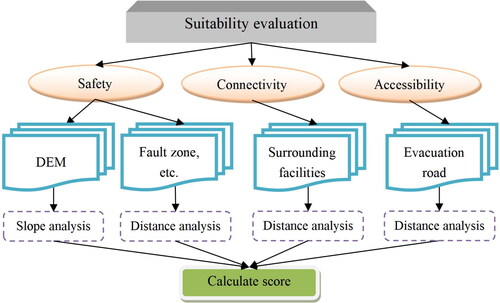
Table 1. Scoring criteria for safety evaluation of disaster shelters.
Table 2. Scoring criteria for connectivity evaluation of disaster shelters.
3.2. Location–allocation optimization model and algorithm
In order to compare CLA scenario and SLA scenario, a multi-objective multi-scenario supplemental location–allocation optimization model for temporary earthquake emergency shelters, with the objectives of minimizing the total shelter area and minimizing the total evacuation distance was developed as follows (EquationEquations (6)(6)
(6) and Equation(7)
(7)
(7) ).
(6)
(6)
(7)
(7)
The model is subject to constraints of shelter capacity and service distance (EquationEquations (8)(8)
(8) and Equation(9)
(9)
(9) ).
(8)
(8)
(9)
(9)
(10)
(10)
(11)
(11)
(12)
(12)
The sets, variables and parameter definitions in this model are as follows:
S is the set of scenarios: S = {CLA, SLA}; is the set of earthquake emergency shelters in scenario s: I = {1, 2, … i, … N}, in our case, N = 57 in scenario CLA and N = 89 in scenario SLA; J is the set of demand points: J = {1,2, … j, … M};
is the area of earthquake emergency shelter i in scenario s;
is the length of the shortest path between demand point j and shelter i in scenario s; Nj is the number of evacuees in demand point j; L is the smallest refuge area per capita (1 m2/person); Dj is the maximal evacuation distance for evacuees in demand point j, which is set to 3 km to ensure that it can be reached within 1 h on foot.
EquationEquation (6)(6)
(6) is used to calculate the minimum value of the total shelter area, and EquationEquation (7)
(7)
(7) is used to calculate the minimum value of the total evacuation distance. EquationEquation (8)
(8)
(8) is the capacity constraint to ensure that the areas of the shelters satisfy the demand of the evacuees in the surrounding blocks, and EquationEquation (9)
(9)
(9) is the distance constraint, which guarantees the distance from the demand point to the selected shelter is less than the maximum evacuation distance. EquationEquation (10)
(10)
(10) ensures that only one shelter is selected per demand. EquationEquations (11)
(11)
(11) and Equation(12)
(12)
(12) define the decision variables in the model.
The original PSO algorithm, which is characterized by fast convergence, high effectiveness and strong robustness, has become an important tool in solving facility location–allocation problem (Bozorgi-Amiri et al. Citation2012). In addition, as artificial intelligence algorithms, GA and SA algorithm also has been widely used in addressing location–allocation issue (Haghi et al. Citation2017). To solve the complex and discrete optimization problem for earthquake emergency shelters more effectively, an interleaved PSO-SA-GA was developed (Zhao et al. Citation2019). First, the SA algorithm is used as a local search for each particle’s individual optimum and local optimum by combining PSO and SA. Then, the algorithm continuously interleaves the execution of the PSO-SA algorithm and the GA algorithm until the convergence of the Pareto sets is met simultaneously by both algorithms. In this study, the interleaved PSO-SA-GA was used to solve the multi-objective model for earthquake emergency shelter location–allocation problem in the CLA scenario and the SLA scenario.
4. Case study in Huairou Science City, Beijing
4.1. Study area and data
4.1.1. Study area
Huairou Science City (HSC), covering an area of 68.4 square kilometers, is located in the northeast of Beijing (). As a Key National Science Centre in Beijing, this region is affected by the Huangzhuang-Gaoliying seismic fault zone (). In addition, there are some industrial parks in this region, which contain liquid ammonia and other hazardous materials. Therefore, the region is threatened by multiple hazards.
Figure 2. Huairou Science City, Beijing.
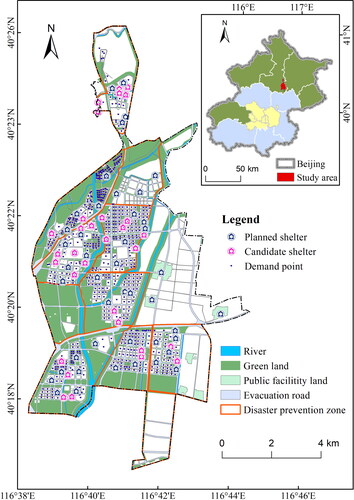
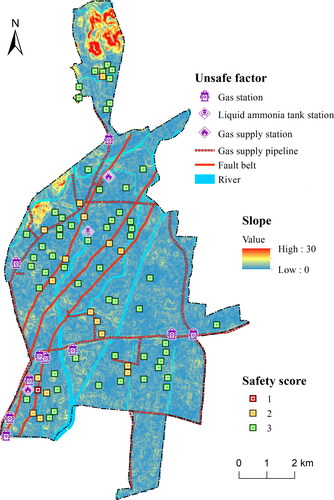
Figure 3. Safety of emergency shelters.
4.1.2. Data
The research data in this paper mainly include the hazard identification data, seismic fault zone distribution data, surrounding supporting facilities data, disaster prevention zones and the number of evacuees, earthquake emergency shelter data, and evacuation road data. The first three types of data are mainly used for the suitability evaluation of earthquake emergency shelters, and the latter three are mainly used for the location–allocation optimization of earthquake emergency shelters. The data details and sources are shown in .
Table 3. Data Sources.
Estimation of the number of evacuees
The resident population of 840 blocks in 11 disaster prevention zones is calculated with the area ratio as the weight, thus the evacuation demands of the disaster prevention zones are refined to the block scale (). The total population often exceeds the total amount of evacuees. If the total population is used as the base of evacuation demand to plan disaster shelters, it will inevitably lead to excessive planning and construction of shelters, resulting in a lot of waste of resources. The planning standard for earthquake emergency shelters in Beijing clearly requires that the size of evacuees should be set at 30% of the permanent population (Zhao et al. Citation2014). Therefore, the number of evacuees of each demand point is set to 30% of the resident population in this paper. The total number of evacuees was estimated at 62,700.
Earthquake emergency shelters
Planned shelters. A total of 44 parks, green spaces, schools and playgrounds are planned as earthquake emergency shelters within the study area (), covering a total area of 3.90 km2 and accommodating 173,400 persons. Candidate shelters. In accordance with the requirements of the earthquake emergency shelter (outdoor) program guidelines (OPG) for the central area of Beijing, 31 candidate shelters with an area of more than 2,000 square metres, covering a total area of 1.06 km2 and accommodating 265,400 people, were selected based on the planned land use types such as park green land, education land, sports land and cultural activity facility land (). According to OPG's recommendations, each shelter used in the model has a capacity of 60% of its total area, excluding surface water area.
Evacuation roads
Combined with the disaster relief evacuation passage plan in the study area, the disaster relief evacuation road was digitized by fully considering the distribution of internal block units as shown in .
4.2. Suitability evaluation results of earthquake emergency shelters
4.2.1. Safety evaluation
This article designs a safety evaluation criteria based on the topography and geo-hydrological conditions and danger sources around the emergency shelters. Most of the landslides occurred on slopes steeper than 15° (Liu et al. Citation2011), and the sites should keep away from seismic fault zones and flood hazards (breaking of river or reservoir dykes) (Chu and Su Citation2012). In addition, the emergency shelters close to danger sources may cause secondary disasters (Ji and Gao Citation2014). By analyzing the influence of geological conditions (including seismic fault zones, slopes, and rivers) and danger sources (including gas stations, gas supply pipelines, and liquid ammonia tanks) on the distribution of earthquake emergency shelters, unsafe candidate shelters are excluded, and a certain number of candidate shelters are selected. The safety of the distribution of planned shelters and the selected candidate shelters were evaluated based on the scoring criteria in and EquationEquation (2)(2)
(2) , and the evaluation results are shown in . Among the influencing factors, the most important factor affecting the safety of HSC is the seismic fault zone, followed by gas supply pipelines and rivers. Other unsafe factors do not affect the shelters. Specifically, among the 45 planned shelters, there is only one unsafe shelter (score of 1) with the evacuation site is less than 15 m away from the seismic fault zone. Most of the planned shelters (84.09%) have the highest safety score (3 points). In addition, 64.52% of the 31 candidate shelters have the highest safety score (3 points) excluding unsafe shelters that scored 1 point.
4.2.2. Connectivity evaluation
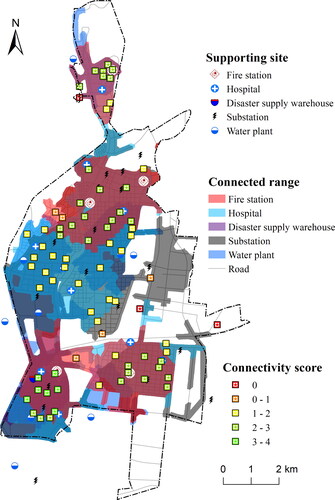
In order to analyze the connectivity between the earthquake emergency shelters and surrounding fire stations, hospitals, and disaster supply warehouses, etc., the road impedance model based on the Network Analysis-Service Area Analysis tool in ArcGIS was used to simulate the connectivity range of all emergency supporting facilities within a service area of 2000 m. In addition, the connectivity of the distribution of earthquake emergency shelters was evaluated in accordance with the scoring criteria in and EquationEquation (3)(3)
(3) , and the evaluation results are shown in . About 52.00% of shelters have high connectivity (score of 2–4), and 37.33% are moderately connected (score of 1–2). In terms of spatial distribution, the three shelters with poor connectivity (score of 0) are scattered, two are located outside the disaster prevention zone near farmland, and one is located in the bq disaster prevention zone in the north. The seven shelters with high connectivity (score of 3–4) are concentrated, all located in nq-01 disaster prevention zone, where various supporting facilities are complete.
Figure 4. Connectivity of emergency shelters.
4.2.3. Accessibility evaluation
To explore the accessibility of planned shelters and candidate shelters, the above-mentioned road impedance model based on ArcGIS was used to simulate the reachable range of all earthquake emergency shelters within two service areas of 500 m and 3000 m, and the accessibility of all shelters was evaluated according to EquationEquations (4)(4)
(4) and Equation(5)
(5)
(5) . The simulation results are shown in . On the whole, the earthquake emergency shelter can basically cover all construction land under the service radius of 3000 m. Due to the limitation of the extension of the road, almost all shelters with poor accessibility are located in the outer area of HSC. In contrast, most of the shelters located in the inner area of HSC are highly accessible due to good traffic conditions. A few shelters with poor accessibility are affected by natural geographic locations such as rivers and farmland.
Figure 5. Accessibility of emergency shelters.
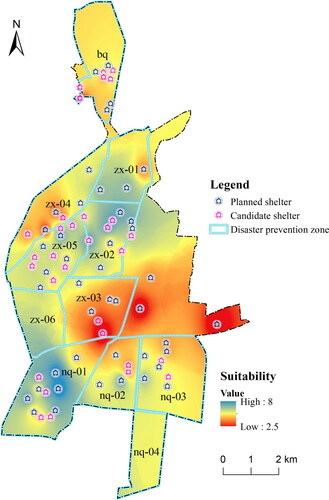
4.2.4. Suitability evaluation
On the basis of safety evaluation, connectivity evaluation and accessibility evaluation, the suitability scores of all shelters are calculated according to EquationEquation (1)(1)
(1) as shown in . The results show that the suitability of the 11 disaster prevention zones is relatively high. In addition, the suitability score of candidate shelters is generally superior to that of planned shelters, because unsafe sites have been eliminated during the process of selecting candidate shelters. In more detail, the suitability of all shelters in the study area is relatively high except for the two disaster prevention zones of zx-03 and zx-04. The zx-03 area is adjacent to farmland in the east and green space in the west with few supporting facilities. The zx-04 area is adjacent to the mountainous area in the northwest, with higher terrain and fewer supporting facilities.
Figure 6. Suitability of emergency shelters.
4.3. Comparison of optimization results under CLA and SLA scenarios
4.3.1. Comparison of spatial allocation results
There are three main reasons for the generation of cross lines on the spatial location–allocation maps: poor road connectivity, the existence of capacity constraints, and the cross result obtained is a non-inferior solution rather than an optimal solution. In the multi-objective programming, a non-inferior solution means that in the given set of alternative solutions, there is no solution that can improve each objective function. However, the set of non-inferior solutions produced by each run is often different, because the optimization algorithm is not good enough to get close to the optimal solution. So, the last one is often the main reason for the generation of cross lines (Xu et al. Citation2018a). As shown in , the spatial location–allocation results corresponding to the minimal-distance and minimal-area solutions of the multi-objective model in the CLA scenario and the SLA scenario do not produce a cross line. This result shows that the interleaved PSO-SA-GA is a promising method to solve the multi-objective location–allocation model based on the macro spatial allocation results. In addition, the allocation schemes with the smallest area and the shortest distance in the two scenarios have cross-regional evacuation, and the cross-regional evacuation in the SLA scenario has been alleviated.
Figure 7. Spatial location-allocation results corresponding to the minimal-distance (a, b) and minimal-area (c, d) solutions obtained using the multi-objective model for the CLA scenario (a, c) and the SLA scenario (b, d).
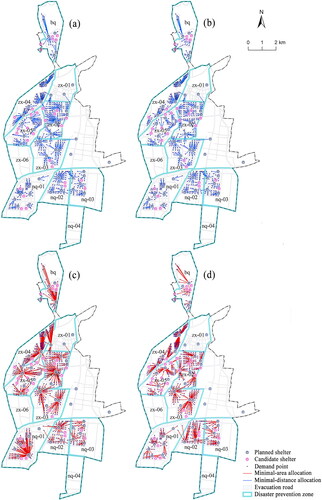
From the spatial allocation results of the minimal-distance solution ( and ), it can be seen that (1) in both scenarios, all demand points can be evacuated to their nearest shelters without exceeding the capacity limit of the shelters; (2) almost all planned shelters and candidate shelters in the disaster prevention zones under the two scenarios have been selected; (3) the layout of planned shelters in the nq-01 disaster prevention zone is more reasonable with the short spatial allocation line, that is, the per capita evacuation distance is shorter. The layout of planned shelters in the zx-02 disaster prevention zone is relatively poor, but there are suitable candidate shelters nearby. Therefore, the spatial allocation results under the SLA scenario have been significantly improved, which is manifested as the allocation line is significantly shortened.
From the spatial allocation results of the minimal-area solution ( and ), it can be seen that (1) the number of shelters selected by the demand points in the two scenarios is drastically reduced compared with the minimal-distance solution, and one of the shelters in some disaster prevention zones can satisfy all of the evacuation demand of the area; (2) due to the limitation of capacity constraints, the solution of the smallest area is more difficult than that of the shortest distance, and the optimization result of the CLA scenario is not the optimal solution, for example, the three shelters selected in the nq-02 disaster prevention zone in can be reduced to two in .
4.3.2. Comparison of non-inferior solutions
The associated non-inferior solutions obtained using the multi-objective model under different scenarios is shown in . We construct none capacity constraints scenario (NC scenario) as reference, and a capacity-constrained scenario (CC scenario) in the multi-objective model. Each feasible non-inferior solution is represented by one point in the figure and corresponds to a particular spatial location–allocation result. The four spatial location–allocation schemes in correspond to the four points at the beginning and the end of the scatter diagram in the CLA CC scenario and the SLA CC scenario in . presents a further comparison of the solutions of minimal-distance and minimal-area schemes corresponding to the four scenarios in .
Figure 8. Non-inferior solutions for all schemes under different scenarios.
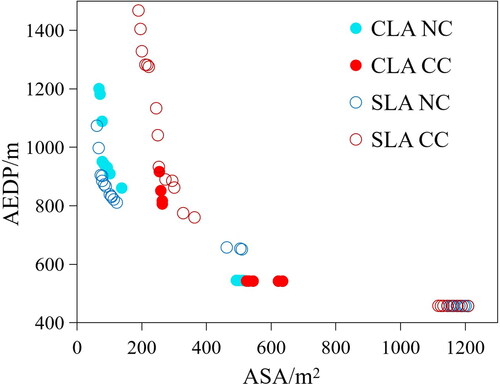
Table 4. Comparison of solutions of minimal-area and minimal-distance schemes for different scenarios.
It is worth noting that the solutions differ significantly between scenario NC and CC (blue and red scatter points in ), followed by scenario CLA and SLA (hollow and solid points of the same color). According to , the same minimal-distance scheme can be obtained regardless of the capacity constraint, but the capacity constraint greatly restricts the further optimization of the minimal-area scheme. In addition, the solution under the SLA scenario with or without capacity constraints is superior to the corresponding CLA scenario regardless of the minimal-distance scheme or the minimal-area scheme. For example, the average evacuation distance per person (AEDP) of the minimal-distance scheme in the CLA scenarios exceeds 500 m, and the corresponding value in the SLA scenario is 457, which can ensure that the evacuation time per person on foot is less than 10 minutes. In addition, the average shelter area (ASA) and the number of selected shelters (NSS) under the minimal-area scheme in the SLA scenarios are both greatly reduced, especially in scenario SLA CC.
4.4. Verification
shows the changes of the two objective function values (AEDP and ASA) of the multi-objective model with the number of iterations to further verify the correctness of the results. The changes in minimum, medium and maximum AEDP and ASA for evacuation schemes under the CLA NC, CLA CC, SLA NC and SLA CC scenarios are illustrated, respectively. For the high-dimensional complex problem of the actual case in this study, the algorithm converges to the optimal solution at about 20,000 times.
Figure 9. Variation of AEDP and ASA of multi-objective model with the number of iterations.
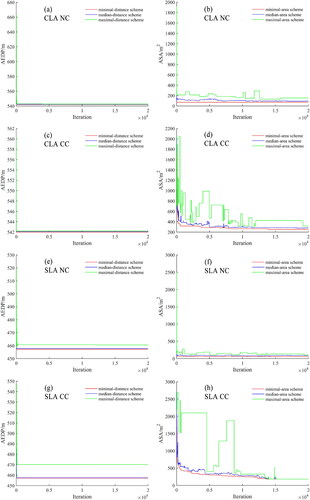
By comparing with , it can be seen that the AEDP value converges faster than the ASA value in any scenario, which further proved that the solution for the smallest area is more difficult than that of the shortest distance due to the limitation of capacity. By comparing the results with and without capacity constraints, it is found that the AEDP values are the same both in the CLA and SLA scenarios, while the ASA values are significantly different. In both CLA scenario and the SLA scenario, the ASA values converge more slowly in the case of scenario CC, which confirms that the capacity constraints greatly restrict the further optimization of the minimal-area scheme.
In addition, by comparing with , it can be found that the values in the latter four graphs are better than the former four, which further verifies that the solution under the SLA scenario with or without capacity constraints is superior to the corresponding CLA scenario regardless of the AEDP or the ASA.
5. Discussion and conclusion
This study developed a multi-criteria multi-objective multi-scenario supplemental location–allocation optimization model for earthquake emergency shelters that addresses the concerns related to optimization comparison based on the CLA and SLA scenarios. The developed model incorporates the suitability evaluation of planned shelters and candidate sites before the start of location–allocation optimization into the location–allocation problem for earthquake emergency shelters. With the help of interleaved PSO-SA-GA, the results of the model analysis can provide effective planning strategies for the reconstruction and expansion projects of shelters, and substantially increase resilience in communities confronted with potential environment risks and disasters.
However, this study came with several limitations. First, the safety, connectivity and accessibility indicators were simply added to evaluate the suitability of earthquake emergency shelters. The suitability evaluation method can be refined by using AHP and TOPSIS methods for determining weights of different indicators to derive a comprehensive suitability score in future research. In addition, due to the complexity of the location–allocation optimization of disaster shelters and the unavailability of relevant data, we also made some relevant assumptions in the construction of the model, e.g., it was assumed that the number of evacuees at each demand point was 30% of the resident population, and the evacuation method was set as foot evacuation, etc. However, in the actual process, these assumptions are difficult to meet, which increases the uncertainty of the model analysis results. Hence, in the future, it is necessary to carry out extensive research on the influencing factors of evacuation needs, including objective factors such as critical infrastructures damage affected by the earthquake (Ghasemi and Khalili-Damghani Citation2021) and daily dynamic changes of population (Xu et al. Citation2018a), as well as subjective factors such as willingness to evacuate to designated shelters (shelter evacuees) (Ma et al. Citation2019), non-shelter evacuees (Li et al. Citation2012), the residents' evacuation behaviours (Tai et al. Citation2010), the public-shelter users' satisfaction (Mayunga Citation2012; Kınay et al. Citation2018), government trust problems caused by rumours (Fraser et al. Citation2021), etc.
Data availability statement
Seismic data were collected from China Earthquake Administration. Hazard identification data, surrounding supporting facilities data, earthquake emergency shelter data and evacuation road data were collected from Emergency Management Bureau. Land use data were derived from Huairou Science City Planning and modified through field research. Derived data supporting the findings of this study are available from the corresponding author [B.L] on request.
Disclosure statement
No potential conflict of interest was reported by the authors.
Additional information
Funding
References
- Alçada-Almeida L, Tralhao L, Santos L, Coutinho Rodrigues J. 2009. A multiobjective approach to locate emergency shelters and identify evacuation routes in urban areas. Geogr Anal. 41(1):9–29.
- Anhorn J, Khazai B. 2015. Open space suitability analysis for emergency shelter after an earthquake. Nat Hazards Earth Syst Sci. 15(4):789–803. https://doi.org/10.5194/nhess-15-789-2015.
- Boonmee C, Arimura M, Asada T. 2017. Facility location optimization model for emergency humanitarian logistics. Int J Disaster Risk Reduct. 24:485–498. https://doi.org/10.1016/j.ijdrr.2017.01.017.
- Bozorgi-Amiri A, Jabalameli MS, Alinaghian M, Heydari M. 2012. A modified particle swarm optimization for disaster relief logistics under uncertain environment. Int J Adv Manuf Technol. 60(1–4):357–371. https://doi.org/10.1007/s00170-011-3596-8.
- Chu JY, Su YP. 2012. The application of TOPSIS method in selecting fixed seismic shelter for evacuation in cities. Syst Eng Procedia. 3:391–397.
- Coutinho-Rodrigues J, Tralhão L, Alçada-Almeida L. 2012. Solving a location-routing problem with a multiobjective approach: the design of urban evacuation plans. J Transp Geogr. 22:206–218. https://doi.org/10.1016/j.jtrangeo.2012.01.006.
- Doerner KF, Gutjahr WJ, Nolz PC. 2009. Multi-criteria location planning for public facilities in tsunami-prone coastal areas. Or Spectrum. 31(3):651–678. https://doi.org/10.1007/s00291-008-0126-7.
- Fraser T, Morikawa L, Aldrich DP. 2021. Rumor has it: The role of social ties and misinformation in evacuation to nearby shelters after disaster. Clim Risk Manag. 33:100320. https://doi.org/10.1016/j.crm.2021.100320.
- Gharib Z, Tavakkoli-Moghaddam R, Bozorgi-Amiri A, Yazdani M. 2022. Post-Disaster temporary shelters distribution after a large-scale disaster: an integrated model. Buildings. 12(4):414. https://doi.org/10.3390/buildings12040414.
- Ghasemi P, Khalili-Damghani K, Hafezalkotob A, Raissi S. 2019. Uncertain multi-objective multi-commodity multi-period multi-vehicle location–allocation model for earthquake evacuation planning. Appl Math Comput. 350:105–132. https://doi.org/10.1016/j.amc.2018.12.061.
- Ghasemi P, Khalili-Damghani K. 2021. A robust simulation-optimization approach for pre-disaster multi-period location–allocation–inventory planning. Math Comput Simulat. 179:69–95. https://doi.org/10.1016/j.matcom.2020.07.022.
- Guo J, Du Q, He ZG. 2021. A method to improve the resilience of multimodal transport network: Location selection strategy of emergency rescue facilities. Comput Ind Eng. 161:107678. https://doi.org/10.1016/j.cie.2021.107678.
- Haghi M, Ghomi SMTF, Jolai F. 2017. Developing a robust multi-objective model for pre/post disaster times under uncertainty in demand and resource. Appl Math Comput. 154:188–202. https://doi.org/10.1016/j.jclepro.2017.03.102.
- He L, Xie ZA. 2022. Optimization of urban shelter locations using bi-Level multi-objective location-allocation model. IJERPH. 19(7):4401. https://doi.org/10.3390/ijerph19074401.
- Hu FY, Yang SN, Xu W. 2014. A non-dominated sorting genetic algorithm for the location and districting planning of earthquake shelters. Int J Geogr Inf Sci. 28(7):1482–1501. https://doi.org/10.1080/13658816.2014.894638.
- IPCC. 2021. Climate Change 2021: the physical science basis. Contribution of working Group I to the sixth assessment report of the intergovernmental panel on climate change, Cambridge: Cambridge University Press.
- Ji J, Gao XL. 2014. Evaluation method and empirical study on service quality of seismic emergency shelters. Geographical Research. 33(11):2105–2114.
- Kar B, Hodgson ME. 2008. A GIS‐based model to determine site suitability of emergency evacuation shelters. Trans GIS. 12(2):227–248. https://doi.org/10.1111/j.1467-9671.2008.01097.x.
- Kınay ÖB, Kara BY, Saldanha-da-Gama F, Correia I. 2018. Modeling the shelter site location problem using chance constraints: a case study for Istanbul. Eur J Oper Res. 270(1):132–145.
- Lee Y, Ishii H, Tai C. 2008. Earthquake shelter location evaluation considering road structure. 2008 Eighth International Conference on Intelligent Systems Design and Applications. IEEE. 1: 495–497. https://doi.org/10.1109/ISDA.2008.204
- Li ACY, Nozick L, Xu N, Davidson R. 2012. Shelter location and transportation planning under hurricane conditions. Transp Res Pt e-Logist Transp Rev. 48(4):715–729.
- Liu Q, Ruan XJ, Shi PL. 2011. Selection of emergency shelter sites for seismic disasters in mountainous regions: Lessons from the 2008 Wenchuan Ms 8.0 Earthquake, China. J Asian Earth Sci. 40(4):926–934.
- Ma YJ, Xu W, Qin LJ, Zhao XJ, Du J. 2019. Emergency shelters location-allocation problem concerning uncertainty and limited resources: a multi-objective optimization with a case study in the Central area of Beijing, China. Geomatics Nat Hazards Risk. 10(1):1242–1266.
- Ma YJ, Xu W, Qin LJ, Zhao XJ. 2019. Site selection models in natural disaster shelters: a review. Sustainability. 11(2):399.
- Mayunga JS. 2012. Assessment of public shelter users’ satisfaction: Lessons learned from south-central Texas flood. Nat Hazards Rev. 13(1):82–87.
- Nolz PC, Semet F, Doerner KF. 2011. Risk approaches for delivering disaster relief supplies. Or Spectrum. 33(3):543–569. https://doi.org/10.1007/s00291-011-0258-z.
- Qin LJ, Xu W, Zhao XJ, Ma YJ. 2020. Typhoon track change-based emergency shelter location–allocation model: a case study of Wenchang in Hainan province, China. Inj Prev. 26(3):196–203.
- Rodríguez-Espíndola O, Gaytán J. 2015. Scenario-based preparedness plan for floods. Nat Hazards. 76(2):1241–1262. https://doi.org/10.1007/s11069-014-1544-2.
- Saadatseresht M, Mansourian A, Taleai M. 2009. Evacuation planning using multiobjective evolutionary optimization approach. Eur J Oper Res. 198(1):305–314.
- Samany NN, Sheybani M, Zlatanova S. 2021. Detection of safe areas in flood as emergency evacuation stations using modified particle swarm optimization with local search. Appl Soft Comput. 111:107681.
- Seraji H, Tavakkoli-Moghaddam R, Asian S, Kaur H. 2021. An integrative location–allocation model for humanitarian logistics with distributive injustice and dissatisfaction under uncertainty. Ann Oper Res. 6:1–47.
- Shaw L, Das SK, Roy SK. 2022. Location–allocation problem for resource distribution under uncertainty in disaster relief operations. Socio-Econ Plan Sci. 82:101232.
- Shi PJ. 2012. On the role of government in integrated disaster risk governance—Based on practices in China. Int J Disaster Risk Sci. 3(3):139–146. https://doi.org/10.1007/s13753-012-0014-2.
- Tai CA, Lee YL, Lin CY. 2010. Urban disaster prevention shelter location and evacuation behavior analysis. J Asian Archit Build Eng. 9(1):215–220.
- Tsioulou A, Faure Walker J, Lo DS, Yore R. 2021. A method for determining the suitability of schools as evacuation shelters and aid distribution hubs following disasters: case study from Cagayan de Oro, Philippines. Nat Hazards. 105(2):1835–1859.
- Uddin K, Matin MA. 2021. Potential flood hazard zonation and flood shelter suitability mapping for disaster risk mitigation in Bangladesh using geospatial technology. Prog Disaster Sci. 11:100185.
- UNDRR (UN Office for Disaster Risk Reduction). 2020. The human cost of disasters: an overview of the last 20 years 2000-2019. Geneva, Switzerland: UN Office for Disaster Risk Reduction. https://reliefweb.int/report/world/human-cost-disasters-overview-last-20-years-2000-2019.
- Xu W, Li Y, Okada N, Takeuchi Y, Kajitani Y, Shi PJ. 2014. Collaborative modelling-based shelter planning analysis: a case study of the Nagata Elementary School Community in Kobe City, Japan. Disasters. 38(1):125–147.
- Xu W, Ma YJ, Zhao XJ, Li Y, Qin LJ, Du J. 2018a. A comparison of scenario-based hybrid bilevel and multi-objective location–allocation models for earthquake emergency shelters: a case study in the central area of Beijing, China. Int J Geogr Inf Sci. 32(2):236–256.
- Xu W, Okada N, Hatayama M, Takeuchi Y. 2008. A model analysis approach for reassessment of the public shelter plan focusing both on accessibility and accommodation capacity for residents-case study of Nagata Ward in Kobe City, Japan. J Nat Disaster Sci. 28(2):85–90.
- Xu W, Okada N, Takeuchi Y, Kajitani Y. 2007. A diagnosis model for disaster shelter planning from the viewpoint of local people: case study of Nagata ward in Kobe city, Hyogo prefecture, Japan. Annual Disaster Prevention Researcher Institute. 50(B): 233–239. http://hdl.handle.net/2433/73330.
- Xu W, Zhao XJ, Ma YJ, Li Y, Qin LJ, Wang Y, Du J. 2018b. A multi-objective optimization based method for evaluating earthquake shelter location–allocation. Geomatics Nat Hazards Risk. 9(1):662–677.
- Yao YB, Zhang YY, Yao TY, Wong KP, Tsou JY, Zhang YZ. 2021. A GIS-based system for spatial-temporal availability evaluation of the open spaces used as emergency shelters: the case of Victoria, British Columbia, Canada. IJGI. 10(2):63.
- Yu J, Zhang CR, Wen JH, Li WD, Liu R, Xu H. 2018. Integrating multi-agent evacuation simulation and multi-criteria evaluation for spatial allocation of urban emergency shelters. Int J Geogr Inf Sci. 32(9):1884–1910.
- Yushimito WF, Jaller M, Ukkusuri S. 2012. A Voronoi-based heuristic algorithm for locating distribution centers in disasters. Netw Spat Econ. 12(1):21–39.
- Zhao LJ, Wang K, Wang J. 2014. Theory and method for unban emergency shelter planning. Beijing, China: Science Press.
- Zhao M, Chen QW, Ma J, Cai D. 2017. Optimizing temporary rescue facility locations for large-scale urban environmental emergencies to improve public safety. J Environ Inform. 29(1):61–73.
- Zhao M, Chen QW. 2015. Risk-based optimization of emergency rescue facilities locations for large-scale environmental accidents to improve urban public safety. Nat Hazards. 75(1):163–189.
- Zhao XJ, Chen JG, Xu W, Lou SY, Du P, Yuan HY, Ip KP. 2019. A three-stage hierarchical model for an earthquake shelter location–allocation problem: case study of Chaoyang District, Beijing, China. Sustainability. 11(17):4561. https://doi.org/10.3390/su11174561.
- Zhao XJ, Coates G, Xu W. 2019. A hierarchical mathematical model of the earthquake shelter location–allocation problem solved using an interleaved MPSO-GA. Geomatics Nat Hazards Risk. 10(1):1712–1737.
- Zhao XJ, Du P, Chen JG, Yu DP, Xu W, Lou SY, Yuan HY, Ip KP. 2020. A typhoon shelter selection and evacuee allocation model: a case study of Macao (SAR), China. Sustainability. 12(8):3308.
- Zhao XJ, Xu W, Ma YJ, Hu FY. 2015. Scenario-based multi-objective optimum allocation model for earthquake emergency shelters using a modified particle swarm optimization algorithm: a case study in Chaoyang district, Beijing, China. PLoS ONE. 10(12):e144455.
- Zhao XJ, Xu W, Ma YJ, Qin LJ, Zhang JL, Wang Y. 2017. Relationships between evacuation population size, earthquake emergency shelter capacity, and evacuation time. Int J Disaster Risk Sci. 8(4):457–470.
- Zhong G, Zhai G, Shang K, Chen W. 2022. A two-stage hierarchical model for spatial location and evacuation allocation problem of urban earthquake shelters: A case study in Central urban area of Yangbi county, Yunnan province, China. Geomatics Nat Hazards Risk. 13(1):1721–1761.