
Abstract
This article reviews the main recent applications of multi-sensor remote sensing and Artificial Intelligence techniques in multivariate modelling of agricultural drought. The study focused mainly on three fundamental aspects, namely descriptive modelling, predictive modelling, and spatial modelling of expected risks and vulnerability to drought. Thus, out of 417 articles across all studies on drought, 226 articles published from 2010 to 2022 were analyzed to provide a global overview of the current state of knowledge on multivariate drought modelling using the inclusion criteria. The main objective is to review the recent available scientific evidence regarding multivariate drought modelling based on the joint use of geospatial technologies and artificial intelligence. The analysis focused on the different methods used, the choice of algorithms and the most relevant variables depending on whether they are descriptive or predictive models. Criteria such as the skill score, the given game complexity used, and the nature of validation data were considered to draw the main conclusions. The results highlight the very heterogeneous nature of studies on multivariate modelling of agricultural drought, and the very original nature of studies on multivariate modelling of agricultural drought in the recent literature. For future studies, in addition to scientific advances in prospects, case studies and comparative studies appear necessary for an in-depth analysis of the reproducibility and operational applicability of the different approaches proposed for spatial and temporal modelling of agricultural drought.
The components and fundamentals of multivariate modelling of agricultural drought were discussed.
The importance of hybrid artificial intelligence models is widely discussed in improving the performance of traditional machine learning models.
Quantum machine learning algorithms are weakly explored in multivariate drought modelling. Therefore, future studies should explore this approach.
The major challenge of multivariate modelling of drought frequency is mainly related to the difference in the return periods of the different variables (time-shifted and spatially effects).
HIGHLIGHTS
1. Introduction
Drought is a stochastic, multifactorial climatic hazard and undoubtedly one of the most complex natural phenomena. It is a normal characteristic of the climate, and its recurrence is inevitable. Most often, it grows slowly and spreads over large areas (West et al. Citation2019; Zhong et al. Citation2019; Andersson et al. Citation2020; Dikshit et al. Citation2021). Its occurrence, intensity, gravity, duration, and spatial extent are regulated by natural mechanisms that are not easily perceptible and that are difficult to control. Around the world, the implications of drought on local populations and agro-ecosystems are often catastrophic and irreversible in some areas (Feller and Vaseva Citation2014; Feller Citation2016). In 2019, for example, and according to UNDRR (United Nations for Disasters Risk Reduction), 61.7 million people were affected by the direct and or indirect causes of natural disasters with 4733 deaths. Worse still, the IPCC (Intergovernmental Panel on Climate Change) predicts in its latest report published in 2022 that about 2.5 million more people will be affected by droughts in the next thirty (30) years, mostly in developing countries.
In recent literature, drought is undeniably a climatic hazard whose terminological connotation varies according to several disciplinary fields. The plurivoque nature of the concept of drought has its origins in the highly variable dimensions of the state of drought by geographical area or variables considered. The so-called agricultural drought that interests us in this study is a recurrent intra-seasonal phenomenon in several regions of the world. It is characterized by a very low level of soil moisture (Gao et al. Citation2021; Das et al. Citation2021) and involves the largest number of variables and processes (Wildemeersch et al. Citation2015; Chen et al. Citation2020; Jiménez-Donaire et al. Citation2020; Chandrasekara et al. Citation2021). It is therefore particularly difficult to quantify and predict accurately (Ghazaryan et al. Citation2020; Hara et al. Citation2021). Yet accurate and reliable information on the occurrence, extent, intensity, and potential impacts of drought is very useful in guiding the choice of mitigation strategies for damaging effects (Kavitha et al. Citation2018; Jiménez-Donaire et al. Citation2020; Wang & Yu. Citation2021; Mokhtar et al. Citation2021).
Unlike hydrological, meteorological, and socio-economic droughts, agricultural drought is particularly sensitive to the spatio-temporal variability of climatic variables during the rainfed crop season. However, the severity of the impacts of agricultural drought is influenced by several non-climatic factors including, among others, the geographical context (topography, continentality), agronomic context (crop growth status, genotypes), soil (soil type, soil depth), anthropogenic factors such as local crop management practices, and the existence or not of irrigation-related inputs. For these reasons, over the past two decades, agricultural drought is undoubtedly the type of drought that has sparked considerable scientific effort (Yang et al. Citation2016; Han et al. Citation2019; Bezdan et al. Citation2019; Bayissa et al. Citation2019; Ghazaryan et al. Citation2020; Kulkarni et al. Citation2020; Bento et al. Citation2020; Das et al. Citation2021; Areffian et al. Citation2021). On this topic, looking at 1117 original papers, the study by Orimoloye et al. (Citation2020) reveals that the field of drought vulnerability, drought severity and water shortage (DDVS_WS) has seen a drastic increase in recent years with an annual growth of about 12.7%. Among the efforts devoted to the study of drought, the development of drought indices is undoubtedly the most important effort.
On a global scale, all approaches combined, it is estimated today that there are 150 indices developed for drought assessment, classification, and monitoring (Svoboda and Fuchs Citation2016). They are most often grouped into two large distinct families: single indices and multivariate composite indices. However, it should be noted that many of these indices have been developed in specific geographical conditions, and therefore, their performance in other geographical regions could be limited. Indeed, the variability in performance of drought indices by geographic region or ecosystem type has been demonstrated in several studies (Mishra and Singh Citation2010; Naumann et al. Citation2014; Zhang et al. Citation2017; Liu et al. Citation2018; Song et al. Citation2020; Li et al. Citation2020b; Hanadé et al. Citation2022). By comparing the consistency of several indices (SDCI, TVDI, SDI, VCI, TCI, PCI, VHI) over mainland China, Li et al. (Citation2020b) noted that many indices have different applicability across regions in mainland China. Similarly, through statistical evaluation, Liu et al. (Citation2018) found substantial differences in the performance of drought indices (PDSI, SPI, SPEI) for agricultural drought in the North China Plain. Thus, the sensitivity to drought of a region is strongly influenced by its specific characteristics in terms of the energy and water balances (Shahabfar et al. Citation2012). According to Cartwright et al. (Citation2020), variability in drought sensitivity is influenced by topography, climate, soil characteristics and altitude. These highly variable characteristics in time and space have a direct influence on the biophysical and climatic variables used in the formulation of drought indices. Therefore, in arid and hyperarid regions, the estimation of the different drought indicators is characterized by important uncertainty due to limited rainfall and very low vegetation cover (Naumann et al. Citation2014). This implies that the indices, particularly those based on remote sensing data; appear more accurate in rain-fed regions (Huang et al. Citation2020). To support this point through a study on the influence of spatial heterogeneities on the performance of indices, Hanadé et al. (Citation2022) revealed that drought indices have very variable performance depending on whether it is an irrigated, rainfed, desert and mountainous agrosystem. This is particularly true for drought indices based on NDVI (Normalized Difference Index) or LST (Land Surface Temperature). Drought index concordance was higher in semi-arid agrosystems than in the desert zones. Similarly, it was raised in the same geographical region that the drought indices had variable performance depending on the seasons or the time window considered (Chen et al. Citation2020). This suggests that no multivariate index or model for drought monitoring or prediction can adequately address the multifactorial and multi-temporal stochastic dimension of drought under any climatic condition. Thus, nowadays, monitoring and assessment of drought conditions tends to become a local priority putting forward the hypothesis that the development of local early warning systems or monitoring of agricultural drought at the plot scale could improve strategies to mitigate drought-related impacts (Andersson et al. Citation2020, Jung et al. Citation2021; Das et al. Citation2021).
Recent developments in geospatial technologies, artificial intelligence, and the use of cloud computing platforms such as Google Earth Engine have undoubtedly given an accelerating impetus to drought studies. From this perspective, the use of advanced machine learning methods as data-driven methods tends to become an indispensable alternative to conventional methods based on statistical analysis and/or domain expertise (Shen et al. Citation2019; Sutanto et al. Citation2020; Mokhtar et al. Citation2021; Jung et al. Citation2021). Thanks to this technological development, the use of the full and derived spectrum has been made possible for the detection and multivariate classification of drought (Dao et al. Citation2021).
Indeed, in a factual way, drought monitoring and its predictive modelling are often subject to inaccuracies related to the spatio-temporal complexity of the cause-and-effect relationships of several variables and processes. Therefore, descriptive, predictive mapping or drought risk analysis must be based on the basic principle of non-stationarity and non-collinearity of the factors and variables of the drought phenomenon in their temporal and spatial evolution. The multifactorial dimension of agricultural drought lies fundamentally in the complexity of the interactions between static and dynamic factors in time and space. For this reason, quantitative estimation of agricultural drought and spatial modelling of associated risks is, therefore, a difficult task. Difficulty in quantifying the highly temporally and spatially changing relative importance of covariates or inappropriate model choices for describing or predicting drought conditions are major sources of inaccuracies in spatial drought modelling (Rahmati et al. Citation2020). Similarly, other recent studies have shown that the integration of certain variables into drought prediction models can have a contradictory effect, particularly for the last months of crop growth (Panis et al. Citation2019), which makes it even more complex to model spatio-temporal patterns of drought. In this regard, regardless of the geographical region, conventional methods have proven to be ineffective in modelling the multivariate complexity of the drought phenomenon.
Nowadays, as in other fields, approaches based on multi-sensor remote sensing and artificial intelligence techniques such as random forest (RF), artificial neural network (ANN), SVR, cubist, or SVM have revolutionized approaches dedicated to descriptive and predictive modelling of drought. These contemporary approaches jointly use various products of multi-sensor remote sensing, auxiliary data, and climate model simulations to identify the spatio-temporal and multifactorial complexity of drought. Regardless of the use of machine learning techniques, multi-sensor remote sensing has proven to be an effective means for identifying, evaluating, and anticipating the management of extreme events (Richman and Leslie Citation2018; Jiao et al. Citation2021; Maity et al. Citation2021). Thus, in conjunction with technological and geospatial advances, significant efforts have been made in monitoring, quantifying, and/or predictive modelling of drought parameters (Park et al. Citation2020; Roushangar et al. Citation2021; Zhang et al. Citation2021). This progress includes predictive modelling of several hydro-climatic and biophysical variables in drought management that are of interest to managers and decision-makers (Thober et al. Citation2015; Samadianfard et al. Citation2018; Park et al. Citation2019; Zhang et al. Citation2019). Similarly, the combination of several sensors and platforms offers the possibility of analyses over long periods of up to 40 years of information. The rise of multi-sensor remote sensing and the combined use of data from climate models and artificial intelligence algorithm techniques have significantly improved the ability to model various aspects of agricultural drought including accurate estimation of drought parameters and quantification of expected impacts.
Furthermore, despite recent advances in the use of multi-sensor remote sensing, it should be noted that advances in the development of algorithms and the increase in cloud-based computing and storage capacity have significantly improved the application potential of remote sensing and machine learning models for drought studies (Huntington et al. Citation2017; Zhou et al. Citation2019; Behera et al. Citation2021). Thus, over the past two decades, technological development and the explosion of massive multi-source data quantities have made possible intelligent diagnoses of complex and multifactorial phenomena, including agricultural drought. The availability and accessibility of large amounts of multi-source satellite data and large-scale model output data at all spatio-temporal scales have profoundly disrupted approaches to drought studies. In this new dynamic, the use of geospatial technologies, cloud computing, and artificial intelligence have been recognized as an essential alternative in the multivariate modelling of agricultural drought. Prediction models based on heterogeneous data and machine learning algorithms have proven to be very promising in identifying the multifactorial complexity of drought and its highly evolving characteristics. These new technologies have the advantage of being able to integrate and jointly manipulate information from different sources. They also have the advantage that they require less development time and less complex than the dynamic or physical model (Deo and Şahin Citation2015).
Typically, machine learning techniques and multi-sensor remote sensing are used to cover several important aspects of agricultural drought. Multivariate drought modelling mainly covers modelling response variables such as moisture of the surface layer of the soil (Park et al. Citation2017), modelling expected impact functions such as the effect of water stress on grain quality, and drought resistance (Yuan and Tan Citation2010; Bachmair et al. Citation2017; Sutanto et al. Citation2019; Dao et al. Citation2021; Gupta et al. Citation2021). In addition, there are forecasts of the risks of agricultural yield losses due to drought (Mann et al. Citation2019; Feng et al. Citation2019a; Feng et al. Citation2020), risk mapping (Carrão et al. Citation2016; Rahmati et al. Citation2020; Hoque et al. Citation2021) or vulnerability to drought (Hoque et al. Citation2020; Saha et al. Citation2021; Joko Prasety et al. Citation2019; Li et al. Citation2021). Apart from these elements, descriptive drought modelling is particularly interested in the spatio-temporal quantification of drought parameters from composite models (Sun et al. Citation2017; Bayissa Citation2018; Shen et al. Citation2019; Shah and Mishra Citation2020; Elbeltagi et al. Citation2021), early detection and classification of crop stress (Moshou et al. Citation2014; Zhuang et al. Citation2017; Schmitter et al. Citation2017; An et al. Citation2019b; Samantaray et al. Citation2019; Su et al. Citation2020; Ramos-Giraldo et al. Citation2020). Predictive modelling also provides anticipated information on the occurrence and severity of future dynamics of the phenomenon (Rhee and Im Citation2017; Khosravi et al. Citation2015), trajectory (Diaz et al. Citation2018), and general trend in drought conditions (Son et al. Citation2021).
These advances are particularly interesting for improving the climate resilience of agrosystems in a context where the highly uncertain nature of expected rainfall has become more pronounced due to climate change. In almost all even the most developed countries with an agricultural vocation, the prospects for the resilience of the agricultural sector in the face of the climate hazards would be based on the operational deployment of new geospatial technologies and artificial intelligence. Real-time plot-level monitoring of meteorological and agricultural parameters is already at work in several countries using the internet of things (IoT). In the near future, due to new space missions and the development of new multi-sensor data fusion algorithms (multi-sensor data aggregation), better predictivity of drought risk and real-time monitoring at fine and large-scale resolution of water and heat stress conditions are expected.
To the current state of knowledge, the prediction time usually varies from a few hours to a few months in advance depending on the model, the quality of the data, and their velocity. However, a distinction should be made between predictive modelling in terms of drought occurrence (frequency forecasting) and spatial modelling of severe drought areas (priority vulnerable areas) or multivariate mapping of associated risks. The last two elements of predictive modelling aim to provide information on the future evolution of agricultural drought by assuming the prevalence of a continuous rainfall deficit at the local scale (Park et al. Citation2019). Rather, it provides information on the future development and evolution of agricultural drought, assuming that rainfall deficit conditions continue to prevail, in preparation for drought mitigation plans. In addition, machine learning techniques have led to a better understanding of the lagged effects of droughts on photosynthesis on a global scale (Xie et al. Citation2020) and a better estimation of the asynchronous dynamics of drought-related variables including the delayed effect of NDVI on precipitation and LST (Liu et al. 2020). The other lever for the use of machine learning techniques in agricultural drought modelling concerns quantitative and qualitative modelling of drought-related variables, including evapotranspiration and moisture (Ahmad et al. Citation2010; Phillips et al. Citation2014; Chen et al. Citation2021) and the amount of water in plants (Yuan et al. Citation2019).
At present, the combination of massive data from multi-sensor remote sensing, climate model simulations, in situ observations (agrometeorological), and auxiliary data (base map) are increasingly very popular in descriptive and predictive modelling of drought parameters and variables. Nevertheless, the complementary use of several data sources has become the preferred use of new approaches (West et al. Citation2019, Li et al. Citation2020a), and the use of deep learning models (RNN, LSTM, CNN) would require little or no axillary data to achieve accurate modelling of drought conditions. Since a wide range of multi-sensor drought modelling approaches has been developed and tested in different parts of the world by combining earth observation data with other data sources and using various machine learning techniques, it is therefore appropriate to provide an analysis of the recent literature to describe new scientific trends.
Due to rapid updates in knowledge related to very rapid scientific and technological advances, several systematic review studies have been conducted on drought (Mishra and Singh Citation2010, Citation2011; Hao and Singh Citation2015; AghaKouchak et al. Citation2015; Hao et al. Citation2018; Fung et al. Citation2020; Anshuka et al. Citation2019; West et al. Citation2019; Orimoloye et al. Citation2020; Xu et al. Citation2022; Zhang et al. Citation2022; Singh et al. Citation2022; Prodhan et al. Citation2022; Petersen-Perlman et al. Citation2022; Dikshit et al. Citation2022). Based on global paleoclimatic studies, Mishra and Singh (Citation2010) examined the fundamental concepts of drought modelling and the spatio-temporal relationships of climatic and hydrological parameters. The historical trajectories of major droughts and their socio-ecological impacts in different regions of the world were analyzed and discussed. The study demonstrates the plurivoque nature of the concept of drought and its very complex socio-economic, hydrological, and environmental implications. Drought as a complex natural hazard was studied, as well as the comparative strengths, weaknesses, and performance of the main hydroclimatic and remote sensing indices. Following the same study, Mishra and Singh (Citation2011) documented the advantages and disadvantages of different approaches to drought modelling and the relationships of the components of drought modelling. Various aspects of drought, namely drought parameters (severity, magnitude, intensity, duration, return period), probabilistic characterization, components of the forecast as well as the various factors aggravating the consequences of drought were discussed.
Similarly, Hao and Singh (Citation2015) established a systematic analysis of multivariate approaches related to the development of composite drought indices. The advantages and disadvantages of water balance-based approaches, objective and subjective linear combination approaches of multi-source variables, and multivariate drought statistics approaches were analysed and discussed. The opportunities and limitations of approaches based exclusively on remote sensing data for drought monitoring from a climatological and ecosystem perspective have been documented by AghaKouchak et al. (Citation2015). Other systematic review analyses of drought have looked at scientific advances in seasonal drought forecasting. To this end, Hao et al. (Citation2018), listed and compared seasonal drought forecasting methods. In this, large-scale mechanisms, and local factors of seasonal predictability of the drought phenomenon from statistical, physical and hybrid methods were discussed. The study highlights significant differences in the ability of statistical and physical methods to include in seasonal drought forecasts the complex atmosphere-ocean interactions, the influence of human activities, and the highly variable impacts of climate change. Addressing the topic of drought prediction, Anshuka et al. (Citation2019) provided a detailed comparative analysis of examples of statistical models of drought forecasts using the standardized precipitation index. The influence of the SPI time scale on the predictive skills of the models was also evaluated and the comparison of empirical models (meta-regression) and data-based ones supports the merit of data-driven models such as neural networks Neural networks transformed into wavelets. Regardless of drought type, drought prediction models were compared by Fung et al. (Citation2020) for the performance and accuracy of statistical, stochastic, probabilistic, artificial intelligence and hybrid models.
Studies such as that of West et al. (Citation2019) have reviewed the progress of new geospatial technology, including the rise of passive and active remote sensing in the monitoring and estimation of drought variables and the influence of spatial resolution on the quantification of the impacts of different types of droughts (meteorological, agricultural, and hydrological). Based on the critical circumstances of water supply shortages, Orimoloye et al. (Citation2020) documented the impacts of socio-economic drought including vulnerability to drought and its severity on a global scale. Recently, the climatic vulnerabilities of drought, including the characteristics that influence its spread in the components of the water cycle, have been examined by (Zhang et al. Citation2022). In the same way, Xu et al. (Citation2022) specifically looked at the characteristics of hydrological drought development and recovery and the influence of human and topographical factors in this process in semi-arid areas. It is in this sense that after examining the interconnections between drought and groundwater, Petersen-Perlman et al. (Citation2022) suggested a joint management between drought risk and water management in terms of governance policies and technological innovations.
Moreover, regardless of the geographical context and the approach used, the study by Singh et al. (Citation2022) provides valuable information on the accuracy and overall acceptability of the indices proposed in the literature for monitoring, evaluating, or predicting drought conditions. Similarly, in view of recent technological advances and the growing use of artificial intelligence models in modelling drought conditions, Dikshit et al. (Citation2022) established a review analysis on the use of the artificial neural network in drought prediction without documenting the full scope of application of artificial intelligence in this field. Nevertheless, Prodhan et al. (Citation2022) realised a more general analysis of the application of machine learning and deep learning models in the monitoring and forecasting of different types of droughts. This systematic review of the literature is a continuation of these systematic literature review studies that complement each other and further enrich our knowledge of drought. But unlike, this one is particularly interested in multivariate agricultural drought including the use of learning techniques and multi-source data. Its objective is to identify, synthesize and discuss recent studies on multivariate agricultural drought. Thus, the study should identify the most relevant variables in multivariate modelling of agricultural drought and identify the parameters of modellable agricultural drought. It will also examine and discuss the competencies of the different models based on the criteria for validation and evaluation of the models. The answers to these research questions should make it possible to identify prospects for better quantification and multivariate modelling of agricultural drought conditions.
2. Methodology
Regardless of the geographical area, the study focused on the different methods used, the algorithmic performances and the variables in the multivariate modelling of agricultural drought. To identify, analyse and discuss all available evidence related to the research question in an unbiased manner, the first step of the methodology is to develop and validate a detailed research protocol (appendix, supplementary material). This protocol has made it possible to collect a database of 417 scientific articles on drought questions in general, and 222 scientific articles were analyzed in depth that addresses the research question. These articles come from electronic data available online (Google scholar, Scopus, Science Direct, IEEE Xplore). To conduct a comprehensive search of the existing literature related to the search question, the following keyword combinations were used based on the specific syntax of each database: multivariate modelling including ML multi-sensor remote sensing, multivariate modelling including DL + multi-sensor remote sensing + Big data or multivariate modelling including DL + ML + multi-sensor remote sensing + Big data.
The primary bibliographic database was managed using the Zotero reference management software. In the selection of primary studies, only research articles published in journals indexed between 2010 and 2022 were considered excluding traditional review papers, books, and conference and conference proceedings. Subsequently, the secondary database was classified according to several criteria: a classification by year of publication, a classification by approach, and classification according to the scores of the skills of the models and variables considered in the modelling of agricultural drought. The results of the different classifications were summarised in the form of tables, graphs, and diagrams (meta-analysis) and then analyzed and discussed to draw relevant conclusions.
3. Results
3.1. Temporal analysis of publications related to the research question
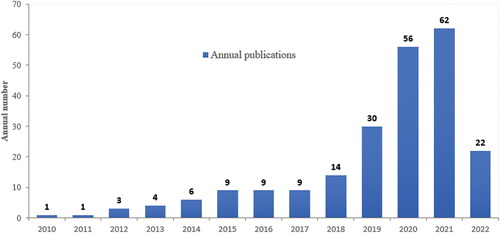
A temporal analysis of the annual publications related to the research question was carried out with the aim of identifying the frequency of publication per year in the field of multivariate modelling of agricultural drought by machine learning. The result of the analysis presented in shows a spectacular evolution of scientific publications from the year 2018. In the first eight years (2010 to 2017), the number of annual publications on multivariate drought modelling that includes the joint use of multi-sensor remote sensing and artificial intelligence techniques was low. However, from 2018, a clear upward trend is observed ().
Figure 1. Annual number of publications on multivariate agricultural drought modelling based on machine learning models.
3.2. Characteristics used in multivariate modelling of agricultural drought
Two sets of characteristics are fundamental and inseparable for the multivariate modelling of agricultural drought. The first category of characteristics, essential for spatial and temporal modelling of drought, is related to the different factors and/or variables of drought. Across all approaches, from the analysis of the recent literature on multivariate modelling of agricultural drought, we had identified at least 84 sets of parameters (different input data) that are commonly used in predictive modelling of agricultural drought risks, vulnerability modelling, or quantitative estimation of descriptive parameters of agricultural drought (). In view of the large number of parameters found in the literature, we have grouped them into 14 categories of parameters depending on the different factors or variables of agricultural drought. Vegetation-related factors cover the greatest diversity of factors (at least 14 documented), followed by factors related to soil moisture (8) and macro-climatic factors (8). The use of raw satellite images, RGB images, Land Cover, light use efficiency (NPP, GPP), expert opinion on soil or crop conditions, and the use of composite indices (VSWI, VHI, TDVI, NMDI) are the least frequently used features in multivariate modelling of agricultural drought. In addition to these sets of factors (input variables) of machine learning models, other approaches consider characteristics related to drought parameters, temporal characteristics of the predictors (seasonality, trend, extreme peak), normality of variables, periods of return of extreme peaks of different variables, and recovery time after drought (DRT). The incorporation of these characteristics has been shown to be essential in multivariate drought modelling.
Table 1. Main factors and variables in multivariate drought modeling.
3.3. Choice of the dependent or response variable
In a multivariate modelling approach to agricultural drought, the choice of the dependent variable is very important. The predicted or modelled response variable should allow for multivariate analysis of agricultural drought parameters, namely its intensity, severity, spatial extent, duration, and potential impacts. The dependent variable is indeed the function that quantitatively represents the expected or observed drought conditions. However, there are no unanimously accepted criteria for the choice of the response variable for drought modelling. This is linked to the multi-temporal and geographic variability of drought sensitivity. For this reason, credible analysis of the relationships between potential predictive variables and the target variable is required in a multivariate modelling approach to agricultural drought (Rahmati et al. Citation2020). However, the highly spatio-temporal variability of the interrelationships of the different drought variables precludes any systematic analysis of the phenomenon and lends credibility to contextual and dynamic approaches in time and space. Therefore, the selection of relevant variables in the multivariate drought analysis is one of the most important steps since the criteria for selecting and assigning weights of input variables to models vary considerably.
In this regard, for example, Zhang et al. (Citation2022) found that soil moisture and precipitation were the most important variables for assessing drought conditions at different time scales and that the (Land Surface Temperature) has relatively high importance for short-term drought. This further supports the conclusions of Ke et al. (Citation2016) that indicators derived from temperature subject to considerable variation were less important than vegetation greenery and indicators related to soil moisture because the temperature is subject to significant variations on the scale of a few days. However, Park et al. (Citation2016) study found that Land Surface Temperature or evapotranspiration factors are of relatively higher importance for short-term weather droughts than vegetation-related factors (NDVI). It should therefore be noted that the question of the importance of the variables is only a relative approximation that is highly dependent on the context, the reference variable and to some extent the machine learning model chosen. For example, Ke et al. (Citation2016) found that indicators related to NDVI, EVI, and SAVI vegetation growth were more important in modelling evapotranspiration by the Random Forest algorithm than indicators of LST or soil moisture.
To date, there is still no universally valid discriminating criterion for the section and weight allocation of the different multivariate drought modelling variables. In the literature, the selection and assignment of weights in models are based on a prior comparison of potential predictors with a reference series. In addition, the Random Forest algorithm is the most widely used machine learning model for sectioning and estimating variables in multivariate drought models. After a prior choice, the add, remove, and verify test operations are often used to complete the relative importance of the variables obtained by RF. In this analysis, and over the recent period 2010 to 2022, we documented at least 16 categories of response variables that were modeled from multivariate approaches based on machine learning techniques and multi-source data. Thus, given the complexity of the drought phenomenon, the plurality of approaches, and machine learning algorithms used, various validation approaches have been found in the literature. Drought inventory maps, crop yield anomalies (drought losses), soil moisture, and hydro-climatic indices (SPI, SPEI, river flows) are the most widely used reference base for the validation of multivariate modelling of agricultural drought.
3.4. Criteria for assessing the competencies of the models
The evaluation of the skills of predictive models is a fundamental imperative of multivariate modelling of agricultural drought. Thus, several types of precision error indicators are used to evaluate model performance. Here we present a general overview of the main evaluation criteria for machine learning models of multivariate agricultural drought modelling. The most widely used in the literature includes: the mean absolute percentage error (MAPE) (Hara et al. Citation2021), root mean quadratic error (RMSE) (Deo and Şahin Citation2015; Lees et al. Citation2020), the coefficient determination (R2) (Park et al. Citation2019; Feng et al. Citation2019b), mean absolute error (Elbeltagi et al. Citation2021), root relative squared error (RRSE) or validation using the confusion matrix (Anshuka et al. Citation2021). The combination of these measures is often preferred for the overall assessment of the competencies of forecasting models. Residue analysis is also a widely used method for evaluating the validity and performance of parametric and non-parametric regression models.
In other studies, the practical significance test such as the Bayesian hypothesis test (Meroni et al. Citation2021), false alarm rate, skill score (Pham et al. Citation2020), Bridier skill score (Sutanto et al. Citation2020), or ROC curve (Feng et al. Citation2020; Arabameri et al. Citation2021; Raza et al. Citation2021; Saha et al. Citation2021; Seo and Kim Citation2021) is calculated to validate the predictive skills of ML algorithms. Recently, Ciemer et al. (Citation2020) used the Heidke Skill Score (HSS) to evaluate the proposed drought forecasting scheme in South America. The HSS is a test that compares the performance of the model to that of a random prediction. In addition, to these prediction error measures, cross-validation is often used to quantify the accuracy of prediction models (Houborg and McCabe Citation2018; Lee et al. Citation2020). Similarly, real skills statistics (RSS), the Friedman and Wilcoxon ranking test, the K-index (Saha et al. Citation2021), or the Willmott chord index (Deo and Şahin Citation2015) are also widely used in the evaluation of multivariate machine learning models. Note that in the existing literature, there is very little information on the comparison of these different criteria for assessing the skills of machine learning models applied to multivariate modelling of agricultural drought.
3.5. Best machine learning algorithm in multivariate modelling of agricultural drought
In this systematic review, we documented several ML models that are used in multivariate modelling of agricultural drought. However, in the current state of knowledge, there is still no scientifically indisputable factual evidence on the merit of one machine learning model over others. Current and recent literature highlights skills scores that are often quite variable for the same type of algorithm in different contexts and case studies. Thus, in view of this diversity of machine learning models, a comparative analysis of the skills of some models was established based on the skills scores found in the literature to arrive at a factual finding (). To better understand this, the following table provides a comparison of the skill scores of the most popular models. Emphasis was placed on models based on Random Forest. Based on the score analysis of the skills of the different machine learning models used in the multivariate modelling of agricultural drought listed in the following (), we deduce that RF is much better than other algorithms like RNN, SVR, Cubist, or SVM. Similarly, information from the converging recent literature supports this finding. The fundamental reason given is that the Random Forest algorithm is less sensitive to noise and effective in managing non-linearity relationships between drought variables (Kirasich et al. Citation2018; Fung et al. Citation2020; Sutanto et al. Citation2019). In addition to this, RF reduces overfits and leads to good regression performance based on the average of several decision trees (Park et al. Citation2019). For the above reasons, Feng et al. (Citation2019b) suggest that the bias-corrected RF model is the most promising tool for monitoring agricultural drought. In a similar vein, Kuswanto and Naufal (Citation2019) found that an approach based on the use of synthetic minority oversampling (SMOTE) techniques contributes to the improvement of regression and classification models (CARET and Random Forest). However, based on the skill scores presented in the following (), the Cubist model is still very competitive with the RF model. In addition, it should be noted that other studies have found that the use of hybrid models is beneficial for improving the performance of machine learning-based models (Kisi et al. Citation2019; Fung et al. Citation2020; Park et al. Citation2020; Danandeh Mehr et al. Citation2020; Ahmed et al. Citation2021; Danandeh Mehr et al. Citation2022; Ahmed et al. Citation2022). As such, using a PDSI-based predictive modelling approach, Aghelpour et al. (Citation2021a) found that the SVM-DA hybrid model would improve SVM accuracy by up to 29%. Similarly, the bio-inspired optimization algorithms of GA and PSO algorithms would improve the prediction accuracy of the ANFIS model by 38.7%and 22.6% (Aghelpour et al. Citation2020) and the ICA optimizer is likely to boost the accuracy of the MLP by up to about 28.5% (Aghelpour and Varshavian Citation2021).
Table 2. Comparative table of skill scores of ML and DL models.
4. Discussions
Over the past decade, due to recent geospatial advances and data computing, studies on multivariate modelling of agricultural drought have increased significantly. This systematic literature review analyzes recent advances in multivariate modelling of agricultural drought including the use of artificial intelligence techniques. Agricultural drought modelling basically covers three important aspects: descriptive modelling of drought parameters (onset, intensity, and cessation), multivariate predictive modelling of drought intensity and multivariate risk mapping. These components of multivariate agricultural drought modelling are discussed as follows:
4.1. Multivariate descriptive modelling of agricultural drought
Multivariate descriptive drought modelling is an approach that combines several variables and attempts to reproduce quantitative and qualitative information essential for drought assessment and monitoring. Scientific efforts for this purpose focus on properly describing drought conditions without providing information on expected conditions. Over the past two decades, substantial progress has been made in multi-scale characterization of agricultural drought conditions. This progress concerns mainly the accuracy of drought parameters estimation, multi-source data aggregation capacity and operational monitoring of drought conditions. These advances in drought monitoring and assessment are closely linked to technological advances and the availability of multi-source data that have fostered the explosion of drought studies around the world.
Unlike traditional methods based on spatial interpolation of in-situ measurements or multivariate statistical modelling of drought, the joint use of multi-sensor remote sensing and machine learning models now offers the possibility of better understanding the spatio-temporal complexity of the drought phenomenon. Along with the explosion of multi-sensor and multispectral data, the use of machine learning algorithms now covers all aspects of multivariate drought modeling. Information taken on several biophysical variables that control vegetation growth and stress conditions can be generated at multiple temporal and spatial resolutions. The use of artificial intelligence techniques in the fusion of data from several satellites, in improving spatial resolution, or in estimating the relative contributions of drought-related covariates has given new direction to methods and approaches to descriptive modelling of agricultural drought. Both machine learning and deep learning models have been widely used to describe and/or to simulate several aspects of agricultural drought. Similarly, the use of hybrid and reinforcement learning models is an emerging trend in the field of drought modelling. On the other hand, at the current state of knowledge, quantum machine learning models have not yet been tested in multivariate drought modeling (Garcíaa et al. Citation2022). However, these new algorithms have shown the ability to simulate the complex phenomenon that evolves over time. In the fields of quantitative finance, in particular the predictive modeling of market uncertainties, quantum machine learning has been of great interest. Due to the complex, stochastic and highly evolving nature of drought, the applicability of such approaches should be tested. Analysis of the recent literature highlights several composite models developed in several regions of the world to identify the multidimensional and multifactorial nature of agricultural drought. A large part of these studies combines, the use of multi-sensor remote sensing, artificial intelligence techniques and to some extent the use of cloud computing platforms (Wu et al. Citation2015; Park et al. Citation2016; Samantaray et al. Citation2019; Sun et al. Citation2017; An et al. Citation2019; Shen et al. Citation2019; Son et al. Citation2021; Khan and Gilani Citation2021; Schwartz et al. Citation2022).
Each of these studies is a different approach in terms of the choice of response variable and algorithm used to assess the relative importance of variable or index of the multivariate models developed. However, three types of approaches commonly used in multivariate drought modelling can be identified from the second generation of so-called composite indices. These include composite models developed based on local knowledge (expert opinion), (Bezdan et al. Citation2019; Kulkarni et al. Citation2020), composite models built on purely statistical approaches (Bayissa Citation2018; Chen et al. Citation2020; Wang and Yu Citation2021; Kim et al. Citation2021) and very recently models based on artificial intelligence and machine learning algorithms (Shen et al. Citation2019; Han et al. Citation2019, Liu et al. 2020; Son et al. Citation2021). Indeed, to overcome the problem of the non-linearity of drought variables several model models of non-binary composite models have been developed recently in worldwide with the aim of converging towards objective assessments of drought conditions. From this perspective, for example, Hara et al. (Citation2021) point out that the use of artificial neural networks (ANNs) overcomes the lack of linearity between crop yield and independent variables.
Studies such as that of Wang and Yu (Citation2021), have recently used two statistical methods namely, principal component analysis (PCA) and hierarchical process analysis (HPA) to build comprehensive drought monitoring models in Yunnan Province, China. To this end, the overall drought index was developed from an objective combination of indices (RTCI, TCI, VCI) and then validated against SPI and SPEI indices and GLDAS data. The coefficient of determination, R,2 between the SPI and the CDI is from 0.37 to 0.68, from 0.38 to 0.63 with the SPEI and from −0.54 to −0.92 with the TDVI depending on the month. However, the relationship with yield anomalies has not been established for better comparison with other models. Similarly, on the Aras and Karheh watersheds in western Iran, the Comprehensive Remote Sensing Drought Index (CRSDI), developed by Shojaei and Rahimzadegan (Citation2022) that incorporates groundwater information from GRACE and GLDAS data records only 0.66 correlation with the six-month SPI. In the same geographic region Kulkarni et al. (Citation2020) developed the combined drought indicator for Marathwada (CDI-M) in India by using two quantitative methods. Thus, the results of the study reveal that the CDI-M based on PCA is more reliable than the expert judgment-based approach with a correlation of 0.6 with crop yields versus 0.4 the correlation between cereal yields and CDI-M based on expert judgement. In the same year, Chen et al. (Citation2020) developed the Modified Composite Drought Index (MCDI) using information entropy to balance the relationship between variables and the unbiased objective attribution of variable weights in Hubei province (India). However, the MDCI has been validated in a very generic way that does not allow an objective critical analysis of the accuracy of its performance to the detriment of other models. Similarly, in the Markazi watershed, Iran, Hosseini-Moghari et al. (Citation2019) introduced for the first time the Modified Total Storage Deficit Index for Drought Monitoring (MTSDI) for water-intensive basins. The MTSDI was developed based on the total signal residue of GRACE observations. It has been shown to be more effective than SPI, SPEI and TSDI in detecting moderate droughts. Such an approach is of major interest for future drought studies in most semi-arid watersheds.
In many other previous studies, other approaches have been developed often for specific applications. Recently, Saha et al. (Citation2021) developed a state-of-the-art approach for real-time drought monitoring at a spatial resolution of 0.25°. In the upper Nile basin (Ethiopia), Bayissa et al. (Citation2019) proposed VegOut-UBN model on a 250 m resolution. VegOut-UBN was developed on a regression tree approach using climate, biophysical and ocean variables. This approach has the advantage of including both real-time drought monitoring and projected perspectives of vegetation conditions with an R2 > 0.8 for monthly predictions. Similarly, regression equations were used for different types of land use by Li et al. (Citation2020c) to propose the Drought Index of Cloud Regions for the first time. CRDI was developed in semi-arid ecosystems in southeastern China based on information of optical cloud thickness (TOC) and antecedent drought index (ADI).
In other case studies (Ghazaryan et al. Citation2020; Sultana et al. Citation2021; Das et al. Citation2021), multispectral and/or multi-sensor approaches including time series (Landsat, MODIS, Sentinel-2) and Synthetic Aperture Radars (SAR) have proven effective for spatio-temporal monitoring of crop condition and drought impact at scale (management unit). It is in this logic that Wang et al. (Citation2020) first introduced the Improved Soil Temperature, Vegetation and Moisture Index (iTVMDI) into the arid northern China. This study showed that iTVMDI is strongly correlated (-0.7) with GLDAs soil moisture, precipitation (0.65) and surface water (0.81). Nevertheless, despite the innovative multi-sensor nature of this approach, spatio-temporal and static relationships with crop yields have not been provided. Regarding to agricultural drought, these elements are particularly useful for situating the effectiveness of each model developed. Currently, the availability of geostationary meteorological satellite data has made real-time monitoring and early warning of agricultural drought possible. Recently, Vyas and Bhattacharya (Citation2020) examined for the first time in India, the potential of geostationary meteorological satellites (Kalapana-1, INSAT 3 A) for the development of agricultural drought early warning indicators. To this end, operational products, namely baseline evapotranspiration, precipitation, and crop vigor warning, were used in the construction of the early warning indicator. Despite a high temporal follow-up (10 days), the first major disadvantage of this approach lies in its coarse resolution of 0.25° which would significantly affect micro-scale analyses. Such a resolution hardly meets the requirements of drought monitoring and assessment at the sub-watershed level, for example. On a small scale, high-resolution, near-real-time indicators are needed to streamline decision-making at community level. To this end, the approach developed by Aadhar and Mishra (Citation2017) in South Asia, based on the use of SYMAP algorithm and a high-resolution DEM to correct high-resolution (0.05°) biases in precipitation and temperature data, seems better suited for better monitoring of drought conditions at the sub-watershed scale.
From the above, it should be noted that these multivariate composite approaches include multivariate approaches based on a combination of single-variable drought indices and those integrating several agricultural droughts variables. In this proposed diversity of indices, until very recently, some multi-purpose drought indices such as the SPI, the JDI, the MSPI, the PDSI, and the SPEI, are very little accepted in the literature as indices of agricultural drought. However, based on several evidence-based studies, some researchers suggest that climate drought indices are considered indirectly as indices of agricultural drought, especially in arid and semi-arid regions (Bae et al. Citation2012; Bazrafshan et al. Citation2014; Bazrafshan et al. Citation2015; Aghelpour et al. Citation2020; Aghelpour et al. Citation2021b; Fan et al. Citation2022). By testing the effectiveness of several artificial intelligence models (GRNN, LSSVM, GMDH and ANFIS-FCM), Aghelpour et al. (Citation2021b) demonstrated that multivariate climate indices such as the Multivariate Standardized Precipitation Index (MSPI) can provide valuable information simultaneously of several types of droughts (meteorological, hydrological, agricultural, and socio-economic). This view is still not unanimous within the scientific community. Although the causal relationships between climatic and biophysical indices are factual evidence, several studies distinguish between indices of agricultural droughts and those of so-called meteorological droughts. Indeed, multivariate composite models based primarily on multi-source remote sensing data such as CDMI, CDMIa_RF, MDCI, CDI, SDCI that incorporate several drought variables can provide a more complete picture of drought conditions. As such, Hanadé et al. (Citation2020) demonstrated that the composite model for drought monitoring offers the best correlative compromise with indices of other forms of drought. The CDMIa_RF had highly significant correlations with three types of hydrological drought indices derived from measures of actual flows. This suggests that multivariate composite models can inform several forms of drought at once.
For those reasons, nowadays, particular emphasis is placed on composite indices or multi-source hydrides that include, in addition to remote sensing data, data from climate model simulations and in situ measurements (Rajsekhar et al. Citation2015; Shen et al. Citation2019; Han et al. Citation2019; Wei et al. Citation2020; Liu et al. Citation2020; Hanadé et al. Citation2020; Bravo et al. Citation2021; Singh et al. Citation2021; Ali et al. Citation2022). There is now a general scientific consensus that nonlinear composite models are better suited for operational monitoring applications and assessment of drought conditions. Early warning systems, which integrate several indicators, have achieved considerable success in mitigating the adverse effects of climate crises (Krishnamurthy et al. Citation2020; Chen et al. Citation2020, Wang and Yu Citation2021; Hara et al. Citation2021; Hanadé et al. Citation2022). But the major disadvantage of these models is that they require several datasets often with very different characteristics that impose normalization and downscaling treatments.
Furthermore, it should be noted that regardless of the number of types of variables considered and the learning model used in descriptive modelling, the question of categorization of indices by drought type remains a major element that fuels confusion about multivariate drought modelling. Therefore, to capture the fundamental characteristics of drought, numerous studies based on comparative approaches have evaluated the performance of several machines and deep learning models thanks to the possibility of very advanced analyses via cloud computing platforms. Park et al. (Citation2016) explored, using machine learning techniques, the importance of combining sixteen drought factors to simultaneously monitor weather and agricultural drought during growing seasons across different climate regions of the United States. For this purpose, they used three machine learning approaches, namely RF, boosted regression trees, and cubist (Wu et al. Citation2013). Similarly, it should be noted that multivariate descriptive drought modelling using machine learning techniques is used to map drought-prone areas, for estimating the cultivated areas affected by severe and extreme droughts (Nguyen et al. Citation2017; Park et al. Citation2019; Araneda-Cabrera et al. Citation2021).This includes high-resolution modelling of key factors in drought monitoring such as surface soil moisture (Park et al. Citation2017; Hajdu et al. Citation2018; Wang et al. Citation2022), evapotranspiration (Ke et al. Citation2016) or earth surface temperature (Ebrahimy and Azadbakht Citation2019). As such, the water stress function of crops is often estimated from variables such as soil moisture values and water content according to the different phases of crop growth (Samantaray et al. Citation2019). In addition, it should be noted that beyond traditional descriptive modelling, the analysis of the recent literature increasingly shows the emergence of new approaches that are interested in multivariate modelling of the spatial vulnerability of drought from machine learning models and multi-sensor remote sensing (Saha et al. Citation2021; Arabameri et al. Citation2021) sometimes coupled with the use of crop models (Li et al. Citation2021).
Multivariate mapping of drought vulnerability is a multifactor mapping that includes sensitivity, exposure, and mitigation factors that determine climate resilience in natural or anthropogenic ecosystems. This includes the objective land suitability classification of drought-prone areas (Habibie et al. Citation2020) by considering natural and anthropogenic sensitivity factors. In addition, it should be noted that machine learning techniques are also increasingly used for the fusion of multi-source data for monitoring vegetation growth parameters such as anomalies in the water content of vegetation (Yuan et al. Citation2019) or modelling soil moisture near the surface (Chatterjee et al. Citation2022). Quantitative drought estimation from descriptive modelling, as well as results from machine learning multi-sensor fusion, are often used as key parameters in hybrid models of yield predictions.
However, despite substantial progress in multivariate drought modelling, it should be noted that accurate, reliable, and operational drought monitoring applications still require additional efforts. In previous studies, some very fundamental aspects of drought monitoring such as integration into multivariate models influence of local forcing and the cumulative footprints of previous droughts are not considered in multivariate descriptive modelling of agricultural drought.
4.2. Predictive modelling of agricultural drought risk
Spatial modelling of agricultural drought risks based on machine and deep learning techniques is a relatively new approach compared to descriptive modelling of drought parameters. This approach is mainly linked to the growing interest in providing useful information for early drought management, especially in regions where supplementary irrigation is important in the management of drought episodes. It corresponds to multivariate predictive analyses that provide a practical mapping of the expected risks, their intensity, their spatial distribution (Tian et al. Citation2018; Kaur & Sood Citation2020; Rahmati et al. Citation2020), as well as drought-related forecasts of the risk of reduced agricultural production (Zambrano et al. Citation2018). It also includes, to some extent, predicting areas of severe droughts by providing severe stress information in advance (Park et al. Citation2019); multifactorial predictive of vegetation conditions (Barrett et al. Citation2020; Mokhtari and Akhoondzade Citation2020; Roushangar et al. Citation2021), precipitation anomalies, seasonal anomaly forecasts, soil moisture (Thober et al. Citation2015; Zhu et al. Citation2019) or prediction of crop water content (Hendrawan and Murase Citation2011).
In the recent literature, four types of models are commonly used in the study of drought forecasting: statistical forecast models, dynamic models, machine learning models, and hydride models, most often including all three approaches. Statistical drought prediction models are based on historical time series analysis and modelling of the relationships between one or more predictor variables and a drought index (Chandrasekara et al. Citation2021). Statistical models such as multiple linear regression (Pen and. 2017; Petersen Citation2018; Zambrano et al. Citation2018; Leroux et al. Citation2019; Ghazaryan et al. Citation2020; Fall et al. Citation2021) and moving average models are traditionally the most widely used (Aghelpour et al. Citation2021a). Based on the inherent historical persistence of drought indices, several univariate forecasting models (Mo and Lyon Citation2015, Lees et al. Citation2020; Evkaya and Kurnaz Citation2021) and multivariate drought (Hao et al. Citation2016; Aghelpour and Varshavian Citation2021) were proposed. In this sense, Hao et al. (Citation2017) believe that by incorporating previous precipitation conditions and the seasonal cycle of climatic precipitation, drought prediction can be achieved. Thus, considering the historical characteristics of drought, a significant number of previous studies have been focused on univariate drought forecasts using simple indices such as SPI, SDI, SMI etc (Evkaya and Kurnaz Citation2021).
Unlike statistical models, dynamic (physical) models are based on general circulation models (GCMs) and incorporate interconnections between land, ocean, and atmosphere (Thober et al. Citation2015; Khan et al. Citation2020). Dynamic models provide predictions about the potential large-scale occurrence of climate extremes (Feller and Vaseva Citation2014). But they are particularly sensitive to the prediction interval and the spatial extent considered. The other disadvantage of climate models is that predictive skills vary depending on the climate context. In this regard, Yuan and Wood (Citation2013) pointed out that the NMME model adds additional skills in tropical regions unlike extratropical regions. Thober et al. (Citation2015) revealed that the NMME dynamically based seasonal drought forecasting system had superior predictive skills to forecasts based on the Streamflow Prediction Set (ESP) model. However, the ESP model remains the most popular model for predicting the seasonality of hydrological and meteorological drought.
Nowadays, data-driven seasonal forecasting systems using AI and machine learning techniques have been very successful in recent years (Shamshirband et al. Citation2020; Mokhtari and Akhoondzade Citation2020; Danandeh Mehr et al. Citation2020; Saha et al. Citation2021; Singh et al. Citation2021). The large and growing availability of multi-source data and the improvement of the storage and processing capacity of machines are the main success factors of AI and ML techniques. These new approaches combining remote sensing, machine learning (ML), in-situ measurements and numerical model data offer the best prospects for meeting the needs for multi-factor drought forecasting. Thus, to meet this objective, a significant number of models based on ML and AI algorithms have been proposed (Lees et al. Citation2020; Aghelpour and Varshavian Citation2021). Very recently, the drought prediction model developed by Park et al. (Citation2020) combining remote sensing drought index (SDCI, SPI) models and numerical model outputs, has made it possible to overcome the difficulty of short-term forecasting. Thus, through the synergistic use of convolutional long-term memory (ConvLSTM) and the Random Forest (RF) algorithm, 8-day drought forecasts were developed. The approach was found to be useful for operationally providing future drought conditions at high resolution. Similarly, by comparing several ML algorithms (RF, SVR, LASSO, GBR and MLP), Meroni et al. (Citation2021) proposed an operational framework for forecasting cereal yields in Algeria with an overall accuracy of 0.16-0.2 t/ha (13-14% of the average yield) over the season. In Morocco, Bouras et al. (Citation2021) compared the predictive performance of five ML models and proposed a dynamic multi-source approach to cereal yield forecasts at the provincial level that seems better suited to overcome the limitations of empirical models. According to the same authors, the most robust model is XGBoost have R2 = 0.88 and RMSE around 0.22 t. ha−1. However, it has been reported that developing predictive models by province would improve forecast accuracy by reducing the RMSE by 10-20%. Nevertheless, Petersen (Citation2018) analyzed monthly anomalies in vegetation health and based on multiple regression models, resulted in cereal yield forecasts comparable to predictions in ML and/or hybrid models. The forecast accuracy of the main crops at two to four months was −2% error (for 20% forecast) and −5% error (for 40% forecast).
Considering such results, the debate on the choice of approach and/or algorithm for short-term forecasts of drought or their impacts in terms of falling yields remains topical so far. Studies such as Elbeltagi et al. (Citation2020), Pham et al. (Citation2020) that compared ANN, PSOANFIS and SVM algorithms for rainfall forecasts, or Khan et al. (Citation2020) that examined the potential of three advanced ML techniques in Pakistan, reported that SVM-based forecasting models are more robust in capturing spatio-temporal characteristics of drought than models based on the ANN and K-Nearest Neighbors (KNN). However, it has been revealed in several other studies that ANNs are much better as forecasting algorithms. For example, when comparing the overall performance of three ML Deep Neural Networks (DNN), SVM and RF algorithms, for early drought detection, Dao et al. (Citation2021) point out that DNN-based models are more robust than RF and SVM based models and that this superiority is much more pronounced for models with low input data. In another study, Mokhtari and Akhoondzade (Citation2020) compared four ML algorithms (ANN, SVR, RF and the decision tree), for predictive modeling of NDVI. The robustness of ANN-based models was further illustrated.
To address these contradictions, future research will need to focus more on approaches that compare both statistical, ML and hybrid models. The impacts and occurrence of climate extremes such as drought have characteristics typical to each geographical area or sub-area. There is therefore an urgent need for additional scientific efforts to develop predictive models that consider the local sensitivity of agrosystems. The trend in the recent literature on this subject supports this point of view. The enormous contradictions in the skills of the prediction models found in the literature underline the need for comparative efforts at several scales and hydro-climatic contexts. One of the determining factors that can explain the contradictions in the performance of the models, particularly the ML models, is the choice of model hyperparameters and their parameterization. In the literature, some studies are satisfied with default hyperparameters while for others, the models are adjusted by a test process. In addition, it has been reported, importance emphasizes the importance of selecting and identifying predictors in the development of prediction models to arrive at accurate predictions (Bazrafshan et al. Citation2014; Khan et al. Citation2020; Danandeh Mehr et al. Citation2020; Dikshit and Pradhan Citation2021; Aghelpour et al. Citation2021b). In the same way, comparing predictive skills of drought impacts on Random Forest bass and logistic regression, Sutanto et al. (Citation2020) point out that the ability to predict drought impacts using ML is highly dependent on data availability. Indeed, predictive drought modeling requires the integration of massive multi-source data far more than the amount and diversity of data required for the development of descriptive multivariate models. Several studies agree on the importance of the quantity and diversity of data in predictive models to achieve the best performance of data-driven models.
Other in-depth comparative studies (Roushangar et al. Citation2021, Meroni et al. Citation2021; Jiang and Luo Citation2021; Elbeltagi et al. Citation2021, Dao et al. Citation2021; Bouras et al. Citation2021; Aghelpour and Varshavian Citation2021) revealed that unique drought prediction models for both machine learning methods and statistical and/or dynamic methods had limited forecasting performance. In evaluating the performance of 16 ML and 16 Deep Learning (DL) models for weather drought prediction, Jiang and Luo (Citation2021) point out that no single model can achieve the best performance for all evaluation metrics simultaneously. The study by Bali and Singla (Citation2022) recently sufficiently supports the trend towards the increasing use of hybrid models and deep learning techniques as an effective means of prediction especially for crop yields (Van Klompenburg et al. Citation2020). In general, non-stationary models are more reasonable (Liu et al. Citation2020), more accurate and efficient than stationary models. For example, models based on artificial neural networks or the Bayesian model (Nie et al. Citation2021) have outperformed stationary models in several studies. Another study by Dao et al. (Citation2021) found that the use of advanced methods, machine learning and deep learning (DNN, SVM, RF) enabled early drought detection with 97.5% to 100% accuracy while spectral index models had very low early detection accuracy. Roushangar et al. (Citation2021) points out that integrated models could improve the accuracy of predictive modeling by up to 40 and 50%. To address this challenge, hybrid or integrated approaches offer the best prospects at the expense of single model approaches. Among these approaches, those combining remote sensing techniques and artificial intelligence techniques offer the best prospects for multi-scale and multifactorial drought modelling.
Approaches to multivariate spatial and temporal forecasts of agricultural drought are fundamentally derived within the limits of reactive management of drought impacts, in particular inappropriate response times or costs associated with managing impacts, which are often considered very high. When it comes to agricultural drought, proactively managing the expected impacts on agricultural production has been recognized as one of the essential elements for planning appropriate responses and achieving high yields. By allowing the identification of the most vulnerable areas (Sivakumar et al. Citation2021), the assessment and modelling of drought risks make it possible to optimize measures to mitigate the expected impacts. In this perspective, the combined integration of meteorological, hydrological, agricultural, and socio-economic factors is increasingly favored for detective and cartographic modelling of agricultural drought risks using learning techniques (Park et al. Citation2018; Hatami et al. Citation2018; Park et al. Citation2019; Joko Prasety et al. Citation2019; Adede et al. Citation2019; Arabameri et al. Citation2021). Approaches vary depending on the number of variables considered, the type of learning model used, and the response variable to be expected to determine risks. In terms of prediction delays, the most predicted time score is 4 hours (Muñoz et al. Citation2021) and predictions of 1 to 3 months are the most popular (Tadesse et al. Citation2014, Adede et al. Citation2019).
Despite the acceptable performance of some predictive models, an increase in forecast horizons beyond two months would increase model errors to a few exceptional cases (Aghelpour et al. Citation2021b). Indeed, unlike long-term and large-scale expected frequency modelling, short-term modelling of agricultural drought at the local scale is the most difficult aspect of multivariate modelling. Taking this difficulty into account, Park et al. (Citation2018) proposed a complex multivariate approach based on RF and 16 variables for drought prediction on a scale of 10 days in advance. Other studies, such as that of (Rahmati et al. Citation2020), have proposed other new approaches to mapping agricultural drought risks based on an objective comparison of point-learning models (CART, BRT, RF SVM) and multivariate adaptive regression splines and better consideration of hydro-environmental datasets in addition to conventional evidence. Similarly, based on machine learning techniques, another separate study relied on local information (contributions from local experts) in addition to remote sensing data, simulations, and in situ measurements to model weekly maps of drought conditions in the US (Hatami et al. Citation2018).
This approach is one of the few documented approaches in the literature which uses the judgment of local expertise in short-term predictive modelling of drought. Another unique advantage very little documented is that in the US Drought Monitor (USDM) approach, the indicators are incorporated into the model considering their relative importance by area and different times of the year. This implies a better consideration of spatial heterogeneity and temporal variability. In addition, multivariate predictive modelling is also used to predict severe drought areas. Recently, Park et al. (Citation2019), have developed a short-term severe drought prediction model (SDAP) by ignoring rainfall data. The Random Forest algorithm was used for this purpose, to model soil moisture one month in advance by considering in the model several variables grouped into four categories of factors (topographic, thermal, vegetative, and water). In this analysis, thermal factors (NIR, SWIR, TIRS) were more decisive land surface factors in the modelling of the soil moisture deficit index than water (MSI, MNDWI, NDMI), vegetative (EVI, NDVI, MSAVI, SAV), and topographical (slope, TWI) factors.
However, it should be noted that the practical (operational) measures of the inaccuracies of these artificial intelligence models have been poorly studied in the recent literature. In this direction, Rulinda et al. (Citation2012) proposed an approach based on the use of the drought belonging function for quantifying the inaccuracies of vegetative drought in East Africa. Similarly, recently, Dikshit and Pradhan (Citation2021) suggests the use of SHAP algorithms to refine confidence in ML model-based approaches in predictive drought modelling.
4.3. Predictive modelling of expected impacts
Predictive modelling of expected impacts is undoubtedly the most challenging component of multivariate modelling of agricultural drought. The first difficulty in this regard stems essentially from the fact that the fundamental determinants of agricultural drought are characterized by very important temporal and spatial changes that exclude any systematic approaches to the phenomenon. Similarly, the severity of agricultural drought and its quantitative impact are highly dependent on the duration of drought, intensity, and the climate vulnerability of agricultural systems. Several studies on predictive modelling of drought impacts are based on the history of several biophysical and hydroclimatic variables without considering contextual socio-economic vulnerabilities (Enenkel et al. Citation2020; Diaz et al. Citation2021). This suggests that little consideration should be given to the potential impacts that would result from non-climatic factors.
At this level, the question is how to predict and interconnect all dynamics, both human and socio-economic, as well as very heterogeneous spatial realities and anomalies of biophysical and climatic variables likely to have a beneficial and or aggravating effect in the predictive estimation of the impacts of agricultural drought. From the above, it should be noted that although it is possible to accurately model the frequency risk, the quantification of the expected impacts is still subject to factual controversies. In the recent literature, two approaches have been explored on this subject. Modelling predicts drought impacts using indices such as SPI, SPEI, and RDI (Belayneh and Adamowski Citation2013; Mouatadid et al. Citation2018; Sutanto et al. Citation2020; Dikshit et al. Citation2021). These studies examine self-learning methods based on various machine and deep learning algorithms such as artificial neural network (ANN), Random Forest, SVR, or logistic regression. Based on this approach, drought impact functions can be predicted with delays up to seven months in advance (Sutanto et al. Citation2020). In the same year, based on machine learning models (LASSO, Regression, RF, ordinary least squares, AdaBoost), Li et al. (Citation2020a) proposed a long-term predictive drought modelling approach 6, 12, and 24 months in advance based on the SPEI index.
However, in the existing literature, it should be noted that self-learning methods have been poorly applied to remote sensing drought indices to predict the expected impacts of drought. Very recently, other authors have emphasized the importance of multi-sensor predictive modelling of drought impacts based on the assumption that incorporating as many drought-related variables as possible may be appropriate for more accurate quantitative predictions than univariate modelling. In this perspective, based on data from the CMIP6 climate model, Prodhan et al. (Citation2022) proposed a predictive modelling approach to the long-term impacts of drought based on the SPEI in several South Asian countries. Expected yield losses were estimated at 54.15% for rice crops by the overall machine learning model (EML), which distinguished itself by high predictive competence with a maximum R2 of 0.918 significantly higher predictive competence of RF and GBM autonomous methods. In addition, he notes that regardless of the model adopted, the predictive skills of machine learning models tend to decrease as the prediction time increases. The prediction gap can vary from R2 = 0.90 for a one-month prediction to R2 = 0.50 for a three-month prediction (Tadesse et al. Citation2014). Similarly, the ability to predict impacts using machine learning methods is highly dependent on the quality and velocity of data on reported impacts (Sutanto et al. Citation2019; Sutanto et al. Citation2020; Torelló-Sentelles and Franzke Citation2022). In other words, it should be noted that in the current state of knowledge, modelling of the impacts of climate extremes can be established based on machine learning techniques by combining data from climate models, agronomic models, in situ measurements, and spatial remote sensing. As such, the study (Feng et al. Citation2019a) on assessing the impacts of climate extremes on wheat yield in south-eastern Australia lays the foundation for a very promising approach.
4.4. Multivariate analysis of drought frequency
Just like predictive modelling of expected impacts, multivariate modelling of the frequency of agricultural drought provides the information needed for proactive management of the phenomenon. Multivariate analysis of the frequency of drought parameters (intensity, severity, duration, and spatial extent) from periods of a joint return of drought variables makes it possible to quantify the severity of the expected risk (Gupta et al. Citation2020; Ji et al. Citation2022) or the probability of occurrence of impacts (Seo and Kim Citation2021). By identifying high-risk areas and the magnitude of expected droughts, frequency analyses provide essential information for mitigating the potential impacts of drought episodes.
The basic principle of multivariate drought frequency modelling is based on the joint return periods of drought-related variables over a given region from probabilistic or machine learning approaches. However, with the climate changes of recent years, a shortening of return periods as well as exceptional situations are increasingly recorded in several regions of the world. It follows that the extreme peaks of variables, their variabilities, and interdependencies do not follow any statistically modellable law at any scale. For this reason, we are witnessing the emergence of new approaches that favor the incorporation of local and microclimatic variables in the modelling of the frequency dynamics of expected droughts. For example, recently, using the classifiers (Random Forest) and Bagged Decision Tree, (Herrera and Aristizábal Citation2021) modelled the spatial and temporal occurrence of drought in Colombia based on the history of several variables such as LST, precipitation, evapotranspiration, and microclimatic variables.
There is currently no model that provides multivariate frequency modelling by jointly modelling the shifting and highly variable effect of the return periods of the different drought-related variables. The probabilities of occurrence of the extreme peaks of the various variables that condition the occurrence of a drought and the worsening of its intensity are often asynchronous in time and space. For this reason, the period of a joint return of drought-related variables remains difficult to model based on data history. However, the addition of output data from climate models has proven beneficial in multivariate modelling of the projected frequency of agricultural drought.
5. Limitations of the analysis
The scientific completeness of this analysis is limited by a few difficulties. The first difficulty stems from the multifactorial dimension of the phenomenon studied and the diversity and originality of the studies analysed. The dependence of machine learning-based integrated drought monitoring on the selection of training data and their high susceptibility to error for various environmental conditions or climate states makes the comparability of studies difficult. These elements and the absence of the case studies make comparisons of the predictive skills of the different models used in the multivariate modelling of agricultural drought less objective. Each of the studies analysed is to some extent typical in terms of the scientific approach, including the number of variables considered, the types, sources, and velocity of data used, the period of analysis, the prediction times, and the choice of the modelled response variable as a condition of drought. Similarly, in this analysis, we did not document any studies that looked at comparing the relevance of various criteria for assessing machine learning model skills applied to multivariate agricultural drought modelling. A better comparison of the skills of predictive models would be more objective if it relied on several case studies using and comparing the same algorithms on the same data types, variables, time scales, etc. The recent literature on the subject is very heterogeneous in terms of originality and crucially lacks the reproductive applications of the different approaches proposed. This limits the consistency of the various conclusions drawn on this subject.
6. Conclusion and prospects for optimal modelling of agricultural drought
This systematic review analyzes the application of artificial intelligence techniques and multi-sensor remote sensing in multivariate modelling of agricultural drought. Analysis shows that all aspects of agricultural drought have been the subject of factual studies at several levels of scale (plot, local, regional, and global) based on classical machine learning models. The parameters (severity, intensity, duration), as well as the determinants of agricultural drought, were modelled using several approaches combining artificial intelligence techniques, multi-sensor remote sensing, and multi-source auxiliary data.
However, this analysis does not reveal any study of spatial modelling of agricultural drought based on quantum machine learning algorithms. Therefore, future studies on multivariate drought modelling need to explore the potential of quantum learning algorithms. These relatively recent methods would be suitable for the study of the stochastic dynamics of drought. In terms of the skills of machine learning models in spatiotemporal drought modelling, there is no conclusive fact about the merit of a specific model. Regardless of which model is adopted, the predictive skills of machine learning models tend to decrease as prediction time increases, and the saturation of prediction models is often observed above a certain performance threshold. In addition, the performance of the different models used tends to reproduce different performances depending on the context of each study and the adjustments of the hyperparameters used, therefore, selecting an appropriate prediction model remains a challenge due to a lack of clear information about the best model (Prodhan et al. Citation2022). In the diversity of models so far tested, there is no clearly accepted evidence in the literature on the choice of the best model. However, compared to SVM, RNN, SVR or cubist algorithms, the Random Forest algorithm seems to be better suited for multivariate modelling of agricultural drought, but in general, the latest trend shows an increasingly clear superiority of hybrid models over single models of both machine learning and deep learning.
Now, short-term multivariate predictive modelling hours to days in advance can be established (Anshuka et al. Citation2019; Dikshit et al. Citation2022). The shortest prediction score is 4 hours (Muñoz et al. Citation2021) and predictions of 1-3 months are the most popular (Tadesse et al. Citation2014, Adede et al. Citation2019). However, despite the significant results recorded in recent years in predictive drought modelling, no approach has been proposed for predictive modelling of the post-drought recovery phase. Similarly, quantifying the lagged effects of different variables in predictive analyses of agricultural drought is the least important research objective to explore. Studies in this direction could lead to a substantial improvement in the accuracy of predictive models as well as an increase in the short-term prediction time of agricultural drought conditions. Quantum machine learning algorithms for example can be explored for this purpose, for future research (Garcíaa et al. Citation2022). Approaches based on quantum machine learning could also be useful to address the challenge of different return periods of agricultural drought variables in multivariate drought frequency modelling.
Among the ancillary, data that complement data-based analyses of biophysical parameters, social, economic, and environmental determinants such as the cumulative impacts of previous droughts, local forcing, seasonal influence and characteristics of agricultural practices including the influence of chemical stress are very rarely considered in the multivariate modelling of agricultural drought. About, biophysical variables commonly used, thermal factors have proven to be very decisive in the predictive modelling of soil moisture as a variable of responses, and the latter seems to be more adaptable than rainfall for the monitoring or medium-term prediction of agricultural drought. Also, the analysis of existing literature suggests necessary improvements in the spatial resolution of drought-related variables to achieve certain precisions in the operational monitoring of agricultural drought. From this perspective, deep learning models can be explored to derive proxies at the desired resolution by merging multi-source data. In this, the reduction of model space has proven to be beneficial for the skills of predictive models, especially for ANN.
Furthermore, whether it is predictive or descriptive modelling, practical (operational) measures of inaccuracies in artificial intelligence models will need to be further explored in future studies to move from the scientific framework to the operationalization of results.
| Abbreviations Explanation | ||
| ADH | = | Agricultural Drought Hazard |
| AI | = | Artificial Intelligence |
| ANFIS | = | Adaptive Neuro-Fuzzy Inference System |
| ANFIS–PSO | = | Particle Swarm Optimization and Adaptive-Network-Based Fuzzy Inference System |
| ANFIS-FCM | = | Adaptive Neuro-Fuzzy Inference Systems with Fuzzy C-Means Clustering |
| ANN | = | Artificial Neural Network |
| BRT | = | Boosted Regression Trees |
| CARET | = | Classification and Regression Trees |
| CDI | = | Composite Drought Index |
| CDI-M | = | Combined Drought Indicator for Marathwada |
| CDMI | = | Composite Drought Monitoring Index |
| CNN | = | Convolutional neural network |
| ConvLSTM | = | Convolutional long short-term memory |
| CRDI | = | Cloudy Region Drought Index |
| CRSDI | = | Comprehensive Remote Sensing Drought Index |
| DA | = | Dragonfly Algorithm |
| DL | = | Deep Learning |
| DDVS_WS | = | Drought Vulnerability, Drought Severity and Water Shortage |
| DNN | = | Deep Neural Networks |
| DVM | = | Drought Vulnerability Map |
| ENSO | = | El Niño Southern Oscillation |
| ESP | = | Streamflow Prediction |
| EDI | = | Evaporative Drought Index |
| ET | = | Evapotranspiration |
| ETCI | = | Evapotranspiration Condition Index |
| EVI | = | Enhanced Vegetation Index |
| GA | = | Genetic Algorithm |
| GBM | = | Gradient Boosting Machine |
| GBR | = | Gradient Based Routing |
| GCMs | = | General Circulation Models |
| GLDAS | = | Global Land Data Assimilation System |
| GMDH | = | Group Method of Data Handling |
| GPP | = | Gross Primary Productivity |
| GRACE | = | Gravity Recovery and Climate Experiment |
| GRNN | = | General Regression Neural Network |
| HPA | = | Hierarchical Process Analysis |
| HSS | = | Heidke Skill Score |
| ICA | = | Imperialistic Competitive Algorithm |
| IPCC | = | Intergovernmental Panel on Climate Change |
| iTVMDI | = | Improved Soil, Temperature, Vegetation and Moisture Index |
| ISDI | = | Integrated Surface Drought Index |
| JDI | = | Joint Deficit Index |
| KNN | = | K-Nearest Neighbors |
| LAI | = | Leaf Area Index |
| LASSO | = | Least Absolute Shrinkage and Selection Operator |
| LSSVM | = | Least Squares Support Vector Machine |
| LST | = | Land Surface Temperature |
| LSTM | = | Long short-term memory |
| MAPE | = | Mean absolute Percentage Error |
| MCDI | = | Modified Composite Drought Index |
| MEI | = | Multivariate El Niño Index |
| ML | = | Machine Learning |
| MLP | = | Multi-Layer Perceptron Neural network |
| MNDWI | = | Modified Normalized Difference Water Index |
| MSAVI | = | Modified Soil-Adjusted Vegetation Index |
| MSI | = | Moisture Stress Index |
| MSPI | = | Multivariate Standardized Precipitation Index |
| MTSDI | = | Modified Total Storage Deficit Index for Drought Monitoring |
| NAO | = | North Atlantic Oscillation |
| NDMI | = | Normalized Difference Moisture Index |
| NDWI | = | Normalized Difference Water Index |
| NDVI | = | Normalized Difference Vegetation Index |
| NIR | = | Near-infrared |
| NMDI | = | Normalized Multi-band Drought Index |
| NMME | = | North American Multimodel Ensemble |
| NPP | = | Net Primary Productivity |
| OMA | = | Oscilación Multidecadal del Atlántico |
| PCA | = | Principal Component Analysis |
| PCI | = | Precipitation Condition Index |
| PET | = | Potential Evapotranspiration |
| PDSI | = | Palmer Drought Severity Index |
| PSO | = | Particle Swarm Optimization |
| RBFNN | = | Radial Basis Function Neural Network |
| RDI | = | Drought Reconnaissance Index |
| RDSM | = | Relative Departure of Soil Moisture |
| RDVM | = | Relative Drought Vulnerability Maps |
| RF | = | Random Forest |
| RGB | = | Red. Green. and Blue |
| RMSE | = | Root Mean Square Error |
| RNN | = | Recurrent neural networks |
| ROC | = | Receiving Operator Characteristic |
| RRSE | = | Root Relative Squared Erro |
| RSS | = | Real Skills Statistics |
| SAR | = | Synthetic Aperture Radars |
| SAV | = | Submerged Aquatic Vegetation |
| SAVI | = | Soil - Adjusted Vegetation Index |
| SDAP | = | Severe Drought Area Prediction |
| SDCI | = | Scaled Drought Condition Index |
| SDI | = | Synthesized Drought Index |
| SHAP | = | SHapley Additive exPlanations |
| SMI | = | Soil Moisture Index |
| SMOTE | = | Synthetic Minority Over-sampling Technique |
| SPEI | = | Standardized Precipitation Drought Evapotranspiration Index |
| SOI | = | Southern Oscillation Index |
| SPI | = | Standardized Precipitation Index |
| SMDI | = | Soil Moisture Deficit Index |
| SSM | = | Surface Soil Moisture |
| SST | = | Sea Surface Temperature |
| SVI | = | Standardized Vegetation Index |
| SVM | = | Support Vector Machine |
| SVR | = | Support Vector Regression |
| SWIR | = | Short-Wave Infrared |
| SyMAP | = | Synteny Mapping and Analysis Program |
| TCI | = | Temperature Condition Index |
| TDVI | = | Transformed Difference Vegetation Index |
| TIRS | = | Thermal InfraRed Sensor |
| TOC | = | Optical Cloud Thickness |
| TRCI | = | Topical Rainfall Condition Index |
| TVDI | = | temperature-vegetation dryness index |
| TWI | = | Topographic Wetness Index |
| UNDRR | = | United Nations for Disasters Risk Reduction |
| USDM | = | National Drought Mitigation Center |
| VegOut-UBN | = | Higher-Spatial-Resolution Vegetation Outlook |
| VCI | = | Vegetation Condition Index |
| VCI 1M | = | Vegetation Condition Index one month in advance |
| VHI | = | Vegetation Health Index |
| VSDI | = | Very Short-term Drought Index |
| VSWI | = | Vegetation Supply Water Index |
Acknowledgments
We gratefully thank the following research structures: the laboratory (UR 18) of the Department of Geodesy and Topography (IAV Hassan II), the laboratory of UMR CNRS ESPACE 7300 (AMU France), and the Regional Center for Agronomic Research of Marrakech (INRA, Morocco) for their contributions and collaborations in this research. We also thank the Islamic Development Bank for its financial support (scholarship). We extend our thanks and appreciation to the editor of Geomatics, Natural Hazards, and Risk Journal and the reviewers for their valuable comments and recommendations.
Disclosure statement
No potential conflict of interest was reported by the author(s).
Data availability statement
The bibliographic database supporting the conclusions of this study is available from the corresponding author upon reasonable request.
References
- Aadhar S, Mishra V. 2017. High-resolution near real-time drought monitoring in South Asia. Sci Data. 4:170145.
- Adede C, Oboko R, Wagacha PW, Atzberger C. 2019. A mixed model approach to vegetation condition prediction using artificial neural networks ANN: Case of Kenya’s operational drought monitoring. Remote Sens. 11(9):1099.
- AghaKouchak A, Farahmand A, Melton FS, Teixeira J, Anderson MC, Wardlow BD, Hain CR. 2015. Remote sensing of drought: Progress, challenges, and opportunities. Rev Geophys. 53(2):452–480.
- Aghelpour P, Kisi O, Varshavian V. 2021b. Multivariate drought forecasting in short- and long-term horizons using MSPI and data-driven approaches. J Hydrol Eng. 26(4):04021006.
- Aghelpour P, Mohammadi B, Biazar SM, Kisi O, Sourmirinezhad Z. 2020. A theoretical approach for forecasting different types of droughts simultaneously, using entropy theory and machine-learning methods. IJGI. 9(12):701.
- Aghelpour P, Mohammadi B, Mehdizadeh S, Bahrami-Pichaghchi H, Duan Z. 2021a. A novel hybrid dragonfly optimization algorithm for agricultural drought prediction. Stoch Environ Res Risk Assess. 35(12):2459–2477.
- Aghelpour P, Varshavian V. 2021. Forecasting different types of droughts simultaneously using multivariate standardized precipitation index (MSPI), MLP neural network, and imperialistic competitive algorithm (ICA). Complexity. 2021: e6610228.
- Ahmad S, Kalra A, Stephen H. 2010. Estimating soil moisture using remote sensing data: A machine learning approach. Adv Water Resourc. 33(1):69–80.
- Ahmed AAM, Deo RC, Feng Q, Ghahramani A, Raj N, Yin Z, Yang L. 2022. Hybrid deep learning method for a week-ahead evapotranspiration forecasting. Stoch Environ Res Risk Assess. 36(3):831–849.
- Ahmed AAM, Deo RC, Ghahramani A, Raj N, Feng Q, Yin Z, Yang L. 2021. LSTM integrated with Boruta-random forest optimiser for soil moisture estimation under RCP4.5 and RCP8.5 global warming scenarios. Stoch Environ Res Risk Assess. 35(9):1851–1881.
- Ali M, Ghaith M, Wagdy A, Helmi AM. 2022. Development of a new multivariate composite drought index for the Blue Nile River Basin. Water. 14(6):886.
- An J, Li W, Li M, Cui S, Yue H. 2019. Identification and classification of maize drought stress using deep convolutional neural network. Symmetry. 11(2):256.
- Andersson L, Julie W, Phil GL, Jacob W, Suzan M, Brilliant P. 2020. Local early warning systems for drought – Could they add value to nationally disseminated seasonal climate forecasts? Weather and Climate Extrêmes. 28:100241.
- Anshuka A, Buzacott AJV, Vervoort RW, van Ogtrop FF. 2021. Developing drought index–based forecasts for tropical climates using wavelet neural network: an application in Fiji. Theor Appl Climatol. 143(1–2):557–569.
- Anshuka A, van Ogtrop FF, Willem Vervoort R. 2019. Drought forecasting through statistical models using standardised precipitation index: a systematic review and meta-regression analysis. Nat Hazards. 97(2):955–977.
- Arabameri A, Chandra Pal S, Santosh M, Chakrabortty R, Roy P, Moayedi H. 2021. Drought risk assessment: Integrating meteorological, hydrological, agricultural, and socio-economic factors using ensemble models and geospatial techniques. Geocarto Int. 37(21):6087–6115.
- Araneda-Cabrera RJ, Bermúdez M, Puertas J. 2021. Assessment of the performance of drought indices for explaining crop yield variability at the national scale: Methodological framework and application to Mozambique. Agric Water Manage. 246:106692.
- Areffian A, Eslamian S, Sadr MK, Khoshfetrat A. 2021. Monitoring the effects of drought on vegetation cover and ground water using MODIS satellite images and ANN. KSCE J Civ Eng. 25(3):1095–1105.
- Bachmair S, Svensson C, Prosdocimi I, Hannaford J, Stahl K. 2017. Developing drought impact functions for drought risk management. Nat Hazards Earth Syst Sci. 17(11):1947–1960.
- Bae DH, Son KH, Ahn JB, Hong JY, Kim GS, Chung JS, Jung US, Kim JK. 2012. Development of real-time drought monitoring and prediction system on Korea & East Asia region. Atmosphere. 22(2):267–277.
- Bali N, Singla A. 2022. Emerging trends in machine learning to predict crop yield and study its influential factors: A survey. Arch Computat Methods Eng. 29(1):95–112.
- Barrett AB, Duivenvoorde S, Salakpi EE, Muthok JM, Mwangi J, Oliver S, Rowhani P. 2020. Forecasting vegetation condition for drought early warning systems in pastoral communities in Kenya. Remote Sens Environ. 248:111886.
- Bayissa Y, Tadesse T, Demisse G. 2019. Building a high-resolution vegetation outlook model to monitor agricultural drought for the Upper Blue Nile Basin, Ethiopia. Remote Sens. 11(4):371.
- Bayissa Y. 2018. Developing an impact-based combined drought index for monitoring crop yield anomalies in the upper blue Nile Basin, Ethiopia. (1st ed.). London: CRC Press. https://doi.org/10.1201/9780429399510.
- Bazrafshan J, Hejabi S, Rahimi J. 2014. Drought monitoring using the multivariate standardized precipitation index (MSPI). Water Resour Manage. 28(4):1045–1060.
- Bazrafshan J, Nadi M, Ghorbani K. 2015. Comparison of empirical copula-based joint deficit index (JDI) and multivariate standardized precipitation index (MSPI) for drought monitoring in Iran. Water Resour Manage. 29(6):2027–2044.
- Behera P, Sanjay S, Prathima B, Singh P, MS D. 2021. Machine learning based drought prediction system using cloud and IOT. Int J Modern Agric. 10(2):3762–3771.
- Belayneh A, Adamowski J. 2013. Drought forecasting using new machine learning methods. J Water and Land Devel. 18(9):3–12.
- Bento VA, Gouveia CM, DaCamara CC, Libonati R, Trigo IF. 2020. The roles of NDVI and land surface temperature when using the vegetation health index over dry regions. Global Planet Change. 190:103198.
- Bezdan J, Bezdan A, Blagojević B, Mesaroš M, Pejić B, Vranešević M, Pavić D, Nikolić-Đorić E. 2019. SPEI-based approach to agricultural drought monitoring in Vojvodina region. Water. 11(7):1481.
- Bouras Eh, Jarlan L, Er-Raki S, Balaghi R, Amazirh A, Richard B, Khabba S. 2021. Cereal yield forecasting with satellite drought-based indices, weather data and regional climate indices using machine learning in Morocco. Remote Sens. 13(16):3101.
- Bravo RZB, Cunha APMdA, Leiras A, Cyrino Oliveira FL. 2021. A new approach for a drought composite index. Nat Hazards. 108(1):755–773.
- Carrão H, Naumann G, Barbosa P. 2016. Mapping global patterns of drought risk: An empirical framework based on sub-national estimates of hazard, exposure and vulnerability. Global Environ Change. 39:108–124.
- Cartwright JM, Littlefield CE, Michalak JL, Lawler JJ, Dobrowski SZ. 2020. Topographic, soil, and climate drivers of drought sensitivity in forests and shrublands of the Pacific Northwest, USA. Sci Rep. 10(1):18486.
- Chandrasekara SSK, Kwon HH, Vithanage M, Obeysekera J, Kim TW. 2021. Drought in South Asia: A review of drought assessment and prediction in South Asian Countries. Atmosphere. 12(3):369.
- Chatterjee S, Desai AR, Zhu J, Townsend PA, Huang J. 2022. Soil moisture as an essential component for delineating and forecasting agricultural rather than meteorological drought. Remote Sens Environ. 269:112833.
- Chen S, Zhong W, Pan S, Xie Q, Kim T-W. 2020. Comprehensive drought assessment using a modified composite drought index: A case study in Hubei Province, China. Water. 12(2):462.
- Chen W, Huang C, Yang ZL. 2021. More severe drought detected by the assimilation of brightness temperature and terrestrial water storage anomalies in Texas during 2010–2013. J Hydrol. 603:126802.
- Ciemer C, Rehm L, Jürgen KJ, Donner RV, Winkelmann R, Boers N, et 2020. An early-warning indicator for Amazon droughts exclusively based on tropical Atlantic Sea surface temperatures. Environ Res Lett. 15(9):094087.
- Danandeh Mehr A, Torabi Haghighi A, Jabarnejad M, Safari MJS, Nourani V. 2022. A new evolutionary hybrid random forest model for SPEI forecasting. Water. 14(5):755.
- Danandeh Mehr A, Vaheddoost B, Mohammadi B. 2020. ENN-SA: A novel neuro-annealing model for multi-station drought prediction. Comput Geosci. 145:104622.
- Dao PD, He Y, Proctor C. 2021. Plant drought impact detection using ultra-high spatial resolution hyperspectral images and machine learning. Int J Appl Earth Obs Geoinf. 102:102364.
- Das AC, Noguchi R, Ahamed T. 2021. An assessment of drought stress in tea estates using optical and thermal remote sensing. Remote Sens. 13(14):2730.
- Deo RC, Şahin M. 2015. Application of the extreme learning machine algorithm for the prediction of monthly Effective Drought Index in eastern Australia. Atmos Res. 153:512–525.
- Diaz V, Osman AAA, Corzo Perez GA, Van Lanen HAJ, Maskey S, Solomatine D. 2021. Machine-learning approach to crop yield prediction with the spatial extent of drought. Hydrol Earth Syst Sci Discuss: 1–33.
- Diaz V, Perez GAC, Van Lanen HA, Solomatine D. 2018. Intelligent drought tracking for its use in Machine Learning: Implementation and first results. HIC. 3:601–606.
- Dikshit A, Pradhan B, Alamri AM. 2020. Short-term spatio-temporal drought forecasting using random forests model at New South Wales, Australia. Appl Sci. 10(12):4254.
- Dikshit A, Pradhan B, Huete A. 2021. An improved SPEI drought forecasting approach using the long short-term memory neural network. J Environ Manage. 283:111979.
- Dikshit A, Pradhan B, Santosh M. 2022. Artificial neural networks in drought prediction in the 21st century–A scientometric analysis. Appl Soft Comput. 114:108080.
- Dikshit A, Pradhan B. 2021. Interpretable and explainable AI (XAI) model for spatial drought prediction. Sci Total Environ. 801:149797.
- Ebrahimy H, Azadbakht M. 2019. Downscaling MODIS land surface temperature over a heterogeneous area: An investigation of machine learning techniques, feature selection, and impacts of mixed pixels. Comput Geosci. 124:93–102.
- Elbeltagi A, Kumari N, Dharpure J, Mokhtar A, Alsafadi K, Kumar M, Mehdinejadiani B, Ramezani Etedali H, Brouziyne Y, Towfiqul Islam A, et al. 2021. Prediction of combined terrestrial evapotranspiration indexCTEI over large river basin based on machine learning approaches. Water. 13(4):547.
- Elbeltagi A, Zhang L, Deng J, Juma A, Wang K. 2020. Modeling monthly crop coefficients of maize based on limited meteorological data: A case study in Nile Delta, Egypt. Comput Electron Agric. 173:105368.
- Enenkel M, Brown ME, Vogt JV, McCarty JL, Reid Bell A, Guha-Sapir D, Dorigo W, Vasilaky K, Svoboda M, Bonifacio R, et al. 2020. Why predict climate hazards if we need to understand impacts? Putting humans back into the drought equation. Clim Change. 162(3):1161–1176.
- Evkaya OO, Kurnaz FS. 2021. Forecasting drought using neural network approaches with transformed time series data. Appl Stat. 48:13–15.
- Fall CMN, Lavaysse C, Kerdiles H, Dramé S, Roudier P, Gaye AT. 2021. Performance of dry and wet spells combined with remote sensing indicators for crop yield prediction in Senegal. Clim Risk Manage. 33:100331.
- Fan K, Zhang Q, Gu X, Singh VP, Xu C, Shen Z, Wang G. 2022. Global soil moisture drought identification and responses to natural and anthropogenic forcings. J Hydrol. 610:127993. ISSN 0022–1694.
- Feller U, Vaseva II. 2014. Extreme climatic events: impacts of drought and high temperature on physiological processes in agronomically important plants. Front Environ Sci. 2:1–17.
- Feller U. 2016. Drought stress and carbon assimilation in a warming climate: Reversible and irreversible impacts. J Plant Physiol. 203:84–94.
- Feng P, Wang B, Li LD, Waters C, Xiao D, Shi L, Yu Q. 2020. Dynamic wheat yield forecasts are improved by a hybrid approach using a biophysical model and machine learning technique. Agric For Meteorol. 285–286:107922.
- Feng P, Wang B, Li LD, Waters C, Yu Q. 2019a. Incorporating machine learning with biophysical model can improve the evaluation of climate extremes impacts on wheat yield in south-eastern Australia. Agric For Meteorol. 275:100–113.
- Feng P, Wang B, Li LD, Yu Q. 2019b. Machine learning-based integration of remotely sensed drought factors can improve the estimation of agricultural drought in South-Eastern Australia. Agric Syst. 173:303–316.
- Fung KF, Huang YF, Koo CH, Mirzaei M. 2020. Improved SVR machine learning models for agricultural drought prediction at downstream of Langat River Basin, Malaysia. J Water Climate Change. 11(4):1383–1398.
- Fung KF, Huang YF, Koo CH, Soh YW. 2020. Drought forecasting: A review of modelling approaches 2007–2017. J Water and Climate Change. 11(3):771–799.
- Gao Y, Gao M, Damdinsuren B, Dorjsuren M. 2021. Early drought warning based on chlorophyll fluorescence and normalized difference vegetation index in Xilingol League of China. J Appl Rem Sens. 15(3):032006.
- Garcíaa DP, Cruz-Benito J, García-Peñalvo FG. 2022. Systematic literature review: Quantum machine learning and its applications.arXiv preprint arXiv:2201.04093.
- Ghazaryan G, Dubovyk O, Graw V, Kussul N, Schellberg J. 2020. Local-scale agricultural drought monitoring with satellite-based multi-sensor time-series. GISci Remote Sens. 57(5):704–718.
- Gupta C, Ramegowda V, Basu S, Pereira A. 2021. Using network-based machine learning to predict transcription factors involved in drought resistance. Front Genet. 12:652189.
- Gupta V, Kumar JM, Singh VP. 2020. Multivariate modeling of projected drought frequency and hazard over India. J Hydrol Eng. 25(4):04020003.
- Habibie MI, Noguchi R, Matsushita S, Ahamed T. 2020. Development of micro-level classifiers from land suitability analysis for drought-prone areas in Indonesia. Remote Sens Appl: Soc Environ. 20:100421.
- Hajdu I, Yule I, Dehghan-Shear MH. 2018. Modelling of near-surface soil moisture using machine learning and multi-temporal sentinel 1 images in New Zealand. IGARSS 2018 - 2018 IEEE International Geoscience and Remote Sensing Symposium. 1422–1425.
- Han H, Bai J, Yan J, Yang H, Ma G. 2019. A combined drought monitoring index based on multi-sensor remote sensing data and machine learning. Geocarto Int. 36(10):1161–1177.
- Hanadé HI, El Mansouri L, Gadal S, Mansour Badamassi MB, Hadria R. 2022. Prospective analysis of spatial heterogeneity influence on the concordance of remote sensing drought indices: a case of semi-arid agrosystems in Morocco (Moulouya and Tensift watersheds). Geocarto Int:1–26.
- Hanadé HI, El Mansouri L, Hadria R, Emran A, Chehbouni A. 2020. Retrospective analysis and version improvement of the satellite-based drought composite index. A Semi-arid Tensift-Morocco application. Geocarto Int. 37(11):3069–3090.
- Hao Z, Hao F, Singh VP, Ouyang W, Cheng H. 2017. An integrated package for drought monitoring prediction and analysis to aid drought modeling and assessment. Environ Model Soft. 91:199–209.
- Hao Z, Hao F, Singh VP. 2016. A general framework for multivariate multi-index drought prediction based on Multivariate Ensemble Streamflow Prediction (MESP). J Hydrol. 539:1–10.
- Hao Z, Singh VP, Xia Y. 2018. Seasonal drought prediction: Advances, challenges, and future prospects. Rev Geophys. 56(1):108–141.
- Hao Z, Singh VP. 2015. Drought characterization from a multivariate perspective: A review. J Hydrol. 527:668–678.
- Hara P, Piekutowska M, Niedbała G. 2021. Selection of independent variables for crop yield prediction using artificial neural network models with remote sensing data. Land. 10(6):609.
- Hatami P, Luo L, Pei L, Liu X, Wilson T, Tan PN. 2018. Predicting US drought monitor drought categories with multiple land surface models and machine learning. AGU Fall Meeting Abstracts. 2018:H21J–1770.
- Hendrawan Y, Murase H. 2011. Determining an ANN pre-treatment algorithm to predict water content of moss using RGB intensities. Eng Agric Environ Food. 4(4):95–105.
- Herrera D, Aristizábal E. 2021. Artificial Intelligence and machine learning model for spatial and temporal prediction of drought in the Colombia Caribbean region:EG In : EGU General Assembly Conference Abstracts. 2021. p. EGU21-3599.
- Hoque MAA, Pradhan B, Ahmed NS, Md SI. 2021. Agricultural drought risk assessment of Northern New South Wales, Australia using geospatial techniques. Sci Total Environ. 756:143600.
- Hoque MAA, Pradhan B, Ahmed N. 2020. Assessing drought vulnerability using geospatial techniques in northwestern part of Bangladesh. Sci Total Environ. 705:135957.
- Hosseini-Moghari SM, Araghinejad S, Ebrahimi K, Tourian MJ. 2019. Introducing modified total storage deficit index (MTSDI) for drought monitoring using GRACE observations. Ecol Indic. 101:465–475.
- Houborg R, McCabe MF. 2018. A hybrid training approach for leaf area index estimation via Cubist and random forests machine-learning. ISPRS J Photogramm Remote Sens. 135:173–188.
- Huang J, Zhuo W, Li Y, Huang R, Sedano F, Su W, Dong J, Tian L, Huang Y, Zhu D, et al. 2020. Comparison of three remotely sensed drought indices for assessing the impact of drought on winter wheat yield. Int J Digital Earth. 13(4):504–526.
- Huntington JL, Hegewisch KC, Daudert B, Morton CG, Abatzoglou JT, McEvoy DJ, Erickson T. 2017. Climate engine: Cloud computing and visualization of climate and remote sensing data for advanced natural resource monitoring and process understanding. Bull Am Meteorol Soc. 98(11):2397–2410.
- Ji Y, Li Y, Yao N, Biswas A, Chen X, Li L, Pulatov A, Liu F. 2022. Multivariate global agricultural drought frequency analysis using kernel density estimation. Ecol Eng. 177:106550.
- Jiang W, Luo J. 2021. An evaluation of machine learning and deep learning models for drought prediction using weather data. Computer Sci. 43(3):3611–3626.
- Jiao W, Wang L, McCabe MF. 2021. Multi-sensor remote sensing for drought characterization: Current status, opportunities and a roadmap for the future. Remote Sens Environ. 256:112313.
- Jiménez-Donaire M, Giráldez JV, Vanwalleghem T. 2020. Evaluation of drought stress in cereal through probabilistic modelling of soil moisture dynamics. Water. 12(9):2592.
- Joko Prasety SY, Dwi Hartomo K, Paseleng MC, Widiyanto CD, Simanjuntak BH. 2019. The machine learning to detect drought risk in Central Java using landsat 8 OLI remote sensing images. 2019 5th International Conference on Science and Technology ICST. 1:1–6.
- Jung J, Maeda M, Chang A, Bhandari M, Ashapure A, Landivar-Bowles J. 2021. The potential of remote sensing and artificial intelligence as tools to improve the resilience of agriculture production systems. Curr Opin Biotechnol. 70:15–22.
- Kaur A, Sood SK. 2020. Deep learning-based drought assessment and prediction framework. Ecol Inf. 57:101067.
- Kavitha M, Ramteke G, Kamalakar Reddy A, Narender N. 2018. Integrated approach for local level drought assessment and risk reduction. Proceedings of International Conference on Remote Sensing for Disaster Management. p. 265–279.
- Ke Y, Im J, Park S, Gong H. 2016. Downscaling of MODIS one kilometer evapotranspiration using landsat-8 data and machine learning approaches. Remote Sens. 8(3):215.
- Khan N, Sachindra DA, Shahid S, Ahmed K, Shiru MS, Nawaz N. 2020. Prediction of droughts over Pakistan using machine learning algorithms. Adv Water Resour. 139:103562.
- Khan R, Gilani H. 2021. Global drought monitoring with drought severity index DSI using Google Earth Engine. Theor Appl Climatol. 146(1–2):411–427.
- Khosravi I, Akhondzadeh M, Khoshgoftaar MM. 2015. Modelling and predicting the drought indices time series using machine learning methods in order to managing hazardscase study: Eastern District of Isfahan. Environ Manage Hazards. 2(1):51–65.
- Kim JE, Yu J, Ryu JH, Lee JH, Kim TW. 2021. Assessment of regional drought vulnerability and risk using principal component analysis and a Gaussian mixture model. Nat Hazards. 109(1):707–724.
- Kirasich K, Smith T, Sadler B. 2018. Random Forest vs logistic regression: binary classification for heterogeneous datasets. SMU Data Sci. Rev. 1(3):1–25.
- Kisi O, Gorgij AD, Zounemat-Kermani M, Mahdavi-Meymand A, Kim S. 2019. Drought forecasting using novel heuristic methods in a semi-arid environment. J Hydrol. 578:124053.
- Krishnamurthy RP, Fisher JB, Schimel DS, Kareiva PM. 2020. Applying tipping point theory to remote sensing science to improve early warning drought signals for food security. Earth’s Future. 8(3):e2019EF001456.
- Kulkarni SS, Wardlow BD, Bayissa YA, Tadesse T, Svoboda MD, Gedam SS. 2020. Developing a remote sensing-based combined drought indicator approach for agricultural drought monitoring over Marathwada, India. Remote Sensing. 12(13):2091.
- Kuswanto H, Naufal A. 2019. Evaluation of performance of drought prediction in Indonesia based on TRMM and MERRA-2 using machine learning methods. MethodsX. 6:1238–1251.
- Lee J, Hwang Y, Kim T. 2020. Forecasting drought indices using machine learning algorithm. https://peer.asee.org/34680.
- Lees T, Tseng G, Reece S, Dadson S. 2020. Deep learning for drought and vegetation health: Demonstrating the utility of an entity-aware LSTM. In: EGU General Assembly Conference Abstracts. 2020. p. 8173.
- Leroux L, Castets M, Baron C, Escorihuela M, Bégué A, Seen DL. 2019. Maize yield estimation in West Africa from crop process-induced combinations of multi-domain remote sensing indices. Eur J Agron. 108:11–26.
- Li j, Zhang S, Huang L, Zhang T, Feng P. 2020a. Drought prediction models driven by meteorological and remote sensing data in Guanzhong Area, China. Hydrol Res. 51(5):942–958.
- Li W, Wang Y, Yang J. 2020c. Cloudy Region Drought Index (CRDI) based on long-time-series Cloud Optical Thickness (COT) and Vegetation Conditions Index (VCI): A case study in Guangdong, South Eastern China. Remote Sens. 12(21):3641.
- Li Z, Han Y, Hao T. 2020b. Assessing the consistency of remotely sensed multiple drought indices for monitoring drought phenomena in continental China. IEEE Trans Geosci Remote Sensing. 58(8):5490–5502.
- Li Z, Zhang Z, Zhang L. 2021. Improving regional wheat drought risk assessment for insurance application by integrating scenario-driven crop model, machine learning, and satellite data. Agric Syst. 191:103141.
- Liu X, Feng X, Ciais P, Fu B, Hu B, Sun Z. 2020a. GRACE satellite-based drought index indicating increased impact of drought over major basins in China during 2002–2017. Agric For Meteorol. 291:108057.
- Liu X, Zhu X, Pan Y, Bai J, Li S. 2018. Performance of different drought indices for agriculture drought in the North China Plain. J Arid Land. 10(4):507–516.
- Liu X, Zhu X, Zhang Q, Yang T, Pan Y, Sun P. 2020b. A remote sensing and artificial neural network-based integrated agricultural drought index: Index development and applications. CATENA. 186:104394.
- Maity R, Khan MI, Sarkar S, Dutta R, Maity SS, Pal M, Chanda K. 2021. Potential of Deep Learning in drought assessment by extracting information from hydrometeorological precursors. J Water and Climate Change. 12(6):2774–2796.
- Mann ML, Warner JM, Malik AS. 2019. Predicting high-magnitude, low-frequency crop losses using machine learning: An application to cereal crops in Ethiopia. Clim Change. 154(1–2):211–227.
- Meroni M, Waldnera F, Seguinia L, Kerdiles H, Rembolda F. 2021. Yield forecasting with machine learning and small data: what gains for grains? European Commission. Joint Research Centre JRC, via E. Fermi. 2749:21027.
- Mishra AK, Singh VP. 2010. A review of drought concepts. J Hydrol. 391(1–2):202–216.
- Mishra AK, Singh VP. 2011. Drought modeling – A review. J Hydrol. 403(1–2):157–175.
- Mo K, Lyon B. 2015. Global meteorological drought prediction using the North American multi-model ensemble. J Hydrometeorol. 16(3):1409–1424.
- Mokhtar A, Jalali M, He H, Al-ansari N, Elbeltagi A, Alsafadi K, Ghassan Abdo H, Sammen S, Sh. Gyasi-Agyei Y, Rodrigo-Comino J. 2021. Estimation of SPEI meteorological drought using machine learning algorithms. IEEE Access. 9:65503–65523.
- Mokhtari M, Akhoondzade R. 2020. Data fusion and machine learning algorithms for drought forecasting using. J Earth and Space Phys. 46:231–246.
- Moshou D, Pantazi XE, Kateris D, Gravalos I. 2014. Water stress detection based on optical multisensor fusion with a least squares support vector machine classifier. Biosyst Eng. 117:15–22.
- Mouatadid S, Raj N, Deo RC, Adamowski JF. 2018. Input selection and data-driven model performance optimization to predict the Standardized Precipitation and Evaporation Index in a drought-prone region. Atmos Res. 212:130–149.
- Muñoz P, Orellana-Alvear J, Célleri R. 2021. Application of a machine learning technique for developing short-term flood and drought forecasting models in tropical mountainous catchments. In: Djalante R, Bisri MBF, Shaw R, éditors. Integrated research on disaster risks: Contributions from the IRDR young scientists programme. Springer International Publishing; p. 11–35. Cham: Springer.
- Naumann G, Dutra E, Barbosa P, Pappenberger F, Wetterhall F, Vogt JV. 2014. Comparison of drought indicators derived from multiple data sets over. Hydrol Earth Syst Sci. 18(5):1625–1640.
- Nguyen ST, Chen Cf, Chen CR. 2017. Agricultural drought assessment using remotely sensed data in Central America. In: AGU Fall Meeting Abstracts, B51C–1806.
- Nie M, Huang S, Leng G, Zhou Y, Huang Q, Dai M. 2021. Bayesian-based time-varying multivariate drought risk and its dynamics in a changing environment. CATENA. 204:105429.
- Orimoloye IR, Belle JA, Olusola AO, Busayo Et, Ololade OO. 2020. Spatial assessment of drought disasters, vulnerability, severity, and water shortages: a potential drought disaster mitigation strategy. Natural Hazards. 105(3):2735–2754.
- Panis M, van Gelder P, Van Den Homberg M, Nechita N, Teklesadik A, Schoups G, van der Vliet M, Winsemius H. 2019. Assessing the forecast skill of agricultural drought from satellite-derived products in the Lower Shire River Basin. In : Geophysical Research Abstracts. Vol. 21.
- Park H, Kim K, Lee DK. 2019. Prediction of severe drought area based on random forest: Using satellite image and topography data. Water. 11(4):705.
- Park S, Im J, Han D, Rhee J. 2020. Short-term forecasting of satellite-based drought indices using their temporal patterns and numerical model output. Remote Sens. 12(21):3499.
- Park S, Im J, Jang E, Rhee J. 2016. Drought assessment and monitoring through blending of multi-sensor indices using machine learning approaches for different climate regions. Agric For Meteorol. 216:157–169.
- Park S, Im J, Park S, Rhee J. 2017. Drought monitoring using high resolution soil moisture through multi-sensor satellite data fusion over the Korean peninsula. Agric For Meteorol. 237–238:257–269.
- Park S, Seo E, Kang D, Im J, Lee MI. 2018. Prediction of drought on pentad scale using remote sensing data and MJO index through random forest over East Asia. Remote Sens. 10(11):1811.
- Petersen LK. 2018. Real-time prediction of crop yields from MODIS relative vegetation health: A continent-wide analysis of Africa. Remote Sens. 10(11):1726.
- Petersen-Perlman JD, Aguilar-Barajas I, Megdal SB. 2022. Drought and groundwater management: Interconnections, challenges, and policyresponses. Curr Opin Environ Sci Health. 28:100364–105844.
- Pham BT, Le LM, Le TT, Bui KTT, Le VM, Ly HB, Prakash I. 2020. Development of advanced artificial intelligence models for daily rainfall prediction. Atmos Res. 237:104845.
- Phillips AJ, Newlands NK, Liang SH, Ellert BH. 2014. Integrated sensing of soil moisture at the field-scale: Measuring, modelling, and sharing for improved agricultural decision support. Comput Electron Agric. 107:73–88.
- Prodhan FA, Zhang J, Hasan SS, Sharma TPP, Mohana HP. 2022. A review of machine learning methods for drought hazard monitoring and forecasting: Current research trends, challenges, and future research directions. Environ Model Software. 149:105327–108152.
- Prodhan FA, Zhang J, Sharma TPP, Nanzad L, Zhang D, Seka AM, Ahmed N, Hasan SS, Hoque MZ, Mohana HP. 2022. Projection of future drought and its impact on simulated crop yield over South Asia using ensemble machine learning approach. Sci Total Environ. 807(Pt 3):151029.
- Prodhan FA, Zhang J, Yao F, Shi L, Pangali Sharma TP, Zhang D, Ca D, Zheng M, Ahmed N, Mohana HP. 2021. Deep learning for monitoring agricultural drought in South Asia using remote sensing data. Remote Sens. 13(9):1715.
- Rahmati O, Falah F, Dayal KS, Deo RC, Mohammadi F, Biggs T, Moghaddam DD, Naghibi SA, Bui DT. 2020. Machine learning approaches for spatial modelling of agricultural droughts in the south-east region of Queensland Australia. Sci Total Environ. 699:134230.
- Rajsekhar D, Singh VP, Mishra AK. 2015. Multivariate drought index: An information theory-based approach for integrated drought assessment. J Hydrol. 526:164–182.
- Ramos-Giraldo P, Reberg-Horton C, Locke AM, Mirsky S, Lobaton E. 2020. Drought stress detection using low-cost computer vision systems and machine learning techniques. IT Prof. 22(3):27–29.
- Raza O, Memon M, Bhatti S, Pathan N. 2021. Drought prediction with raw satellite imagery and ensemble supervised machine learning. Rev Environ Earth Sci. 8(1):1–7.
- Rhee J, Im J. 2017. Meteorological drought forecasting for ungauged areas based on machine learning: Using long-range climate forecast and remote sensing data. Agric For Meteorol. 237–238:105–122.
- Richman MB, Leslie LM. 2018. The 2015-2017 Cape Town drought: Attribution and prediction using machine learning. Proc Comput Sci. 140:248–257.
- Roushangar K, Ghasempour R, Ozgur Kirca VS, Cüneyd Demire M. 2021. Hybrid point and interval prediction approaches for drought modelling using ground-based and remote sensing data. Hydrol Res. 52(6):1469–1489.
- Rulinda CM, Dilo A, Bijker W, Stein A. 2012. Characterising and quantifying vegetative drought in East Africa using fuzzy modelling and NDVI data. J Arid Environ. 78:169–178.
- Saha S, Gogoi P, Gayen A, Paul GC. 2021. Constructing the machine learning techniques based spatial drought vulnerability index in Karnataka state of India. J Cleaner Prod. 314:128073.
- Samadianfard SM, Ghorbani MA, Mohammadi B. 2018. Forecasting soil temperature at multiple-depth with a hybrid artificial neural network model coupled-hybrid firefly optimizer algorithm. Information Process Agricul. 5(4):465–476.
- Samantaray AK, Singh G, Ramadas M. 2019. Application of the relevance vector machine to drought monitoring. In: Bansal JC, Das KN, Nagar A, Deep K, Ojha AK, editors. Soft computing for problem solving. Singapore: Springer; p. 891–898.
- Schmitter P, Steinrücken J, Römer C, Ballvora A, Léon J, Rascher U, Plümer L. 2017. Unsupervised domain adaptation for early detection of drought stress in hyperspectral images. ISPRS J Photogrammetr Remote Sens. 131:65–76.
- Schwartz C, Ellenburg WL, Mishra V, Mayer T, Griffin R, Qamer F, Matin M, Tadesse T. 2022. A statistical evaluation of Earth-observation-based composite drought indices for a localized assessment of agricultural drought in Pakistan. Int J Appl Earth Obs Geoinf. 106:102646.
- Seo J, Kim Y. 2021. Assessing likelihood of drought impact occurrence in South Korea through machine learning. Proceedings of the Korea Water Resources Association Conference. p. 77.
- Shah D, Mishra V. 2020. Integrated Drought Index IDI for drought monitoring and assessment in India. Water Resour Res. 56(2):e2019WR026284.
- Shahabfar A, Ghulam A, Eitzinger J. 2012. Drought monitoring in Iran using the perpendicular drought indices. Int J Appl Earth Obs Geoinf. 18:119–127.
- Shamshirband S, Hashemi S, Salimi H, Samadianfard S, Asadi E, Shadkani S, Kargar K, Mosavi A, Nabipour N, Chau K-W. 2020. Predicting standardized streamflow index for hydrological drought using machine learning models. Eng Appl Comput Fluid Mech. 14(1):339–350.
- Shen R, Huang A, Li B, Guo J. 2019. Construction of a drought monitoring model using deep learning based on multi-source remote sensing data. Int J Appl Earth Obs Geoinf. 79:48–57.
- Shojaei S, Rahimzadegan M. 2022. Improving a comprehensive remote sensing drought index (CRSDI) in the Western part of Iran. Geocarto Int. 37(5):1318–1336.
- Singh R, Kumari M, Bindal S, Gupta I. 2022. Quantification of drought condition using drought indices: A review. In: Kolathayar S, Mondal A, Chian SC, editors. Climate change and water security. Lecture notes in civil engineering. Singapore: Springer. vol. 178. p. 231–241.
- Singh TP, Nandimath P, Kumbhar V, Das S, Barne P. 2021. Drought risk assessment and prediction using artificial intelligence over the southern Maharashtra state of India. Model Earth Syst Environ. 7(3):2005–2013.
- Sivakumar VL, Radha Krishnappa R, Nallanathel M. 2021. Drought vulnerability assessment and mapping using multi-Criteria decision making MCDM and application of Analytic Hierarchy process AHP for Namakkal District, Tamilnadu, India. Mater Today: Proc. 43:1592–1599.
- Son B, Park S, Im J, Park S, Ke Y, Quackenbush LJ. 2021. A new drought monitoring approach: Vector projection analysis VPA. Remote Sens Environ. 252:112145.
- Song Y, Wang J, Ge YX, Chengdong X. 2020. An optimal parameters-based geographical detector model enhances geographic characteristics of explanatory variables for spatial heterogeneity analysis: cases with different types of spatial data. GISci Remote Sens. 57(5):593–610.
- Su J, Coombes M, Liu C, Zhu Y, Song X, Fang S, Guo L, Chen WH. 2020. Machine learning-based crop drought mapping system by UAV remote sensing RGB imagery. Un Sys. 8(1):71–83.
- Sultana MS, Gazi MY, Mia MB. 2021. Multiple indices based agricultural drought assessment in the northwestern part of Bangladesh using geospatial techniques. Environ Challenges. 4:100120.
- Sun P, Zhang Q, Wen Q, Singh VP, Shi P. 2017. Multisource data-based integrated agricultural drought monitoring in the Huai River Basin, China. J Geophys Res Atmos. 122(20):10,751–10,772.
- Sutanto SJ, van der Weert M, Wanders N, Blauhut V, Van Lanen HA. 2019. Moving from drought hazard to impact forecasts. Nat Commun. 10(1):1–7.
- Sutanto SJ, Weert M, van der Blauhut V, Van Lanen HA. 2020. Skill of large-scale seasonal drought impact forecasts. Nat Hazards Earth Syst Sci. 20(6):1595–1608.
- Svoboda M, Fuchs B. 2016. Handbook of drought indicators and indices. Geneva, Switzerland: World Meteorological Organization (WMO).
- Tadesse T, Demisse GB, Zaitchik B, Dinku T. 2014. Satellite-based hybrid drought monitoring tool for prediction of vegetation condition in Eastern Africa: A case study for Ethiopia. Water Resour Res. 50(3):2176–2190.
- Thober S, Kumar R, Sheffield J, Mai J, Schäfer D, Samaniego L. 2015. Seasonal soil moisture drought prediction over Europe using the North American multi-model ensemble NMME. J Hydrometeorol. 16(6):2329–2344.
- Tian Y, Xu YP, Wang G. 2018. Agricultural drought prediction using climate indices based on support vector regression in Xiangjiang River basin. Sci Total Environ. 622–623:710–720.
- Torelló-Sentelles H, Franzke CLE. 2022. Drought impact links to meteorological drought indicators and predictability in Spain. Hydrol Earth Syst Sci. 26(7):1821–1844.
- Van Klompenburg T, Kassahun A, Catal C. 2020. Crop yield prediction using machine learning: A systematic literature review. Comput Electron Agric. 177:105709.
- Vyas SS, Bhattacharya BK. 2020. Agricultural drought early warning from geostationary meteorological satellites: concept and demonstration over semi-arid tract in India. Environ Monit Assess. 192(5):311.
- Wang J, Yu Y. 2021. Comprehensive drought monitoring in Yunnan Province China using multisource remote sensing data. J Mt Sci. 18(6):1537–1549.
- Wang L, Fang S, Pei Z, Wu D, Zhu Y, Zhuo W. 2022. Developing machine learning models with multisource inputs for improved land surface soil moisture in China. Comput Electron Agric. 192:106623.
- Wang Z, Guo P, Wan H, Tian F, Wang L. 2020. Integration of microwave and optical/infrared derived datasets from multi-satellite products for drought monitoring. Water. 12(5):1504.
- Wei W, Pang S, Wang X, Zhou L, Xie B, Zhou J, Li C. 2020. Temperature Vegetation Precipitation Dryness Index (TVPDI)-based dryness-wetness monitoring in China. Remote Sens Environ. 248:111957.
- West H, Quinn N, Horswell M. 2019. Remote sensing for drought monitoring & impact assessment: Progress, past challenges, and future opportunities. Remote Sens Environ. 232:111291.
- Wildemeersch JCJ, Garba M, Sabiou M, Fatondji D, Cornelis WM. 2015. Agricultural drought trends and mitigation in Tillaberí, Niger. Soil Sci Plant Nutr. 61(3):414–425.
- Wu J, Zhou L, Liu M, Zhang J, Leng S, Diao C. 2013. Establishing and assessing the Integrated Surface Drought Index ISDI for agricultural drought monitoring in mid-eastern China. Int J Appl Earth Obs Geoinf. 23:397–410.
- Wu J, Zhou L, Mo X, Zhou H, Zhang J, Jia R. 2015. Drought monitoring and analysis in China based on the Integrated Surface Drought Index ISDI. Int J Appl Earth Obs Geoinf. 41:23–33.
- Xie X, Li A, Tan J, Lei G, Jin H, Zhang Z. 2020. Uncertainty analysis of multiple global GPP datasets in characterizing the lagged effect of drought on photosynthesis. Ecol Indic. 113:106224.
- Xu Y, Zhang X, Hao Z, Hao F, Li C. 2022. Systematic assessment of the development and recovery characteristics of hydrological drought in a semi-arid area. Sci Total Environ. 836:155472–159697.
- Yang Y, Guan H, Batelaan O, McVicar TR, Long D, Piao S, Liang W, Liu B, Jin Z, Simmons CT. 2016. Contrasting responses of water use efficiency to drought across global terrestrial ecosystems. Sci Rep. 6(1):23284.
- Yuan Q, Li S, Yue L, Li T, Shen H, Zhang L. 2019. Monitoring the variation of vegetation water content with machine learning methods: Point–surface fusion of MODIS products and GNSS-IR observations. Remote Sens. 11(12):1440.
- Yuan X, Wood EF. 2013. Multimodel seasonal forecasting of global drought onset. Geophys Res Lett. 40(18):4900–4905.
- Yuan ZM, Tan XS. 2010. Nonlinear screening indicators of drought resistance at seedling stage of rice based on support vector machine. Acta Agronomica Sinica. 36(7):1176–1182.
- Zambrano F, Vrieling A, Nelson A, Meroni M, Tadesse T. 2018. Prediction of drought-induced reduction of agricultural productivity in Chile from MODIS, rainfall estimates and climate oscillation indices. Remote Sens Environ. 219:15–30.
- Zhang G, Rui X, Poslad S, Song X, Fan Y, Ma Z. 2019. Large-scale, fine-grained, spatial, and temporal analysis, and prediction of mobile phone users’ distributions based upon a convolution long short-term model. Sensors. 19(9):2156.
- Zhang L, Jiao W, Zhang H, Huang C, Tong Q. 2017. Studying drought phenomena in the continental United States in 2011 and 2012 using various drought indices. Remote Sens Environ. 190:96–106.
- Zhang Q, Shi R, Singh VP, Xu CY, Yu H, Fan K, Wu Z. 2022. Droughts across China: Drought factors, prediction, and impacts. Sci Total Environ. 803:150018.
- Zhang X, Hao Z, Singh VP, Zhang Y, Feng S, Xu Y, Hao F. 2022. Drought propagation under global warming: Characteristics, approaches, processes, and controlling factors. Sci Total Environ. 838(2):0048–9697.
- Zhang Y, Hao Z, Feng S, Zhang X, Xu Y, Hao F. 2021. Agricultural drought prediction in China based on drought propagation and large-scale drivers. Agric Water Manage. 255:107028.
- Zhong S, Di L, Sun Z, Xu Z, Guo L. 2019. Investigating the long-term spatial and temporal characteristics of vegetative drought in the contiguous United States. IEEE J Sel Top Appl Earth Observ Remote Sens. 12(3):836–848.
- Zhou L, Wu J, Zhang J, Leng S, Liu M, Zhang J, Zhao L, Zhang F, Shi Y. 2013. The integrated surface drought index ISDI as an indicator for agricultural drought monitoring: Theory, validation, and application in mid-eastern China. IEEE J Sel Top Appl Earth Observ Remote Sens. 6(3):1254–1262.
- Zhou Y, Dong J, Xiao X, Liu R, Zou Z, Zhao G, Ge Q. 2019. Continuous monitoring of lake dynamics on the Mongolian Plateau using all available Landsat imagery and Google Earth Engine. Sci Total Environ. 689:366–380.
- Zhu Q, Luo Y, Xu YP, Tian Y, Yang T. 2019. Satellite soil moisture for agricultural drought monitoring: Assessment of SMAP-derived soil water deficit index in Xiang River Basin, China. Remote Sens. 11(3):362.
- Zhuang S, Wang P, Jiang B, Li M, Gong Z. 2017. Early detection of water stress in maize based on digital images. Comput Electron Agric. 140:461–468.