
 ?Mathematical formulae have been encoded as MathML and are displayed in this HTML version using MathJax in order to improve their display. Uncheck the box to turn MathJax off. This feature requires Javascript. Click on a formula to zoom.
Abstract
Building an oil spill segmentation model is very challenging because of the limited available information on oil spill accidents. Therefore, this paper proposes a custom data generator based on Segmentation Network (Seg-Net) model implemented in Conditional Generative Adversarial Network (CGAN). The proposed model is trained for oil spill segmentation using 50 Sentinal-1 Synthetic Aperture Radar (SAR) images. The proposed model employs a modified Seg-Net as a generator to produce high-quality oil spills’ images and a Patch-GAN as discriminator. This architecture results in a significant improvement of the final oil segmentation results, in comparison with Seg-Net model, while using relatively small training dataset. For performance assessment, the paper presents the oil spills segmentation results of four suggested models using Sentinel-1 SAR images. The presented models are U-Net, Seg-Net, CGAN, and a Seg-Net-based CGAN the performance assessment reveals that the proposed model produces oil spill segmentation images with an average accuracy of 99.04%, Intersection over Union (IoU) index of 96.59%, and a precision of 85.24%. In addition, the training time required for the proposed model is 3 h 20 min per 50 epochs, while it is nearly 10 h and 55 min for training a CGAN model.
1. Introduction
Oil pollutants are the most common and influential source of all marine pollutions due to their widespread, unpredicted occurrence and its harmful effects to all marine life (Elmgren, Citation2001; Tang et al. Citation2019), which requires the development of major accident indicators in the offshore petroleum sector to better engage the emerging and complex challenges in preventing major offshore accidents (Zhen et al. Citation2022). These characteristics raised the need of a robust monitoring technique for early detection and identification of oil spills which are considered major environmental hazard, that requires an effective risk management operation to support early response and informed decision-making processes to contain the damaging effects of oil spill incidents (Laine et al. 2019). The crude oil spills in open waters are greatly affected by ocean currents, waves and wind drifts which requires a monitoring technique characterized by accuracy, wide coverage, high temporal frequency and cost effectiveness.
These requirements are greatly fulfilled by remote sensing techniques (Brekke & Solberg, Citation2005), which witnessed an outstanding level of technological advancement during the last few years by the emergence of a plethora of highly accurate and versatile remote sensing sensors with freely accessed data. One of the most reliable satellite sensors is active or radar sensors, such as Synthetic Aperture Radar (SAR). The SAR sensors are characterized by its all-day-all-weather sensing capabilities which is considered a key asset in crucial monitoring tasks such as oils spills’ and with the added advantages of short revisit times of some satellites like Seneintel-1 (A/B), SAR became the first choice regarding urgent and critical monitoring tasks (Alpers et al. Citation2017). The basic principle of oil spill detection is identified by their scattering traits which appears as dark spots over the ocean in SAR images. However, even though SAR is capable of distinguishing oil spills from the surface of sea water, the biggest challenge is the ambiguity between oil spills and lookalikes caused by low wind speed, algae blooms, weed beds, wave shadows behind land, etc. since both appear as black or dark areas on the SAR image (Magrì et al. Citation2021).
Recently, the utilization of deep learning techniques in remote sensing applications has gained wide traction which is attributed to the availability of large remote sensing datasets, the advancements in computers processing capabilities and the introduction of data cloud processing (Xiao et al. Citation2022). Different deep learning (DL) models have been presented with distinguished neural network architectures, such as, convolutional neural network (CNN) which is the most widely used DL model for image processing, followed by auto-encoder (AE). These two architectures are characterized by their ability to reduce the number of required trained parameters while retaining an high level of modeling accuracy which is considered an important asset for oil spills detection and segmentation (Alzubaidi et al. Citation2021). Only a few research studies have employed other DL models, such as deep belief network (DBN), recurrent neural network (RNN), and conditional generative adversarial networks (CGANs) (Oussidi & Elhassouny, Citation2018). Guo et al. (Citation2018), employed Seg-Net as a semantic segmentation model to detect dark spots in oil spill areas using a data set consisting of 4200 patches from five raw SAR images. When compared to fully convolutional networks (FCNs) and other segmentation methods, their proposed method was found to be more robust for high noisy and fuzzy border conditions. Badrinarayanan et al. (Citation2015), proposed using Seg-Net deep FCN architecture for pixel-wise semantic segmentation, which proofed to perform competitively, achieving accurate results for road images analysis when compared with FCN, DeepLab-LargeFOV, and Deconv-Net. Zou et al. (Citation2020), presented Feature Merge Networks (FMNet) for images segmentation to identify oil spills and look-alike areas. The proposed model improved U-Shaped Network (U-Net) model accuracy reaching 61.90% and solved the overfitting problem. Singha et al. (Citation2013), utilized two different ANN algorithms using SAR images to distinguish between look-alikes and oil spills. Their proposed technique outperforms the conventional edge detection and adaptive thresholding algorithms. Krestenitis et al. (Citation2019), proposed deep convolutional neural networks (DCNNs) for semantic segmentation. Their presented results indicate that DCNN segmentation models can be used to build effective oil spill detectors. Ma et al. (Citation2021), focused on integrating DCNN with multilayer features to identify oil spills using 36 Sentinel-1 duals-polarimetric images. The enhanced DeepLabv3+ model, which uses ResNet-101 as the main network and GN as the normalization layer, often outperformed the other traditional DCNN semantic segmentation algorithms. Furthermore, it was demonstrated by the experimental results that multilayer features, such as the polarization covariance matrix and the H/A/alpha decomposition variables, can be used to identify oil spills from lookalikes. Li et al. (Citation2021) developed a multiscale conditional adversarial network (MCAN) composed of several adversarial networks, each of which consisted of a generator and a discriminator. Only four training data pairs were required to generate reliable detection maps. However, their proposed technique fails to perform effectively on images, even when there is no pollution or only a small percentage of oil spills. It is challenging to collect large oil spills observation dataset due to the scarcity of reported cases, and since DL algorithms depends on large training datasets to guarantee accurate modeling results, the oil spills detection and segmentation remains a challenge in the literature (Artuso & Guijt, Citation2020).
In this article, a deep neural network segmentation model for oil spills in open waters is proposed. The proposed model is built on the Conditional Generative Adversarial Network (CGAN), a promising ANN architecture that excels at accurate segmentation utilizing small training data sets, (Pan et al. Citation2020). This research presents the performance of four Convolution Neural Network (CNN) based models for oil spill segmentation and proposes a variant of CNN by combining Seg-Net architecture and CGAN which was proved to be highly effective in oil spill segmentation using SAR images. For the first stage of our work for segmenting oil spills, Seg-Net and U-Net models were separately trained to evaluate their performance and segmentation accuracies. As a result of this evaluation, the Seg-Net model is presented as it has demonstrated remarkable efficiency in reducing model training time and the quality of the segmented image. To enhance the quality of the produced image, adversarial learning was utilized as a second stage, the results improved significantly when employing the suggested Seg-Net model as a CGAN generator. The comparison results between U-Net, Seg-Net, CGAN with U-Net as a generator, and the modified CGAN which utilizes the proposed Seg-Net model as a generator are introduced in detail during the research.
2. Study area and dataset
2.1. Study area
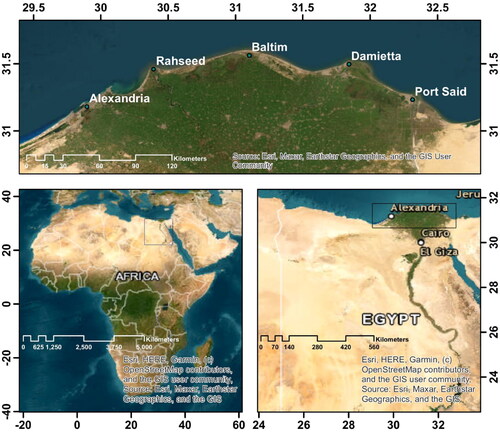
We selected the northern Mediterranean shore of Egypt as a study area, focusing on the region extending from El-Alamein city in the West to Al-Arish city in the East, which covers Alexandria, Rashid, Baltim, Damietta and Port Said cities, . It also covers Alexandria port, Damietta port and Port said port that holds the northern entrance of the Suez Canal which is responsible for roughly 8% of global commercial freight transit and about 2.5% of global oil production transit (Galil et al. Citation2015; El-Sakty & Ezzat, Citation2021).
Figure 1. Study region in the Northern Shore of Egypt.
2.2. Dataset
Gathering a large number of oil spill observations to create a training data set sufficient for training DL models to give high levels of accuracy is considered a great challenge for many reasons. Some of these difficulties are the large size of the raw images obtained from free download platforms, besides the difficulty of the initial processing of these images, which is also considered time-consuming. It was difficult to obtain an existing pre-prepared training data set using SAR images, therefore, we had to create our own. Because the accuracy of the model relies heavily on the training data, several precautions were implemented to ensure the quality of the results, as will be discussed later. It was difficult to obtain images of verified lookalike areas with a number that allowed maintaining a balance between it and the number of oil spills used in creating the training dataset. It was determined to use images of verified oil spill events from previous studies in order to overcome this problem and ensure the validity of the dataset. El-Magd et al. (Citation2021) provided data on oil incidents in the study area between 2014 and 2019, a total of 116 oil spill incidents were confirmed. 50 incidents were selected, taking into consideration the size diversity of spills and utilizing images with different contrast. The dataset mentioned in was obtained by the Sentinel-1 mission satellite level-1 Ground Range Detected (GRD), which is equipped with a C-band SAR system and distributed by the European Space Agency (ESA) via the Copernicus Open Access Hub. With pixel spacing of 10 m, the ground coverage of the SAR sensor is approximately 250 km. The raw data from the Vertical- Vertical (VV) band was processed to create the SAR image dataset. The region of interest containing the confirmed oil spills was subsisted from the raw downloaded SAR images. The subsisted raw SAR images were radiometrically corrected and calibrated as it is an essential procedure to reduce or even eliminate radiometric distortions to guarantee that pixel values are related to the backscattering coefficient of the reflecting surface (sigma naught measured in dB) (Kumar, Citation2021). Speckle filtering is an essential step for oil spill detection techniques from SAR images, as the noise may reduce the information extraction efficiency. The used speckle filtering is lee as it has the ability to reduce noise in SAR images while retaining edge sharpness and essential features (Yu & Acton, Citation2002). As radar data has a very high variation in pixel values, displaying the image in the dB range provides better contrast. As a result, pixel values were converted from linear to dB. A corresponding ground truth mask was created for every image individually after applying all above preprocessing phases. Masking the oil spills is the most important phase, which must be done with high accuracy to ensure the accuracy of the results. The masked images were geometrically corrected according to the Universal Transverse Mercator (UTM) projection. The used software is Sentinel Application Platform (SNAP). Previous studies mentioned that the multiplicity of categories in one image reduces the accuracy of the results, so the images were chosen to contain only two labels, namely oil spills and water surface. The labeled images were split into patches of size 256 × 256 × 1 with a total number of 1539, using the patchify library. Patches that have zero borders () increase the dataset’s imbalance and affect the model’s accuracy if they are used with the other patches. These patches were found to be 848. During the training phase, images that contain zero borders, which cause the dataset to be more imbalanced, were removed. Then the final patch number was 691. We used 431 patches for training and 185 patches for validating and 75 unseen patches for testing. This data set will be available to the public via https://drive.google.com/file/d/15WYzzFZvAHmqSIW0PXXRTp_YVd_868l8/view?usp=sharing
Table 1. A summary of dates, areas, and locations of the raw SAR images used for model training and testing.
3. Ann architectures
3.1. U-Net model
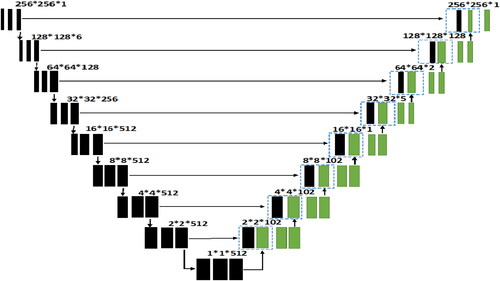
U-Net is a convolutional neural network originally evolved by (Ronneberger et al. Citation2015), for biomedical image semantic segmentation but recently modified to detect oil spills. U-Net can concatenate low-level abstract information extracted from the encoder’s contracting path with high-level semantic abstraction information extracted in the decoder. It has the ability to perform with fewer training images and provide more precise segmentations (Ronneberger et al. Citation2015). As a result, U-Net was chosen to be investigated in this research. Seven 2 D convolutional layers with 4 × 4 spatial filters with stride of 2 in each direction make up the encoder (left side). After each convolutional layer, an activation ReLU function and batch normalization layer is used. At each down sample step, we double the number of feature channels while reducing the spatial dimensions to half the size reaching a 1 by 1 by 512 feature map. The decoder’s path (right side) is as follows: Every step of the expanding route begins with an up sampling of the feature map using up-convolutional 4 × 4 spatial filters in each direction, with stride of 2 in each direction (). In addition, the feature maps from the contracting path are concatenated with the up-convolutional feature maps. The convolutional layer is applied in the last stage, with the number of filters being considered as a number of channels and 4 × 4 spatial filters with stride of 2 in each direction. Finally, the resulting segmentation mask is mapped using the sigmoid function applied to the decoder output.
Figure 2. The U-Net architecture used for oil spills detection.
3.2. Seg-Net model
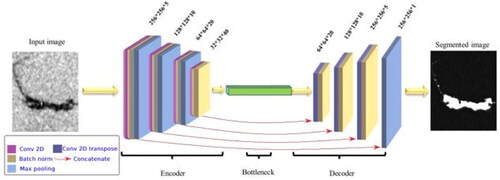
Seg-Net is a Deep Neural Network that was designed by Badrinarayanan et al. (Citation2015), to represent scene segments like road picture segmentation software. We employed Seg-Net as a segmentation model for oil spills due to its efficiency in terms of memory and computing time (Badrinarayanan et al. Citation2015). We evaluated the Seg-Net’s performance with small training dataset. As shown in , the encoder is made up of three 2 D convolutional layers with 3 × 3 spatial filters with stride of 1 in each direction (left side). After that, each convolutional layer is followed by a ReLU function and batch normalization layer. After that, the spatial dimensions are reduced using a 2 × 2 max pooling layer with stride of 2. Dropout layers were added to the second and third down-sampling convolutional layers to prevent overfitting. We increase the number of feature channels while reducing the spatial dimensions to half the size with each down sampling step. The path of the decoder (right side) is as follows: Every step of the expanding path starts with an up sampling of the feature map in each direction with stride of 1 using up-convolutional 3 × 3 spatial filters. In addition, the up-convolutional feature maps are concatenated with the feature maps from the contracting path. In the last stage, the convolutional layer is applied, with the number of filters counting as channels and 3x3x3 spatial filters with stride 1 in each direction. Finally, the sigmoid function is applied to the decoder output to map the segmentation mask.
Figure 3. The Seg-Net architecture used for oil spills detection.
3.3. Conditional generative adversarial networks
GANs are generative networks that learn mapping from random noise to output image trained in an adversarial way, composed of two networks: a generative network which is trained by a loss function that automatically learns from the discriminator, and a discriminative network which learns the distribution between the real and generated maps, allowing flexible losses and eliminating the need for manual tuning. The generator’s goal is to generate synthetic images, while the discriminator distinguishes between the generated and the real image (You et al. Citation2022). The image generation algorithm based on CGAN can generate realistic images from real image data, with low loss and end-to-end advantages as well as it does not need more pre-processing. Furthermore, the conditional CGANs’ loss function is shown in EquationEq. (1)(1)
(1) (Sampath et al. Citation2021):
(1)
(1)
where x is raw SAR images, y are corresponding ground truth mask images, G is the generator, and D is the discriminator. The first term is maximized when
and the second is maximized when the
while it is minimized when
i.e. discriminator is not able to distinguish the generated images and real images. The generator G tries to minimize this objective against an adversarial discriminator D that tries to maximize it. In addition, conditional CGANs also add an L1 loss term, EquationEq. (2)
(2)
(2) (Sampath et al. Citation2021):
(2)
(2)
Therefore, the full form of the loss function is shown in EquationEq. (3)(3)
(3) :
(3)
(3)
where ε is used to adjust L1 loss contribution and is set to 100 in the discussed experiment.
3.4. Discriminator model
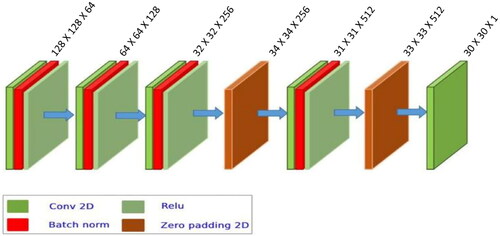
The used discriminator is a Patch-GAN, which is a convolutional Markovian that penalizes structure only at the scale of image patches (Minahil et al. Citation2021). The discriminator takes both ground truth mask and a generated image as input images and decides if they are fake or real. The discriminator’s input is a 2 D layer with a size 256 × 256 × 1, which is the same as the generator’s output. The architecture is convolutional layers, and each convolutional layer utilizes 4 × 4 filters with a stride of 2, like the generator network’s encoder structure. As shown in , the first convolutional layer outputs 64 feature maps, afterwards, this number is doubled at each successive convolutional phase. A map convolution is performed to a one-dimensional output after the last layer, followed by a sigmoid activation layer to determine if the input is a real or fake image. Furthermore, for all layers, Leaky ReLu activation is utilized with a slope of 0.2 in the discriminator.
Figure 4. The discriminator architecture used for oil spills detection.
4. Methodology
Our target is to build a highly accurate segmentation model while reducing model training time as much as possible. The architectures that store the encoder network feature maps in full form, like U-Net, have the best performance, but they use more memory during inference (Hao et al. Citation2020). On the other hand, the Seg-Net model is more effective because it just saves the feature maps’ max-pooling indices and uses this information in the decoder network, achieving better performance (Sheiati et al. Citation2022). Therefore, the Seg-Net model was suggested to be utilized. There were two stages for the study’s implementation. First, using the prepared training dataset, with both models (U-Net and Seg-Net) and train them separately for 50, 100, 150, 200, 250, and 300 epochs. The performance during the training phase of both models was then evaluated. Accordingly, the Seg-Net model was selected to be used during the second stage as it was found to be better than U-Net in terms of model training time and the quality of the generated image. According to previous studies, the standard for CGANs’ architecture consists of U-Net as a generator. Aiming to increase the similarity factor and the quality of the image generated and save model training time, we suggested using the proposed Seg-Net, illustrated in detail in Sec. 3.2, instead of using U-Net as a generator. We assessed the performance of the four proposed models: U-Net, Seg-Net, CGAN with a U-Net generator, and CGAN with the proposed Seg-Net generator. The performance of the four models was compared to determine which one is the best for our practical work. For a fair comparison, we separately trained the four different models using the same dataset. TensorFlow library was used to implement our proposed oil spill detection framework. For the training, a minibatch size of 1 was used with a learning rate of 0.0001 for 50, 100, 150, 200, 250, and 300 epochs. For GAN networks, we trained each generator Gn and each discriminator Dn with the Adam optimizer using β1 = 0.9 and β2 = 0.999. The balance parameter of the L1-norm constraint was equal to 100. The experiment was performed on a computer with an Intel (R) Core (TM) i5-6200U CPU.
5. Evaluation parameters
Peak signal-to-noise ratio (PSNR) and root mean squared error (RMSE) were estimated to evaluate the performance of the detected image quality (Liu & Zhai 2017). In order to measure the similarity between generated oil spills and the corresponding ground truth mask, SSIM is used due to its combination of errors in image contrast and overall structure. The structural similarity index (SSIM) is calculated as shown in EquationEq. (4)(4)
(4) (Kang & Baek, Citation2021):
(4)
(4)
where
are the local means, standard deviations, and cross-covariance for images x, y,
and
are regularization constants determined by pixel value range. The SSIM = 1 means that the generated and the real images are identical.
In order to measure or compare the difference between the image generated by the model and the ground truth mask or real image, RMSE was used. The index RMSE is calculated as shown in EquationEq. (5)(5)
(5) (Chai & Draxler, Citation2014):
(5)
(5)
where x is the real image and xi is the detected image.
In order to measure the peak signal-to-noise ratio which is applied to images as a quality metric in EquationEq. (6)(6)
(6) is applied (Liu & Zhai, 2017):
(6)
(6)
where
is the maximum possible pixel value of the image.
The accuracy, precision, recall, F1-score, and intersection over union (IOU) of their detection maps were used to compare the performance of Seg-Net based CGAN with other models (Seg-Net, U-Net, and CGAN) (Abdollahi et al. Citation2021).
The accuracy is an alternative metric that simply reports the percentage of the image’s pixels that were properly classified as sea surface or oil spill, as shown in EquationEq. (7)(7)
(7) .
(7)
(7)
In order to determine the percentage purity of our positive detected images relative to the ground truth mask, the precision metric was estimated as shown in EquationEq. (8)(8)
(8) .
(8)
(8)
Recall can effectively describe the completeness of the positive predictions relative to the ground truth mask according to EquationEq. (9)(9)
(9) .
(9)
(9)
The F1-score combines the recall and the precision into a single metric by calculating their consistent mean using EquationEq. (10)(10)
(10) to easily compare between the different models (Abdollahi et al. Citation2021).
(10)
(10)
where TP, TN, FP, FN are true positive, true negative, false negative, and false negative respectively.
In order to evaluate the percentage of overlap between the ground truth mask and the detected oil spill images to measure how well they are matched, the intersection over union (IOU) index was estimated using EquationEq. (11)(11)
(11) :
(11)
(11)
where GTM, DI are the ground truth mask and the detected image respectively.
6. Results
6.1. Training results
During the training phase, Seg-Net outperformed U-Net in terms of accuracy, recall, intersection over union (IoU), and model training time, the time spent during training Seg-Net was significantly less than that spent during training U-Net. On the other hand, U-Net outperforms Seg-Net in terms of the percentage of similarity between the detected and target images, PSNR, RMSE, Precision, and F1-Score. In general, during the second stage when adversarial learning was applied, the generative adversarial network played a substantial role in enhancing the results, especially the similarity index, intersection over union, and the quality of the detected image, regardless of the selected generator. Using the modified Seg-Net model, mentioned in Sec. 3.2, instead of the standard U-Net generator mentioned in Sec. 3.1 led to a considerable improvement in the similarity coefficient, intersection over union, a large reduction in the model training time, as well as a remarkable enhancement in the quality of the produced image. Seg-Net-based CGAN outperformed in terms of accuracy, intersection over union, and PSNR. The U-Net model and CGAN exceed the Seg-Net- based CGAN in terms of precision, and F1-Score. The Seg-Net model outperformed the Seg-Net- based CGAN in terms of recall. To put it briefly, the Seg-Net-based CGAN model has outperformed in terms of SSIM, PSNR, RMSE, IoU, accuracy, and reducing model training time, but fell short in precision, recall, and F1-Score, but not significantly as shown in the comparison .
Table 2. Average evaluation parameters after 300 epochs.
6.2. Validating results
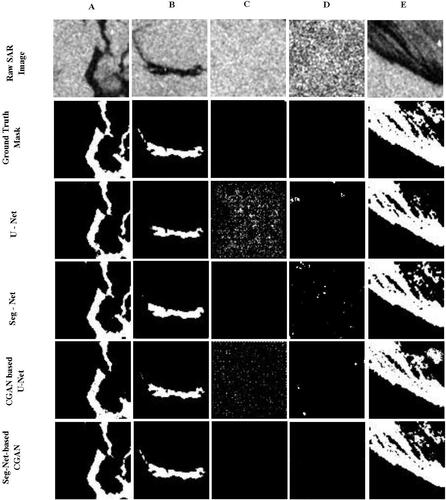
shows the detection results of the four models (U-Net, Seg-Net, CGAN, Seg-Net-based CGAN) during the Validating phase when training the models for 300 epochs separately. Patches of size 256*256 with different contrast and different size and shape of oil spills were chosen to be displayed. It has been noted that the U-Net and CGAN act poorly at low-contrast patches with no oil spills like the C patch. In the case of patches that don’t contain oil spills with salt and pepper effect like the patch D, U-Net, Seg-Net, and CGAN models act poorly too. For patches that contain oil spills of different sizes and shapes, especially those that contain big oil spills in which the oil doesn’t mix with water like the A and B patch, the three models (U-Net, Seg-Net, and CGAN) act fairly well. The Seg-Net-based CGAN acts very well in all cases (low contrast, salt and pepper effect, small or big oil spills, mixed with water or not, and even with patches with no pollution), as well as it is also clear that Seg-Net-based CGAN produces higher quality images and is similar to the ground truth mask.
Figure 5. Detection results of the four detection models (U-Net, Seg-NET, CGAN, Seg-Net-based CGAN) on different sizes and shapes of oil spill patches from the testing set.
6.3. Testing results on unseen SAR oil spill images
The aforementioned results lead us to the conclusion that the Seg-Net-based CGAN model is effective at achieving the study’s scope, which includes obtaining a produced image of high quality, the greatest degree of similarity and an excellent IOU index between the produced image and the ground truth mask, and the highest accuracy, while maintaining the factor of the model’s training time as well as its usability for users. As a result, the testing of the detection performance of the Seg-Net-based CGAN model will be introduced in this section using actual unseen SAR images that were not included in the training data set. It was taken into account that the selected images should be different in terms of the size and shape of the oil spills as well as the contrast of the images. The detection results were obtained using 79 patches from the five unseen SAR images, , which were inputted into the pre-trained model (Seg-Net-based CGAN). summarizes the proposed methodology applied to detect oil spills from raw SAR images using Seg-Net-based CGAN model. The average detection performance results (SSIM, PSNR, RMSE, accuracy, precision, f1-score, recall, and IOU) of the deep-learning-based model (Seg-Net-based CGAN) during training, validating, and testing the model are shown in using the unseen images.
Figure 6. The Proposed Methodology for Oil Spills Detection from raw SAR images using a Seg-Net-based CGAN.
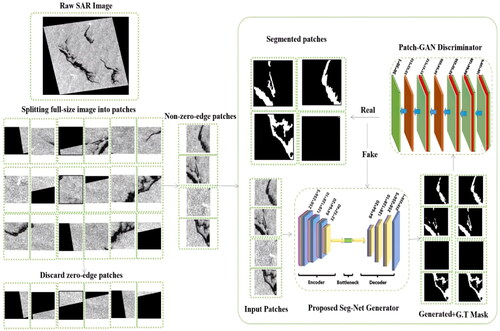
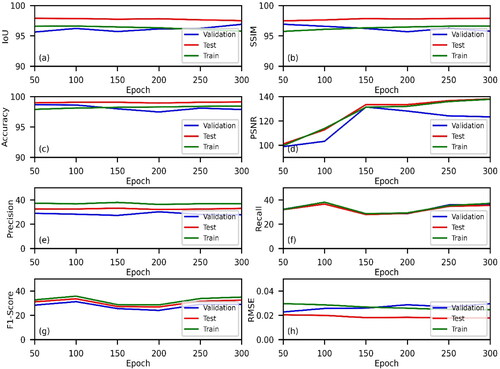
Figure 7. The average detection performance results during training, testing, and validating Seg-Net-based CGAN model using unseen images.
shows the performance of the proposed Seg-Net-based CGAN model in detecting oil spills after 300 epochs using a number of chosen patches with different shapes and sizes. Each patch’s evaluation parameters (Precision, Recall, and F1-Score) are provided. It is clear that patches with no oil spills have a precision, recall, and f1-score factors of zero as patch No. 1, whereas patches with oil spills have an average precision factor of 73.83. This is attributed to the fact that if there are no oil spills in the image, the true positive values will be zero which affects the values of precision, recall, and f1-score, EquationEqs. (8)–(10). displays the average precision, recall, and f1-score during the test, validation, and training phases for Seg-Net-based CGAN model. This explains the deviation between the accuracy and precision coefficients of the four models (Seg-Net, U-Net, CGAN, and Seg-Net-based CGAN) mentioned in . The explanation is patches in the used training dataset that have zero oil spills are included in calculations when computing the average of the evaluation parameters.
Figure 8. The performance of the proposed Seg-Net-based CGAN model in detecting oil spills during the testing phase.
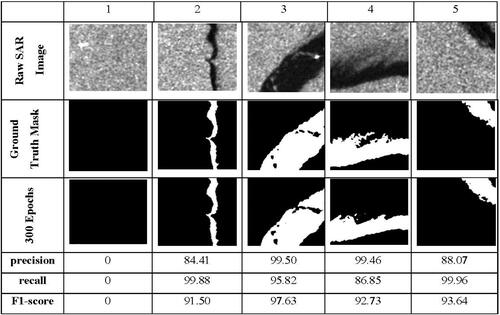
Table 3. The average of evaluation for patches with oil spills only during train, test, and validation of Seg-Net-based CGAN.
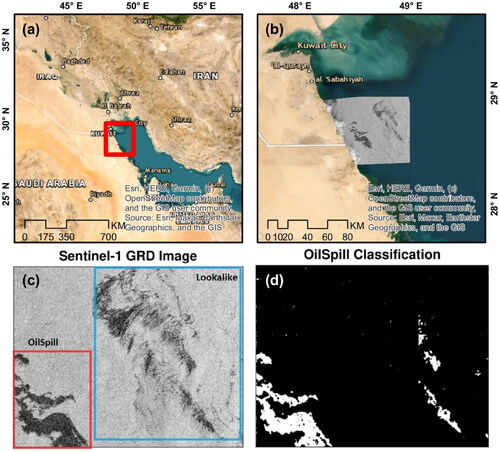
6.4. Application to oil spill incident in the Arabian Gulf
An oil spill incident has occurred in August 2017 in the Arabian Gulf offshore of Kuwait, . We used Sentinel-1 (VV) SAR image observed on 10 August 2017 and our proposed model to segment the oil spill regions. The observed image shows a large portion of oil spill look alike in addition to the actual oil spills, , (Zhang et al. Citation2022). Although, our training datasets did not include any look alike images, our proposed model was able to segment the oil spill with an accuracy of nearly 80%, . Sections of the look alike phenomenon were falsely segmented as oil spills, this can be attributed to the topological similarity between these sections and the actual oil spills. We believe that our proposed model can produce more accurate results in oil spill segmentation in the presence of the look alike phernomenon if trained using datasets containing a verified look alike sections.
Figure 9. (a) Application region in the Arabian Gulf, (b) location of oil spill at 10 August 2017 overlayed by Sentinel-1GRD (VV) image, (c) Sentinel-1 GRD (VV) image showing the areas of oil spills and lookalikes, (d) results of oil spills segmentation using the proposed model.
7. Conclusions
A dataset was created from 50 raw SAR images by performing a series of processing procedures, the first of which was to subset the region of interest from the images and the final of which was to produce the ground truth mask, thus obtaining a total number of 1583 patches with a size of 256*256. A modified Seg-Net model was proposed to be used as a generator for CGAN due to its memory and computing time efficiency when used for inference. Utilizing adversarial learning significantly improved the performance of the utilized DL models (U-Net and Seg-Net), especially the Seg-Net model. The Seg-Net-based CGAN model as a generator has the ability to generate reliable oil spill detection maps. The experimental results revealed that the produced maps are of high quality. The produced image and the ground truth mask have a similarity index of 97.75 percent, IoU index of 96.59 percent and an accuracy index of 99.04 percent. The model training time was reduced from 10 h and 55 min when using the U-Net model to 3 h and 20 min for 50 epochs when using the Seg-Net model as a generator. The Seg-Net-based CGAN model has the ability to detect patches containing different shapes (either mixed or not with water) and sizes (big, small, and medium) of oil spills and even patches with no oil spills at all. The experiment results tested the effectiveness of the Seg-Net-based CGAN model using unseen SAR images, demonstrating that the model does not suffer from the overfitting problem.
It was challenging to obtain images of verified lookalike areas in our study region. Therefore, it was not feasible to train our proposed model to the lookalike phenomenon. However, when testing the proposed model using images that contains oil spills in addition to lookalike phenomenon, the model segmented oil spills with an accuracy of nearly 80%. For future work, although the proposed model has proven effective in distinguishing between oil spills and lookalikes, it is recommended to include verified images of lookalike areas with a suitable number proportional to the number of oil spill images in training the proposed Seg-Net-based CGAN model to increase the model robustness and enhance its performance.
Disclosure statement
The authors declare that they have no known competing financial interests or personal relationships that could have appeared to influence the work reported in this paper.
Data availability statement
The dataset used in this analysis will be available to the public via https://drive.google.com/file/d/15WYzzFZvAHmqSIW0PXXRTp_YVd_868l8/view?usp=sharing
References
- Abdollahi A, Pradhan B, Sharma G, Maulud KNA, Alamri A. 2021. Improving road semantic segmentation using generative adversarial network. IEEE Access. 9:64381–64392.
- Alpers W, Holt B, Zeng K. 2017. Oil spill detection by imaging radars: challenges and pitfalls. Remote Sens Environ. 201:133–147.
- Alzubaidi L, Zhang J, Humaidi AJ, Al-Dujaili A, Duan Y, Al-Shamma O, Santamaría J, Fadhel MA, Al-Amidie M, Farhan L. 2021. Review of deep learning: concepts, CNN architectures, challenges, applications, future directions. J Big Data. 8(1):53–74.
- Artuso F, Guijt I. 2020. Global megatrends: mapping the forces that affect us all. OXFAM Papers, 12. https://oxfamilibrary.openrepository.com/bitstream/handle/10546/620942/dp-global-megatrends-mapping-forces-affect-us-all-310120-en.pdf?sequence=1&isAllowed=y.
- Badrinarayanan V, Kendall A, Cipolla R. 2015. SegNet: a deep convolutional encoder-decoder architecture for image segmentation. Retrieved March 15, 2022, from http://mi.eng.cam.ac.uk/projects/segnet/.
- Brekke C, Solberg AHS. 2005. Oil spill detection by satellite remote sensing. Remote Sens Environ. 95(1):1–13.
- Chai T, Draxler RR. 2014. Root mean square error (RMSE) or mean absolute error (MAE)? - arguments against avoiding RMSE in the literature. Geosci Model Dev. 7(3):1247–1250.
- El-Magd IA, Zakzouk M, Ali EM, Abdulaziz AM. 2021. An open source approach for near-real time mapping of oil spills along the Mediterranean coast of Egypt. Remote Sens. 13(14):2733.
- El-Sakty KA, Ezzat AM. 2021. Digital transformation as a stimulator for maritime competitiveness: a suez canal case study. Sci J Financial Commercial Stud Res (SJFCSR). 2(1):599–642.
- Elmgren R. 2001. Understanding human impact on the baltic ecosystem: changing views in recent decades. Ambio. 30(4–5):222–231.
- Galil B, Boero F, Fraschetti S, Piraino S, Campbell M, Hewitt C, Carlton J, Cook E, Jelmert A, Macpherson E, et al. 2015. The enlargement of the Suez Canal and introduction of non-indigenous species to the Mediterranean Sea. Limnol Oceanogr Bull. 24(2):43–45.
- Guo H, Wei G, An J. 2018. Dark spot detection in SAR images of oil spill using segnet. Appl Sci (Switzerland). 8(12):2670.
- Hao D, Ding S, Qiu L, Lv Y, Fei B, Zhu Y, Qin B. 2020. Sequential vessel segmentation via deep channel attention network. Neural Netw. 128:172–187.
- Kang M, Baek J. 2021. SAR image change detection via multiple-window processing with structural similarity. Sensors. 21(19):6645.
- Krestenitis M, Orfanidis G, Ioannidis K, Avgerinakis K, Vrochidis S, Kompatsiaris I. 2019. Oil spill identification from satellite images using deep neural networks. Remote Sens. 11(15):1762.
- Kumar D. 2021. Urban objects detection from C-band synthetic aperture radar (SAR) satellite images through simulating filter properties. Sci Rep.11(1):1–24.
- Laine V, Goerlandt F, Baldauf M, Mehdi RA, Koldenhof Y. 2019. OpenRisk: a risk management toolbox for prevention and response of pollution from maritime activities. Chem Eng Trans. 77:1033–1038.
- Li Y, Lyu X, Frery AC, Ren P. 2021. Oil spill detection with multiscale conditional adversarial networks with small-data training. Remote Sens. 13(12):2378.
- Liu N, Zhai G. 2017. Free energy adjusted peak signal to noise ratio (FEA-PSNR) for image quality assessment. Sens Imaging. 18(1):1–10.
- Ma X, Xu J, Wu P, Kong P. 2021. Oil spill detection based on deep convolutional neural networks using polarimetric scattering information from Sentinel-1 SAR images. IEEE Trans Geosci Remote Sens. 60:1–13.
- Magrì S, Vairo T, Reverberi A, Fabiano B. 2021. Oil spill identification and monitoring from Sentinel-1 SAR satellite earth observations: a machine learning approach. Chem Eng Trans. 86:379–384.
- Minahil S, Kim JH, Hwang Y. 2021. Patch-wise infrared and visible image fusion using spatial adaptive weights. Appl Sci (Switzerland). 11(19):9255.
- Oussidi A, Elhassouny A. 2018. Deep generative models: survey. 2018 International Conference on Intelligent Systems and Computer Vision, ISCV 2018, 2018 May 1–8.
- Pan X, Zhao J, Xu J. 2020. Conditional generative adversarial network-based training sample set improvement model for the semantic segmentation of high-resolution remote sensing images. IEEE Trans Geosci Remote Sens. 59(9):7854–7870.
- Ronneberger O, Fischer P, Brox T. 2015. U-net: convolutional networks for biomedical image segmentation. Lecture Notes in Computer Science (Including Subseries Lecture Notes in Artificial Intelligence and Lecture Notes in Bioinformatics). Vol. 9351. p. 234–241.
- Sampath V, Maurtua I, Aguilar Martín JJ, Gutierrez A. 2021. A survey on generative adversarial networks for imbalance problems in computer vision tasks. J Big Data. 8(1):1–60.
- Sheiati S, Behboodi S, Ranjbar N. 2022. Segmentation of backscattered electron images of geopolymers using convolutional autoencoder network. Expert Syst Appl. 206:117846.
- Singha S, Bellerby TJ, Trieschmann O. 2013. Satellite oil spill detection using artificial neural networks. IEEE J Sel Top Appl Earth Observ Remote Sens. 6(6):2355–2363.
- Tang D, Sun J, Zhou L, Wang S, Singh RP, Pan G. 2019. Ecological response of phytoplankton to the oil spills in the oceans. Geomatics Nat Hazards Risk. 10(1):853–872.
- Xiao X, Li C, Lei Y. 2022. A lightweight self-supervised representation learning algorithm for scene classification in spaceborne SAR and optical images. Remote Sens. 14(13):2956.
- You A, Kim JK, Ryu IH, Yoo TK. 2022. Application of generative adversarial networks (GAN) for ophthalmology image domains: a survey. Eye Vis (Lond). 9(1):6–19.
- Yu Y, Acton ST. 2002. Speckle reducing anisotropic diffusion. IEEE Trans. Image Process. 11(11):1260–1270.
- Zhang J, Feng H, Luo Q, Li Y, Zhang Y, Li J, Zeng Z. 2022. Oil spill detection with dual-polarimetric Sentinel-1 SAR Using superpixel-level image stretching and deep convolutional neural network. Remote Sens. 14(16):3900.
- Zhen X, Vinnem JE, Han Y, Peng C, Huang Y. 2022. Development and prospects of major accident indicators in the offshore petroleum sector. Process Saf Environ Prot. 160:551–562.
- Zou L, Zhang H, Wang C, Wu F, Gu F. 2020. MW-ACGAN: generating multiscale high-resolution SAR images for ship detection. Sensors. 20(22):6673.