
 ?Mathematical formulae have been encoded as MathML and are displayed in this HTML version using MathJax in order to improve their display. Uncheck the box to turn MathJax off. This feature requires Javascript. Click on a formula to zoom.
Abstract
The frequent occurrence of extreme drought events in Guangxi has caused huge losses to human beings and economy in the region for many years. For fine identification of drought evolution characteristics, this study adopted the objective identification method of regional extreme events (OITREE) to carry out the comprehensive feature identification involving multidimensional elements such as intensity, duration and area of meteorological drought events based on the daily standardized precipitation evapotranspiration index (SPEI) data of Guangxi from 1979 to 2018a. By comparing the evolution characteristics of drought elements identified by grid SPEI statistical analysis and OITREE, a comprehensive analysis framework for drought characteristics of multidimensional factor’s measurement is formed in this study. Specifically, the grid analysis is more convenient to identify single point drought characteristics, and the OITREE method is better at describing the overall spatiotemporal evolution of drought events. The study found that flash droughts and seasonal droughts occurred alternately and were superimposed concurrently in Guangxi, and the multidimensional spatial and temporal characteristics of these two types of droughts were significantly different. In concrete terms, the average annual frequency of flash drought events in Guangxi was 2.0–3.8, the average annual duration varied from 20 to 60 d, and the concentration point of drought events had a region-wide dispersion; while the average annual frequency of seasonal drought events in Guangxi was 0.82–1.65, the average annual duration varied from 40 to 105 d, and the concentration point of drought events had a local concentration. Furthermore, for the flash drought, seasonal drought and total drought in Guangxi, the three-dimension clustering method was introduced to realize the comprehensive intensity spatial heterogeneity clustering partition and temporal heterogeneity clustering mapping of meteorological drought in Guangxi. The research results can provide important scientific support for promoting the operational risk assessment and regulation of regional drought disasters and forecasting and warning.
1. Introduction
With global climate warming, the frequency and intensity of drought events around the world are increasing (Ault and Toby Citation2020; Spinoni et al. Citation2019), seriously threaten food security and ecological security in all regions around the world. The drought events have become an important factor restricting the sustainable development of the regional social economy (Su et al. Citation2018), and have become an important issue of general concern to the scientific community (Zarei and Mahmoudi Citation2021). In recent years, international research on drought events, on the one hand, is gradually changing from the traditional monthly and above time scales and single-factor feature statistics to more refined time scales and comprehensive measures of multiple factors (Wang et al. Citation2021); On the other hand, it is shifting gradually from single-point drought event analysis to comprehensive characterization of the evolution of drought processes within the surface domain (Ren et al. Citation2012; Zhang et al. Citation2021). Therefore, this study integrates the advantages of grid point statistics and surface domain spatiotemporal evolution methods to carry out daily-scale refined multidimensional process metrics of meteorological drought events, with a view to laying a scientific foundation for intelligent management of drought risk regulation, assessment and early warning of integrated meteorological and agricultural droughts in the study area.
Previously, the identification of drought events was usually one-dimensional based on the time dimension, i.e. identifying the start and end times of drought for a specific region, and then analyzing the changes of drought over time; or two-dimensional identification based on the plane, i.e. identifying the impact range of drought for a specific time period and analyzing the changes of drought in space. Yevjevich (Citation1967) used a threshold truncation method to extract drought feature variables from a one-dimensional drought indicator sequence. Andreadis et al. (Citation2005) and Sheffield et al. (Citation2009) used spatial clustering methods to extract drought patches to achieve spatial identification of drought events and further characterize the spatial and temporal patterns of drought. Lloyd-Hughes (Citation2012) expanded to three dimensions based on Andreadis et al. (Citation2005) to achieve a complete spatiotemporal characterization of the structure of single-field drought events. Haslinger and Blöschl (Citation2017) detected drought events in Europe over the past 210 years by linking spatiotemporal drought regions of tagged elements. Herrera Estrada et al. (Citation2017) explored the spatiotemporal dynamics of drought clusters on a global scale using a Lagrangian approach from the perspective of drought dynamics. Guo et al. (Citation2018) used 3-month standardized precipitation evapotranspiration index and structured 3-dimensional clustering algorithm to study the spatial and temporal distribution characteristics of droughts in Central Asia. Xu et al. (Citation2019) proposed a three-dimensional identification method of drought spatiotemporal continuity by identifying drought patches with given thresholds and judging the continuity of drought in two adjacent times and verified the reliability of the method by taking Southwest China as an example. Fang et al. (Citation2019) also used a three-dimensional identification method to study the comprehensive characteristics of the evolution of single-field and multifield continuous meteorological droughts in the Huaihe River basin. Diaz et al. (Citation2020) proposed a method to build the spatial tracks and paths of drought, and tested the reliability of this method with India as the study area. Most of the above studies focus on monthly and above scales, while the occurrence of droughts is not fixed, especially short and high-intensity droughts, which are difficult to be identified accurately based on monthly scales alone. For some short-duration flash droughts, which are short-lived but have an important impact on crop growth as well as agricultural production if they occur during the crop growing season, however, it is very easy to underestimate or fail to identify such droughts at the monthly scale (Mo and Lettenmaier Citation2015). Thus, the introduction of daily scales to monitor droughts and the refinement of temporal measures of multidimensional characteristic elements of drought events are more helpful to reveal the continuous dynamic evolution of drought events in time and space dimensions.
At present, most of the research on meteorological drought is based on station/grid data to carry out the research on the temporal and spatial evolution characteristics of drought. This analysis can finely reveal the evolution of drought events at a single point, the coexistence and transformation of droughts and floods, and seasonal droughts; However, it cannot reflect well the overall characteristics of the time evolution of each element of a single drought event on the surface domain. For this purpose, Ren et al. (Citation2012) proposed an objective identification method for regional extreme events (OITREE), which reasonably “strings” the daily impact range into a string to form a complete regional event, that is, the “sugar gourd string” model. At present, this method has been widely used in the study of regional extreme events such as drought, extreme heavy precipitation in China and has achieved good results (Cai et al. Citation2021; Li et al. Citation2014; Wu et al. Citation2019). Zhang et al. (Citation2021) improved the OITREE method, and then carried out research on regional drought process identification and assessment techniques in the middle and lower reaches of the Yangtze River.
In recent years, a flash drought with short-duration and high-intensity has attracted extensive attention of scholars (Hu et al. Citation2021; Pendergrass et al. Citation2020; Wang and Yuan Citation2018; Yuan et al. Citation2019). The traditional seasonal drought is slow and creeping (Zhu et al. Citation2021), and the onset of flash droughts is unusually rapid, flash and unpredictable. To investigate the connection between flash drought and traditional seasonal drought, Ye et al. (Citation2022) compared the differences between the mechanisms of flash drought and traditional seasonal drought formation processes. Wang and Yuan (Citation2018) explored the development and evolution of two types of flash droughts in different regions of China and analyzed the distribution of flash droughts under different driving mechanisms and their connection with seasonal droughts. Zhu et al. (Citation2021) analyzed the spatial and temporal differences between flash droughts and seasonal droughts in terms of frequency and impact range based on the decay characteristics of water deficit at the beginning of drought, and selected typical drought events to explore the connection between the two in the evolutionary process. Wang and Yuan (Citation2021) addressed the 2019 severe flash drought event in southern China and found that this flash drought eventually evolved into a seasonal drought. The coexistence of flash droughts and seasonal droughts causes high disaster intensity, especially for the crop-based food production and agricultural economy, which is very threatening and destructive. Guangxi is a typical area where flash droughts and seasonal droughts coexist (Wang and Yuan Citation2021) and alternate between droughts and floods (He et al. Citation2016). Therefore, it is of great scientific significance to carry out research on regional characteristics of meteorological drought events and multidimensional process metrics of drought in Guangxi.
In this study, aiming at the practical problem of abundant water resources but frequent droughts in Guangxi, a large agricultural province, we adopted the combination of the SPEI meteorological drought index and OITREE to carry out the fine measurement of daily-scale multidimensional elements of the spatial and temporal evolution of meteorological drought in Guangxi and the identification of regional drought characteristics. The analysis and discussion of the study results are sub-sectioned as follows: First, the spatiotemporal statistical characteristics of multidimensional elements of meteorological drought in Guangxi in Section 3 is described. Then, in Section 4, the regional meteorological drought characteristics in Guangxi is systematically analyzed; Finally, the flash and seasonal superposition effects of meteorological drought in Section 5.1 are discussed, and the three-dimension clustering method is introduced to realize the heterogeneous partitioning of meteorological drought in Guangxi in Section 5.2. This study formed a comprehensive multidimensional evolutionary metric and feature identification scheme for the refinement of regional meteorological drought, which can lay a scientific foundation for the refined dynamic assessment and regulation of drought risk, hydrological and agricultural drought and accurate prediction and early warning of drought in the region.
2. Study area, data and methods
2.1. Study area
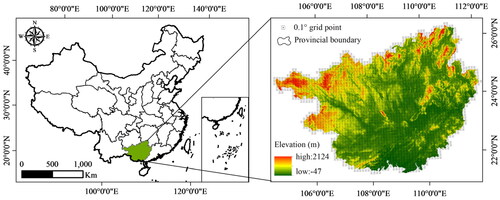
Guangxi (extending from 20°54′ N–26°24′ N to 104°26′ E–112°04′ E) is located in South China () and belongs to the subtropical monsoonal humid climate zone (Zhang et al. Citation2014), with abundant annual precipitation (range 1500–2000 mm) but uneven spatial and temporal distribution (Liu et al. Citation2012), the average temperature of the region is relatively high, between 16.5 and 23.1 °C. Furthermore, extensive distribution of rocky hills and karst development within the region (Zhou et al. Citation2015), resulting in the coexistence and alternating frequency of drought and flood disasters. Among them, drought disasters have the characteristics of frequent and coexisting flash drought and seasonal drought (Wang and Yuan Citation2021). In addition, Guangxi is a large agricultural province, and most of the crops were planted on sloping land and are mainly rain-fed, and crop growth in the region is extremely sensitive to the response of meteorological drought (Zhang et al. Citation2020; Zhao et al. Citation2019), with huge drought losses over the years. Many scholars (Wang et al. Citation2015a; Yan et al. Citation2021; Zhang and Jian Citation2012) have conducted studies on drought in Guangxi and obtained many meaningful results. However, most studies focused on the classification of drought and the distribution of spatial and temporal characteristics of drought, while there were relatively few multidimensional scale characteristics of drought and its process metrics, and the expression of spatial heterogeneity characteristics of regional meteorological drought events was slightly inadequate. Therefore, it is necessary to carry out regional characteristics of meteorological drought events and multidimensional process measures of drought in Guangxi, in order to provide scientific support for revealing the influence law of extreme drought on flood formation and its risk, agricultural production, etc. in the region.
Figure 1. The DEM and rainfall grids of Guangxi Province, China.
2.2. Data
The rainfall data used in this study were obtained from the China Meteorological Forcing Dataset (CMFD), including precipitation, 2-meter air temperature, surface pressure, specific humidity, 10-meter wind speed and downward shortwave/longwave radiation, which was developed by the Institute of Tibetan Plateau Research Chinese Academy of Sciences (http://data.tpdc.ac.cn/en/data/8028b944-daaa-4511-8769-965612652c49/) (He et al. Citation2020). The CMFD uses internationally existing Princeton reanalysis data, the Global Land Data Assimilation System (GLDAS) data, and the Tropical Rainfall Measuring Mission (TRMM) precipitation data as background fields, combining with the precipitation data of the China Meteorological Administration. The dataset has a time resolution of 3 h, a spatial resolution of 0.1°, a longitude range of 60°∼140°E, and a latitude range of 15°∼55°N. We extracted the daily rainfall data for a total of 2 398 grid points in Guangxi and its surrounding 0.1° buffer zone (), and the sequence length was from 1979 to 2018. From this, the daily SPEI index was calculated to realize the multidimensional comprehensive feature identification and heterogeneous partitioning of meteorological drought in the study area.
The maximum temperature and minimum temperature data used in this study were from China Surface Climatic Data Daily Value Dataset V3.0 of China Meteorological Data Network (http://data.cma.cn/). The data have been strictly cross-verified and error analyzed, and the quality is in good condition.
2.3. Methods
2.3.1. The SPEI index
Vicente-Serrano et al., (Citation2010) first proposed the standardized precipitation evapotranspiration index (SPEI) based on the standardized precipitation index (SPI) with full consideration of both water deficit and cumulative effects. In this study, the calculation steps of the SPEI are as follows. The first step is to calculate the daily potential evapotranspiration (PET) based on daily meteorological data. Next, the daily cumulative water deficit time series are derived by daily sliding accumulation of a certain number of days, such as 30 d (Wang et al. Citation2015b; Wang et al. Citation2015c) or 90 d (Jia and Zhang Citation2018), based on above daily difference series of P-PET. The daily SPEI results are finally achieved by fitting Log-logistic function and standardizing (Liang et al. 2018). In this study, the 30 d period is selected over the above sliding calculation, which taken into account the identification of short duration flash drought events in Guangxi.
Specifically, the potential evapotranspiration PET is commonly calculated using the Penman-Monteith formula (Allen Citation2006; Zarei et al. Citation2022; Zarei et al. Citation2021). It combines energy balance and mass transfer methods, while considering the effects of sunlight, air humidity, wind speed and moisture on evapotranspiration, and is applicable to various climatic conditions. Thus, in this paper, the Penman-Monteith formula is used instead of the Thornthwaite method to calculate PET, and the specific calculation formula is detailed in EquationEquation (1)(1)
(1) . In recent years, studies have found that determining this threshold based on the probability of occurrence is more scientific and more consistent with actual drought conditions. Therefore, in this study, the probability of occurrence is used to determine the classification threshold of SPEI, as shown in (Huang et al. Citation2014).
(1)
(1)
Where: △ is the slope of the saturation water vapor pressure curve, (kPa.°C−1); Rn is the net surface radiation, (MJ.m−1.d−1); G is the soil heat flux, (MJ.m−2.d−1); γ is the dry and wet table constant, (kPa.°C−1), T is the average daily air temperature at 2 m, °C; u2 is the wind speed at 2 m, (m/s); es is the saturation water vapor pressure, (kPa); ea for the actual water vapor pressure, (kPa). The calculation of the relevant elements in the above equation is detailed in Allen (Citation2006).
Table 1. Classification threshold of drought intensity by SPEI value.
2.3.2. The identification method of regional meteorological drought events
The OITREE method (Ren et al. Citation2012) proposed the “Sugar-Hulu String Model” (Li et al. Citation2014), and with the help of the idea of this model, the daily influence scope was “stringed” into a string to form a complete regional event. The technique includes five steps: (1) select a daily index for individual points; (2) separate the daily drought belts; (3) identify the temporal continuity of drought events; (4) construct a standard index system of OITREE; and (5) assess the extremity of each regional drought event. Among them, the two core techniques of the method are the separation of daily drought belts and the temporal continuity identification of drought events. The regional event index system () is specifically proposed for the characteristics of regional events, including five single indices: extreme intensity (I1), accumulated intensity (I2), accumulated area (As), maximum influential area (Am), duration (D), and an integrated index (Z).
Table 2. The index system for regional drought events.
The parameter assignment table of the OITREE method to identify regional meteorological drought events in Guangxi is listed in . These parameter values are determined by related references (Li et al. Citation2014; Zhou et al. Citation2021) and also repeated calculations and comparison with historical data statistics.
Table 3. The parameters of OITREE method for the regional meteorological drought analysis.
In this study, the OITREE method was used to identify regional meteorological drought events in Guangxi from 1979 to 2018 based on the SPEI index, and the calculation principle of the OITREE method is detailed in Ren et al. (Citation2012). According to the suggestions of Ren et al. (Citation2012), the integrated index Z of all regional meteorological drought events was ranked from strong to weak. The percentile method was used to divide them into four intensity levels: Extreme drought events (10%), severe drought events (20%), moderate drought events (40%) and light drought events (30%). In this study, the event classification thresholds are 1.46, 0.36, and −0.65, −1.04 respectively.
2.3.3. The three-dimension clustering for heterogeneous partitioning
Currently, the effective screening and categorization of data have become key to understanding the spatial and temporal characteristics, evolutionary processes, and behavioral mechanisms of geographic phenomena. In this study, the three-dimension clustering (Wu et al. Citation2020; Wu et al. Citation2018) of “space-time-scale-attribute” based on geographical elements was used to comprehensively zonate the regional drought in Guangxi. The method is universal and is an effective method for detecting the spatial and temporal divergence of geographic data in the era of big data. Compared with traditional clustering methods, it can avoid paying too much attention to the primary information and ignore the secondary information. In addition, it can effectively solve the problems of large data volume, high data dimensionality, and low data quality. It can also realize the joint interpretation of the spatiotemporal divergence law of geographic data in multiple directions, scales, and levels and reveal the spatiotemporal scale superposition effect of geographic features. The main calculation steps are as follows:
Step 1: Based on the original data
directions 1 to 3 were randomly divided k, l, and m regions (clusters), respectively, the data body and data partitioning scheme, denoted as
Step 2: Calculate the mean value of the data in each area of
Step 3: Compute information divergence (Objective Function):
Step 4: Based on the
Step 5: Calculate the mean value of the data in each area of
Step 6: If
Step 7: Until the objective function converges, the optimized three-dimension clustering results of k, l, and m are obtained.
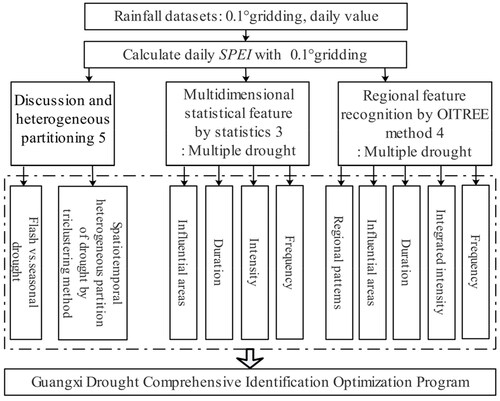
In summary, the overall framework of this study is finally formed by combining the research theme and the above methods, as shown in .
Figure 2. A system analysis scheme of regional meteorological drought via multidimensional elements identification and tri-clustering partition.
3. Multidimensional statistical characteristics of meteorological drought events in Guangxi by grids daily SPEI
3.1. Temporal variation characteristics of multidimensional drought elements
Based on the daily SPEI series of 2 398 grid points from 1979 to 2018a, this section counts the multidimensional elemental time-varying characteristics of meteorological drought events in Guangxi over the past 40 years. Specifically, factors such as the frequency, intensity, duration and influential area of drought events are involved, and the results are shown in . From , it can be seen that in the past 40 years, the intensity of meteorological drought in Guangxi has been decreasing at a rate of −0.0564 (10 a)−1, which did not pass the 0.05 significance test; among them, the years with larger absolute values of annual drought intensity were 1979a and 1982a, both greater than 1.28 (severe drought), and the smallest values was 2012a, with absolute values ranging from 0.52 to 0.84 (light drought). During the study period, the frequency, duration, and influential area of meteorological drought in Guangxi increased at a rate of −0.5113 times (10 a)−1, 7.085 days (10 a)−1, and 0.001 (10 a)−1, respectively, and all factors did not pass the 0.05 significance test. Specifically, the highest number of droughts occurred in 2011a (11 times), and the years with fewer drought events were concentrated before the twenty first century; the drought duration tended to increase from 1979 to 1996a, and then tended to decrease, reaching a great value in 2007a, and the decreasing trend was more moderate after 2008a; and the influential area had a clear interdecade variation, such as an increasing trend from 1979 to 1991a and 2002 to 2009a, and a decreasing trend from 1992 to 2001a and after 2010a.
Figure 3. Time-varying statistical characteristics of multidimensional elements of meteorological drought in Guangxi.
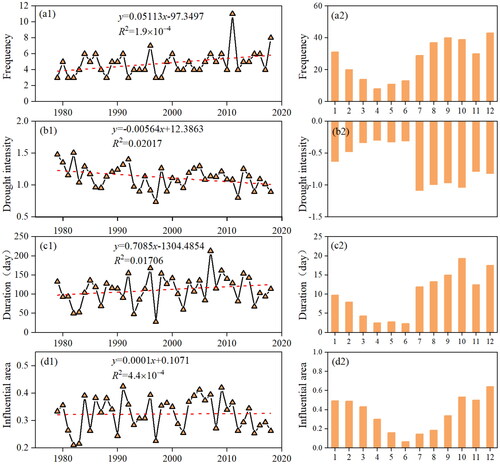
Furthermore, the intra-annual month-by-month changes of frequency, intensity, duration and influential area of meteorological drought in Guangxi are shown in . shows that in the past 40 years, meteorological drought events in the study area mostly occurred in the autumn and winter seasons, accounting for 34.60% and 29.84% of the year, with the most frequent droughts occurring in December, accounting for approximately 13.65% of the year. In addition, the lowest number of droughts occurred in spring, accounting for approximately 10.48% of the year. The annual intensity shows the seasonal characteristics of stronger in the summer and autumn and weaker in the spring and winter in general. The annual average duration of was similar to the frequency distribution changes of , which generally showed the seasonal characteristics of longer drought duration in the autumn and winter seasons. shows that during the study period, the percentage of Guangxi meteorological drought-influential area was the highest in December, reaching 64%, and the lowest was in June, approximately 6%. In terms of seasons, the influential area was larger in winter, accounting for more than 49% in all months, followed by that in autumn and spring, and the smallest was in summer, with a drought area variation from 6% to 20% in June to August.
The comprehensive year by year and month by month drought factor statistics showed that the annual increase and decrease in drought factors of meteorological drought in Guangxi were not significant, and the overall trend of drought frequency, duration and influential area within 40a showed an increasing trend, while the intensity showed a decreasing trend, indicating that meteorological drought in the study area had a trend of longer duration and wider influential range. There were obvious seasonal changes in the monthly distribution of drought factors in the year, which were mainly characterized by high frequency, strong intensity, long duration and very large influence range in autumn and winter.
3.2. Spatial patterns of multidimensional drought elements
Based on the daily SPEI series of 0.1° grid points in Guangxi from 1979 to 2018a, the multidimensional elemental spatial distribution of meteorological drought events in Guangxi was drawn using ArcGIS software for interpolation, as shown in . shows that there were three high-value areas for the multiyear meteorological drought frequency in Guangxi, namely, the west (specifically, the southeast of Baise), the northwest (specifically, the northeast of Hechi), and the southwest (specifically, the junction between the east of Chongzuo and the west of Nanning). The overall distribution pattern gradually decreased from northwest Guangxi to southeast Guangxi; among them, the average annual drought frequency in the northwestern part is mostly between 3.33 and 4.05 times, while that in the southeastern part is mostly between 2.61 and 3.32 times. shows that the cumulative intensity of meteorological drought in Guangxi generally showed the distribution characteristics of relatively larger value in southwestern and southeastern Guangxi, and relatively smaller values in central and northeastern Guangxi. shows that during the period of meteorological drought, the absolute value of the multiyear average drought intensity in the region ranges was between 0.86 and 1.02 (moderate drought); and the region showed the distribution characteristics of stronger intensity in the northeastern area than in the southwestern area. Furthermore, shows that there are three high-value areas for duration in Guangxi, which were the west (specifically, the northeast of Baise), the northwest (specifically, the northwest of Hechi), and the southwest (specifically, the junction of the southwest of Baise and the southeast of Chongzuo and the southwest of Fangchenggang), all above 135 d. The drought duration in central and northeastern Guangxi was relatively short, all below 126 d. The overall distribution pattern showed a decreasing trend from southwestern Guangxi to northeastern Guangxi.
Figure 4. Spatial distribution characteristics of drought events in Guangxi.
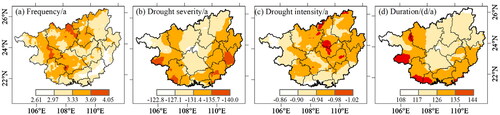
The results of the spatial distribution of frequency, daily cumulative intensity, daily average intensity and duration of meteorological drought in Guangxi mentioned above show that the spatial distribution pattern of daily cumulative intensity and duration of meteorological drought events in Guangxi had good consistency, while the spatial distribution of frequency and daily average intensity reflect that the northern part of Guangxi was the area with high occurrence of drought events and greater drought intensity. Among them, the daily cumulative intensity in and the daily average intensity in had almost opposite spatial distribution characteristics, and this phenomenon was clarified by combining with the temporal pattern of the drought in . For example, meteorological drought events in the western region of Guangxi had a longer duration and greater cumulative drought intensity, which could cause severe regional drought consequences, but their daily average drought intensity was relatively low. In contrast, the northern part of the study area had a short drought duration, and the daily cumulative intensity was relatively small, but its daily average drought intensity was relatively high. This result showed that the drought duration of Guangxi meteorological drought events was the main factor affecting the severity of drought and the contribution of drought in different regions.
4. Regional characteristics of meteorological drought in Guangxi by OITREE
4.1. Three-dimensional metric of a typical drought events
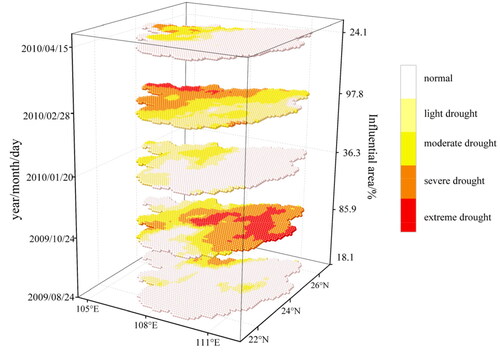
In order to more clearly illustrate the multidimensional measures of the evolution for a drought event, a three-dimensional diagram () of a typical drought event in 2009–2010a was presented in this section based on the identification results by the OITREE method (Li et al. Citation2015). shows the severity, area and duration of the drought evolution process based on the daily SPEI series of 2 398 grids in Guangxi. Several key moments slice of the 2009–2010 drought event are given. Obviously, the spatial patterns demonstrate the heterogeneity of drought intensities. This drought event emerged two extreme drought moments on October 24, 2009 and on February 28, 2010, and its corresponding affected area’s ratios were 85.9% and 97.8% of the whole region. Throughout the whole drought periods, the drought intensity and influence area increased first and then decreased, and then increased and then decreased again along with time variation. It proves the reasonable reliability of the three-dimensional drought identification method proposed in this study. To sum up, the three-dimensional measurement of drought based on OITREE method could deepen our comprehensive understanding e the spatiotemporal evolution of drought events.
Figure 5. Three-dimensional metric for spatiotemporal evolution of a typical drought events from August 2009 to May 2010 in Guangxi, China.
4.2. Temporal variation characteristics of regional drought in Guangxi
In this section, the OITREE method (see Section 2.3.2 for details) is used to identify and portray drought events as a whole with time and space evolution process (Li et al. Citation2015) based on the daily SPEI series of 2 398 grid points in Guangxi during 1979–2018a, and further discusses the time-varying characteristics of multidimensional elements of regional drought events in Guangxi. Specifically, factors such as duration, average intensity, cumulative influential area and integrated intensity index Z of drought events are involved (). The OITREE method identified a total of 158 regional drought events in Guangxi in the last 40 years, including 16 extreme events, 32 severe events, 63 moderate events and 47 light events. Among them, regional drought events with duration within 1 month accounted for 34.81% of the total drought events, 31.01% for 1–2 months, 15.18% for 2–3 months, 16.46% for 3–6 months, and 2.53% for more than 6 months, with the longest duration of 220 d, and the characteristic of continuous drought in autumn, winter and spring seasons. The frequency of regional meteorological drought events in Guangxi generally tends to decrease with the increase in duration.
Figure 6. Variation of duration (a), Average intensity (b), Accumulated maximum influential area (c), integrated intensity index Z (d) of regional drought events in Guangxi from 1979 to 2018.
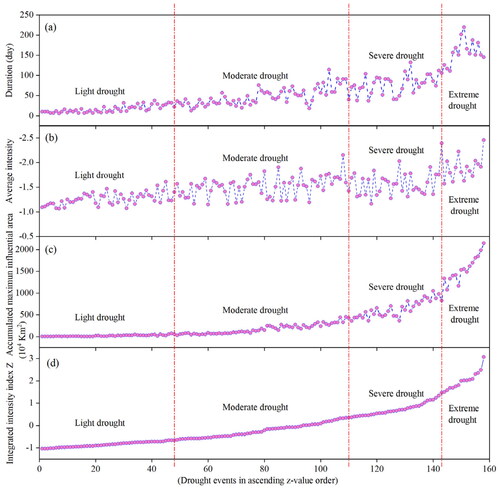
The 158 regional meteorological drought events were sorted according to integrated intensity index Z from small to large (), and were divided into four grades: light (-1.04 < Z ≤ -0.65), moderate (-0.65 < Z ≤ 0.36), severe (0.36 < Z ≤ 1.46), and extreme drought (1.46 < Z ≤ 3.07). Other drought event elements such as the duration (), average intensity (), and cumulative maximum influential area (), all correspond to the ranking of integrated intensity index Z. From , it is easy to know that the multidimensional elements of regional drought events in Guangxi all increased in general with the increase of integrated intensity index Z, although there was a certain local change of increase or decrease fluctuation. Specifically, the duration distribution was (): light drought between 6 and 38 d, moderate drought between 13 and 114 d, severe drought between 37 and 132 d, and extreme drought between 106 and 220 d. The average intensity distribution was (): light drought between [−1.61, −1.07], moderate drought between [–2.15, −1.15], severe drought between [−2.03, −1.16], and extreme drought between [−2.46, −1.57]. The cumulative maximum influential area distribution was (): light drought area between (1.1–73.4) × 104 km2, moderate drought between (29.5–451.62) × 104 km2, severe drought between (359.67–1048.98) × 104 km2, and extreme drought between (828.87–2145.28) × 104 km2.
4.3. Spatial patterns of regional drought in Guangxi
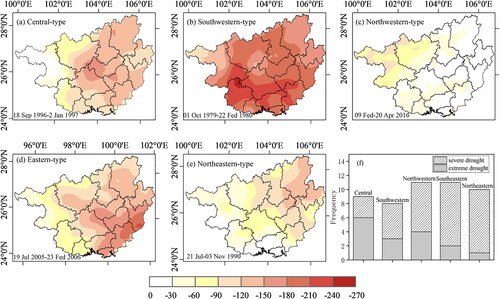
Among the 158 regional droughts in Guangxi that were identified in Section 4.2, there were 16 extreme droughts and 32 severe droughts. In this section, these 48 high-intensity drought events are studied and classified according to the geographical location corresponding to the center of the strongest cumulative intensity of drought events. Finally, these high-intensity events are classified into five distribution types: central type, southwest type, northwest type, southeast type, and northeast type. gives the distribution maps of the cumulative intensity of typical drought events corresponding to these five distribution types. The results showed that the central type drought (September 18, 1996 to January 2, 1997) showed a distribution pattern radiating from the border area of Hechi, Nanning and Guigang as the center; the southwest type drought (October 1, 1979 to February 22, 1980) radiated northeast from the junction of Baise, Nanning and Chongzuo as the center; the center of northwest type drought (February 9 to April 20, 2016) was mainly distributed in Hechi; the center of southeast type drought (July 19, 2005 to February 23, 2006) was mainly distributed in Yulin and Wuzhou; the northeast type drought (July 21 to November 3, 1990) was mainly distributed in the east of Guilin and the northwest of Hezhou. shows the frequency distribution of the five types of drought events, and it is easy to see that the most frequent were the northwest and southeast type drought events, both reaching 11 times (22.9% of 48 events), of which there are 4 extreme events (25% of 16 events) and 2 times (12.5% of 16 events). This was followed by northeast type event, which reached 10 events (20.1% of 48 events), and 1 extreme event (6.25% of 16 events). The number of central type drought events was 9, while the number of events reaching extreme intensity level was as high as 6 times (37.5% of 16 events). The number of southwest type events was 8, and the events reaching extreme drought level was 3 times (18.75% of 16 events). The above results tentatively indicated that there was no significant difference in the occurrence frequency of droughts among the distribution types of high-intensity regional droughts in Guangxi, but extreme drought events were mostly of central, northwestern and southwestern types (81.25%), which meant that Chongzuo, Nanning, Baise and Hechi were the areas with more severe drought in Guangxi. The frequency of the remaining distribution types of drought was relatively small (18.75%), but its comprehensive strength also reached the level of severe and extreme drought intensity, and its disaster impact could not be ignored.
Figure 7. Distributions of the accumulated intensity of typical cases for the five distribulion-types of Guangxi regional meteorological drought events.
5. Discussion and heterogeneous partitioning
5.1. Flash and seasonal drought concurrent in Guangxi
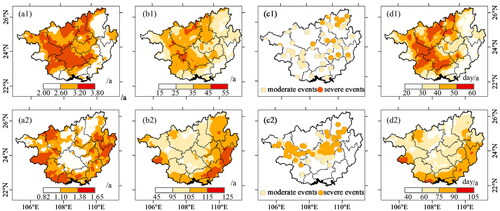
This section focuses on the differences in the temporal and spatial evolution characteristics of flash and seasonal droughts in Guangxi, laying a foundation for further identifying the different formation mechanisms and risk response models of two types of droughts. Specifically, based on daily SPEI series, the droughts are classified into flash droughts (5–30 d) and long-duration seasonal droughts (more than 30 d) according to the drought duration threshold. shows the evolution process of the alternating coexistence of flash drought and seasonal drought in typical years (September 27, 1987 to July 07, 1988); and shows the evolution of spatial pattern of peak intensity of flash drought and seasonal drought in this typical period. shows the differences in the spatial distribution of multidimensional elements such as frequency, intensity, concentration point, and duration of flash drought and seasonal drought in Guangxi in the past 40 years.
Figure 8. The evolution process of flash and seasonal drought elements in typical dry year.
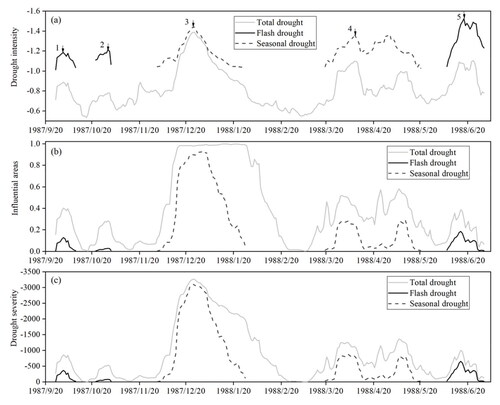
Figure 9. The spatial evolution of daily peak intensity of flash and seasonal droughts in typical dry year.
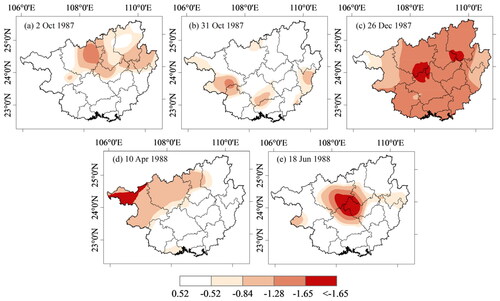
Figure 10. Spatial patterns of frequency, severity, concentration and duration of flash (a1–d1) and seasonal (a2–d2) drought in Guangxi.
From , it can be seen that 3 flash droughts alternated with 2 seasonal droughts in the 1987–1988 drought years, and although the intensity, duration and area of flash droughts were significantly smaller than those of seasonal droughts, they inhibited the drought from lifting or prolonged the impact of drought and connected the two seasonal droughts. This effect can be found in the graphs of intensity and area in , where the occurrence of flash droughts causes the persistence of drought conditions during the interval between two seasonal droughts (for example, the intensity was less than −0.5 and the area was greater than 0); After the end of the 2nd seasonal droughts occurred due to flash droughts, which significantly prolonged and slightly strengthened the impact of droughts (such as the continuation of the drought in May 20, 1988 to July 07, 1988). Especially in the sensitive growth period of regional crops, this flash drought overlaid with the seasonal drought scenario can have a significant impact on crop biomass and yield accumulation (Otkin et al. Citation2016; Wang and Yuan Citation2018; Yuan et al. Citation2019). In addition, the overall drought curves for each element in the figure were obtained by traditional grid point statistics (as in Section 4.1), while the flash drought and seasonal drought curves were identified by the OITREE method (as in Sections 2.3.2 and 5.1). The comparison showed that the overall evolution of the two had a good consistency, which further confirmed the effectiveness of the OITREE method in identifying the spatial and temporal evolution of drought events; at the same time, it showed that the traditional grid point identification of the surface domain evolution of field droughts requires time-by-time grid point information statistics by surface domain to obtain.
Furthermore, shows the spatial pattern evolution of the peak intensity of flash droughts and seasonal droughts (corresponding to 1–5 marked in ) in this typical time period. shows the intensity distribution of the first flash drought in the time period, with the drought area accounting for 40.33% of the total area. The drought influential area was distributed in northern Guangxi, and the drought center was distributed in the northeastern part of Hechi. shows the intensity distribution of the second flash drought in the time period, and the drought area accounted for 28.52% of the total area. The affected area of drought was scattered in parts of southwestern Guangxi, part of northeastern Guangxi, and part of southern Guangxi, and the center of drought was mainly at the junction of Baise and Chongzuo. shows the intensity distribution of the first seasonal drought in the time period, and the drought area accounted for 98.00% of the total area. The affected area of drought was distributed in parts of southwestern Guangxi, part of northeastern Guangxi, and part of southern Guangxi, and the center of drought was mainly at the junction of Baise and Chongzuo. shows the intensity distribution of the second seasonal drought during the period, and the drought area accounted for 33.61% of the total area. The affected area of drought was distributed in the southwestern part of Guangxi, the part of northeastern Guangxi and the part of southern Guangxi. The drought center was located in the northwest of Baise, which meant that this drought event was likely to be an inter-provincial drought. shows the intensity distribution of the third flash drought during the period, the drought area accounted for 30.40% of the total area. The drought affected areas included Baise and Hechi, and the drought center was mainly at the intersection of Nanning, Hechi, Guigang and Liuzhou.
Comparing Figure10a1–d1 and a2–d2, we found that in the past 40 years, the frequency, severity, concentration point and duration of flash drought and seasonal drought in Guangxi showed significant differences in spatial distribution patterns. Specifically, the average annual frequency of flash drought events in Guangxi was 2.00–3.80, and the spatial pattern decreased from northwestern Guangxi to southeastern Guangxi (). The average annual frequency of seasonal drought was 0.82–1.65, and the high-frequency areas of drought were mainly distributed in the western part of Guangxi and some parts of eastern Guangxi (). and show that the average annual severity of flash drought and seasonal drought in Guangxi was generally opposite to the distribution pattern; for instance, the annual average severity of flash drought decreased from northwestern Guangxi to southeastern Guangxi, while the annual average severity of seasonal drought decreased from southwestern Guangxi and southeastern Guangxi to northwestern Guangxi. and show that the concentrated points of flash drought events in Guangxi were distributed almost all over the region, the peak intensity of the concentrated points was mainly moderate drought, and there was a small amount of severe drought. However, the concentration points of seasonal drought were mainly distributed in western and central of Guangxi, and the concentration points of peak intensity moderate drought and severe drought were more, and the central of Guangxi was a concentrated high incidence area of severe drought. This phenomenon indicates that the occurrence of flash drought events in Guangxi had a region-wide dispersion, while the occurrence of seasonal drought events had a local concentration. From and , it can be seen that the annual average cumulative duration variation of flash drought in Guangxi ranged from 20 to 60 d. Among them, the 50–60 d cumulative duration events were mostly distributed in western (specifically, the junction of Baise, Hechi, and Nanning) and northern Guangxi (specifically, the northeastern part of Hechi, the central and northern part of Liuzhou, and the southern part of Guilin). The annual average cumulative duration variation of seasonal drought ranged from 40 to 105 d, among which the accumulation duration of 60–75 d was the main, and it was mainly distributed in southwestern Guangxi (specifically, southwestern Baise), followed by 75–90 d, mainly in southeastern Guangxi, southwestern Guangxi, and northwestern Guangxi. The above results are significantly different from in Section 3.2 in terms of the overall frequency, severity and duration distribution of meteorological droughts in Guangxi, indicating that distinguishing flash droughts from seasonal droughts can help clarify the multidimensional spatial and temporal characteristics of meteorological drought in Guangxi.
5.2. The heterogeneous partitioning of meteorological drought in Guangxi
According to the analysis in Section 5.1, the distinction between flash drought and seasonal drought can more clearly clarify the multidimensional spatial and temporal characteristics of meteorological drought in Guangxi. This section further adopts the three-dimension clustering method of “space-time-scale-attribute” (Wu et al. Citation2020; Wu et al. Citation2018), which can reflect the geographic elements, and conducts a comprehensive partitioning of meteorological drought in Guangxi based on 2 398 grid points in the 1979–2018a daily SPEI series, aiming to reveal its spatiotemporal scale superposition effect. In the analysis, the spatial grid points, 40 years and 365 days, were divided into 4 spatial clusters, 4 annual clusters and 8 daily clusters, respectively, reflecting the spatial and temporal divergent characteristics of the integrated intensity evolution of meteorological drought in Guangxi. Among them, clusters 1–4 or clusters 1–8, represent the change in integrated drought intensity from weak to strong for the spatial or temporal clusters, respectively, and the clustering results of flash drought, seasonal drought and overall drought in Guangxi are shown in .
Figure 11. Tri-clusters results and the interpretation of spatiotemporal differentiations of flash drought (a1–c1), seasonal drought (a2–c2) and total drought (a–c). a1, a2, a. The small multiples to display the spatial distribution of point clusters 1 to 4; b1, b2, b. A linear timeline to show temporal distribution of year clusters 1 to 4; c1, c2, c. The timelines to show the temporal distribution of day clusters 1 to 8.
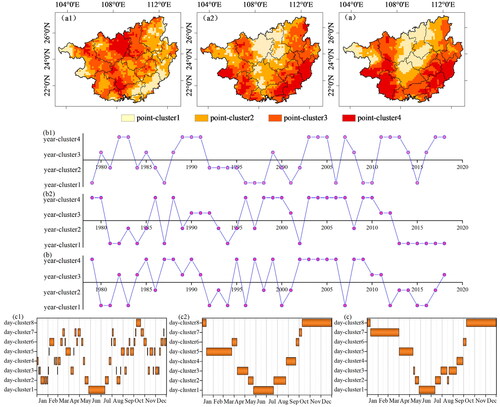
It can be seen from that the comprehensive intensity pattern of flash drought events in Guangxi can be divided into (): southeast Guangxi-part of southwest Guangxi-part of northwest Guangxi (point-cluster 1), corresponding to the light drought areas; central Guangxi-southwest Guangxi-northwestern Guangxi (point-cluster 2), corresponding to the moderate drought areas; northwestern Guangxi-northeastern Guangxi-part of central Guangxi (point-cluster 3), corresponding to severe drought areas; and part of northern Guangxi-part of southern Guangxi (point-cluster 4) can correspond to the extreme drought areas. The results of this flash drought clustering are actually equivalent to the comprehensive superposition of in Section 5.1.
Similarly, the comprehensive intensity pattern of seasonal drought events in Guangxi can be divided into the following (): part of north Guangxi-central Guangxi (point-cluster 1), corresponding to the light drought areas; northeast Guangxi-central Guangxi-southwest Guangxi (point-cluster 2), corresponding to the moderate drought areas; southeast Guangxi and its surrounding areas-part of southwest Guangxi (point-cluster 3), corresponding to the severe drought areas; and part of southeast Guangxi and southwest Guangxi (point-cluster 4) correspond to the extreme drought areas. This seasonal drought clustering result corresponds to the integrated overlay of in Section 5.1.
Similarly, the comprehensive intensity pattern of comprehensive meteorological drought events in Guangxi can be divided into (): northern Guangxi-central Guangxi-southwestern Guangxi (point-cluster 1), corresponding to the light drought areas; northeastern Guangxi and extending to central Guangxi-northwestern Guangxi (point-cluster 2), corresponding to the moderate drought areas; southern Guangxi and extending to southeast Guangxi-northwestern Guangxi (point-cluster 3), corresponding to the severe drought areas; and southwest Guangxi-southeast Guangxi (point-cluster 4), corresponding to the extreme drought areas. The clustering results of the overall meteorological drought in Guangxi correspond well with in Section 3.2.
In terms of annual scale, are the annual-cluster clustering results of flash drought, seasonal drought and total drought in Guangxi, respectively. The results reflect the combined intensity level of flash drought, seasonal drought or total drought events in Guangxi during the study period (year-clusters 1, 2, 3, and 4 correspond to light, moderate, severe, and extreme drought, respectively). The graphs show that there is a significant difference between the line graph of the comprehensive intensity change of the flash drought in Guangxi () over the years and the line graph of the seasonal drought () and the total drought (), while the line graphs of seasonal drought and total drought have a better overall consistency, but there is a more significant difference in individual years, which is the result of the influence of flash drought events in that year. Specifically, as shown in , there are consecutive light and moderate flash drought years from 1992 to 1998a, there are significant strong and weak fluctuations in both seasonal and total droughts in this period, and there are years of extreme drought. Another example is the 2003–2006a consecutive extreme drought years in , while the flash drought in this period fluctuated in intensity, the total drought was continuous severe drought. In addition, the total drought line chart results in are equivalent to the comprehensive overlay of in Section 3.1.
reveal the multiyear average daily comprehensive intensity cluster map of flash drought, seasonal drought and total drought in Guangxi, revealing the intensity level, corresponding time period and occurrence frequency of drought events in the study area. As shown in the figure, the daily distribution of drought strength in Guangxi during the year is generally characterized by a weak drought center from May to summer (June to July) at the end of spring and gradually develops into a strong drought from forward to spring and winter and backward to autumn and winter. Among them, the temporal fragmentation of the integrated intensity profile of flash drought is more significant due to its sudden onset and short duration, while the seasonal and total droughts show a significant increase or decrease in strength over time, with only slight differences in the number of days at a given time. In the flash drought map of , the results of day-cluster 6 are the most discrete, suggesting that flash drought events of this intensity occur in multiple month periods, as shown in the figure. In addition, the results of the integrated daily intensity distribution within the total drought year for are equivalent to the integrated superposition of in Section 3.1.
6. Conclusion
This study revealed the spatiotemporal evolution characteristics of multidimensional elements in Guangxi based on the daily SPEI during 1979–2018a by OITREE method. It discussed the characteristic differences between flash drought and seasonal drought, and realized the three-dimension clustering partition of spatiotemporal heterogeneity of drought comprehensive intensity. The conclusions for this study are as follows:
From 1979 to 2018a, the frequency, intensity, duration, and area of meteorological drought in Guangxi did not increase or decrease significantly, which means that drought events in Guangxi will continue to occur frequently for a long time and have a very large impact. Drought events occur with high frequency, intensity, duration, and influential areas during the autumn and winter seasons but less frequently during the spring and summer.
The statistical analysis of grid points can better demonstrate the spatial heterogeneity pattern of single elements of meteorological drought in Guangxi over the past 40 years, while it is difficult to express the spatial distribution of comprehensive characteristics of multidimensional elements of drought. The OITREE method can identify 158 regional drought events well and reveal five main spatial distribution types of the comprehensive characteristics of meteorological drought multidimensional elements in Guangxi: central type, southwestern type, northwestern type, southeastern type, and northeastern type.
In the past 40 years, there were significant differences in the spatial distribution patterns of the frequency severity, concentration point and duration of flash drought and seasonal drought in Guangxi. Specifically, the average annual frequency of flash drought was 2.00 to 3.80, while seasonal drought was 0.82 to 1.65. The average annual severity of flash drought and seasonal drought showed an opposite distribution pattern. The concentration of flash drought events had a region-wide dispersion, while the concentration of seasonal drought events had a local concentration. The annual average flash drought duration was 20–60 d, while the seasonal drought duration was 40–105 d.
The spatial clustering of the comprehensive intensity of flash drought, seasonal drought and overall drought in Guangxi also showed significant differences, and the spatial pattern of overall drought intensity showed the result of the comprehensive superposition of flash drought and seasonal drought. The temporal clustering of the comprehensive intensity of flash drought, seasonal drought and total drought on the annual and monthly scales revealed the intensity map information of Guangxi meteorological drought in the time dimension.
To sum up, a comprehensive analysis framework for drought characteristics of multidimensional factor’s measurement is proposed in this paper, which is realized by coupling statistic of grid’s drought index with regional integrity identification by OITREE. The grid analysis is more convenient to identify single point drought characteristics, and the OITREE method is better at describing the overall spatiotemporal evolution of drought events. In addition, distinguishing feature differences between flash and seasonal drought is another important achievement for integrated regional drought identification. Furtherly, the three-dimension clustering method is first employed to obtain the spatiotemporal partition. These results can provide effective scientific support for operational drought refined forecast and early warning, and smart regulation of drought disaster risk.
Disclosure statement
No potential conflict of interest was reported by the authors.
Data availability statement
The China Meteorological Forcing Dataset used in this study was provided by National Tibetan Plateau Data Center, which is available from http://data.tpdc.ac.cn/en/data/8028b944-daaa-4511-8769-965612652c49/. The maximum temperature and minimum temperature data used in this study were from China Meteorological Data Network (http://data.cma.cn/).
Additional information
Funding
References
- Allen RG. 2006. Crop evapotranspiration: guidelines for computing crop water requirements. FAO Irrigation & Drainage Paper.
- Andreadis KM, Clark EA, Wood AW, Hamlet AF, Lettenmaier DP. 2005. Twentieth-century drought in the conterminous United States. J Hydrometeorol. 6(6):985–1001.
- Ault A, Toby R. 2020. On the essentials of drought in a changing climate. Science. 368(6488):256–260.
- Cai XH, Zhang WQ, Fang XY, Zhang Q, Zhang CJ, Chen D, Cheng C, Fan WJ, Yu Y. 2021. Identification of regional drought processes in North China using MCI analysis. Land. 10(12):1390.
- Diaz V, Perez G, Van Lanen H, Solomatine D, Varouchakis E. 2020. An approach to characterise spatio-temporal drought dynamics. Adv Water Res. 137:103512.
- Fang GH, Tu YH, Wen X, Yan M, Tan QF. 2019. Study on the development process and evolution characteristics of meteorological drought in the Huaihe River Basin from 1961 to 2015. J Hydraul Eng. 50(5):598–611.
- Guo H, Bao A, Ndayisaba F, Liu T, Jiapaer G, El-Tantawi AM, De Maeyer P. 2018. Space-time characterization of drought events and their impacts on vegetation in Central Asia. J Hydrol. 564:1165–1178.
- Haslinger K, Blöschl G., 2017. Space-time patterns of meteorological drought events in the European greater alpine region over the past 210 years. Water Resour Res. 53(11):9807–9823.
- He H, Liao XP, Lu H, Cheng SR. 2016. Features of long-cycle drought-flood abrupt alternation in South China during summer in 1961–2014. Acta Geograp Sin. 71(1):130–141.
- He J, Yang K, Tang WJ, Lu H, Qin J, Chen YY, Li X. 2020. The first high-resolution meteorological forcing dataset for land process studies over China. Sci Data. 7(1):1–12.
- Herrera Estrada JE, Satoh Y, Sheffield J. 2017. Spatiotemporal dynamics of global drought. Geophys Res Lett. 44(5):2254–2263.
- Hu C, Xia J, She DX, Li LC, Song ZH, Hong S. 2021. A new framework for the identification of flash drought: multivariable and probabilistic statistic perspectives Identification of flash drought. Int J Climatol. 41(13):5862–5878.
- Huang Q, Chen ZS, Kong L, Jiang RF. 2014. Application of joint drought index in drought monitoring: a case study in Shaoguan of Guangdong Province. J Arid Meteorol. 32(4):499–504 + 526.
- Jia YQ, Zhang B. 2018. Spatial-temporal variability characteristics of extreme drought events based on daily SPEI in the Southwest China in recent 55 years. Sci Geograp Sin. 38(3):474–483.
- Liang J, Zhang B, Ma B, Wei J, Zhang J, Ma S. 2018a. Drought evolution characteristics on the Tibetan Plateau based on daily standardized precipitation evapotranspiration index. J Glaciol Geocryol. 40(2):1100–1109.
- Li YJ, Ren FM, Li YP, Wang PL, Yan HM. 2014. A study of the characteristics of the southwestern Chinaregional meteorological drought events during 1960-2010. Acta Meteorol Sin. 72(2):266–276.
- Li YP, Wang JS, Li YH. 2015. Characteristics of a regional meteorological drought event in Southwestern China during 2009-2010. J Arid Meteorol. 33(4):537–545.
- Liu LL, Jiang T, Xu JG, Luo Y. 2012. Research on the hydrological processes using Multi-GCMs and Multi-scenarios in the Xijiang River basin. J Hydraul Eng. 43(12):1413–1421.
- Lloyd-Hughes B. 2012. A spatio-temporal structure-based approach to drought characterisation. Int J Climatol. 32(3):406–418.
- Mo KC, Lettenmaier DP. 2015. Heat wave flash droughts in decline. Geophys Res Lett. 42(8):2823–2829.
- Otkin JA, Anderson MC, Hain C, Svoboda M, Johnson D, Mueller R, Tadesse T, Wardlow B, Brown J. 2016. Assessing the evolution of soil moisture and vegetation conditions during the 2012 United States flash drought. Agric for Meteorol. 218-219:230–242.
- Pendergrass AG, Meehl GA, Pulwarty R, Hobbins M, Hoell A, AghaKouchak A, Bonfils CJW, Gallant AJE, Hoerling M, Hoffmann D, et al. 2020. Flash droughts present a new challenge for subseasonal-to-seasonal prediction. Nat Clim Chang. 10(3):191–199.
- Ren FM, Cui DL, Gong ZQ, Wang YJ, Zou XK, Li YP, Wang SG, Wang XL. 2012. An objective identification technique for regional extreme events. J Climate. 25(20):7015–7027.
- Sheffield J, Andreadis KM, Wood EF, Lettenmaier DP. 2009. Global and continental drought in the second half of the twentieth century: severity–area–duration analysis and temporal variability of large-scale events. J Climate. 22(8):1962–1981.
- Spinoni J, Barbosa P, Jager AD, Mccormick N, Naumann G, Vogt JV, Magni D, Masante D, Mazzeschi M. 2019. A new global database of meteorological drought events from 1951 to 2016. J Hydrol Reg Stud. 22:100593.
- Su BD, Huang JL, Fischer T, Wang YJ, Kundzewicz ZW, Zhai JQ, Sun HM, Wang AQ, Zeng XF, Wang GJ, et al. 2018. Drought losses in China might double between the 1.5 degrees C and 2.0 degrees C warming. Proc Natl Acad Sci USA. 115(42):10600–10605.
- Vicente-Serrano SM,Begueria S,Lopez-Moreno JI. 2010. A multiscalar drought index sensitive to global warming: The standardized precipitation evapotranspiration index. J Clim. 23(7):1696–1718.
- Wang CL, Zou JX, Mai BJ, Chen HH, Tang LS, Duan HL. 2015a. Temporal-spatial characteristics and its variation trend of meteorological drought in recent 50 years, South China. Acta Ecol Sinica. 35(3):595–602.
- Wang LY, Yuan X. 2018. Two types of flash drought and their connections with seasonal drought. Adv Atmos Sci. 35(12):1478–1490.
- Wang Q, Shi P, Lei T, Geng G, Liu J, Mo X, Li X, Zhou H, Wu J., 2015b. The alleviating trend of drought in the Huang‐Huai‐Hai Plain of China based on the daily SPEI. Int J Climatol. 35(13):3760–3769.
- Wang Q, Shi P, Lei T, Geng G, Liu J, Mo X, Li X, Zhou H, Wu J., 2015c. The alleviating trend of drought in the Huang-Huai-Hai Plain of China based on the daily SPEI. Int J Climatol. 35(13):3760–3769.
- Wang QF, Zeng JY, Qi JY, Zhang XS, Zeng Y, Shui W, Xu ZH, Zhang RR, Wu XP, Cong J. 2021. A multi-scale daily SPEI dataset for drought characterization at observation stations over mainland China from 1961 to 2018. Earth Syst Sci Data. 13(2):331–341.
- Wang YM, Yuan X. 2021. Anthropogenic speeding up of South China flash droughts as exemplified by the 2019 summer-autumn transition season. Geophys Res Lett. 48(9):1901.
- Wu XJ, Cheng XC, Zurita-Milla R, Song CQ. 2020. An overview of clustering methods for geo-referenced time series: from one-way clustering to co- and tri-clustering. Int J Geograp Inform Sci. 34(9):1822–1848.
- Wu XJ, Zurita-Milla R, Verdiguier EI, Kraak M-J. 2018. Triclustering georeferenced time series for analyzing patterns of intra-annual variability in temperature. Ann. Am. Assoc. Geograp.. 108(1):71–87.
- Wu YJ, Ji HX, Wen JH, Wu SY, Xu M, Tagle F, He B, Duan WL, Li JX. 2019. The characteristics of regional heavy precipitation events over eastern monsoon China during 1960-2013. Global Planet. Change. 172:414–427.
- Xu XY, Xu K, Yang DW, Li JQ. 2019. Drought identification and drought frequency analysis based on multiple variables. Adv. Water Sci. 30(3):373–381.
- Yan HB, Wei WQ, Lu XJ, Huang YH. 2021. A study of drought and flood evolution in Guangxi based on TRMM data and SPI drought index. Remote Sens Land Res. 33(1):158–166.
- Ye T, Yu JH, Shi XC. 2022. Comparison in developing process between extreme regional flash drought and traditional drought events. Clim Change Res. 18(3):319–327.
- Yevjevich VM. 1967. An objective approach to definitions and investigations of continental hydrologic droughts. Colorado State University, Libraries.
- Yuan X, Wang LY, Wu PL, Ji P, Sheffield J, Zhang M. 2019. Anthropogenic shift towards higher risk of flash drought over China. Nat Commun. 10(1):4661.
- Zarei AR, Mahmoudi MR. 2021. Influence of human activities on meteorological drought and its trends in Iran. Arab J Geosci. 14(10):1–13.
- Zarei AR, Mahmoudi MR, Moghimi MM. 2022. Determining the most appropriate drought index using the random forest algorithm with an emphasis on agricultural drought. Nat Hazards.
- Zarei AR, Shabani A, Moghimi MM. 2021. Accuracy assessment of the SPEI, RDI and SPI drought indices in regions of Iran with different climate conditions. Pure Appl Geophys. 178(4):1387–1403.
- Zhang LY, Jian MQ. 2012. Temporal and spatial distribution and causes of spring drought events in Guangxi. J Catastrophol. 27(1):48–54.
- Zhang Q, Han LY, Zeng J, Wang X, Lin JJ. 2020. Climate factors during key periods affect the comprehensive crop losses due to drought in Southern China. Clim Dyn. 55(9-10):2313–2325.
- Zhang Q, Xie WS, Chen XY, Zhai PM, Wu BW, Duan JQ. 2021. Regional drought process and its variation characteristics in the middle-lower reaches of the Yangtze River from 1961 to 2019. Acta Meteorol Sinica. 79(4):570–581.
- Zhang XQ, Ding MH, Chen YL, Tan ZK. 2014. Reservoirs monitoring in Guangxi based on HJ-1 satellite remote sensing images. J Hydraul Eng. 45(4):427–434.
- Zhao JF, Lu HQ, Li YJ. 2019. Agricultural adaptation to drought for different cropping systems in Southern China under climate change. J Am Water Resour Assoc. 55(5):1235–1247.
- Zhou J, Zhao JH, Li YH, Zou XK. 2021. Objective identification and variation characteristics of regional heavy rain-fall events in the east of Southwestern China. Plateau Meteorol. 40(4):789–800.
- Zhou R, Guo CQ, Pan LY. 2015. Research on the formation mechanism with multiple factors of drought and flood disasters in Karst area of Southwest China. China Rural Water Hydropower. 4:101–104.
- Zhu Y, Liu Y, Wang W, Yuan F, Ma MW, Wu GD, Yin YX. 2021. Analysis of spatio-temporal characteristics of flash drought and slowly-evolving drought using soil moisture percentile. Trans Chin Soc Agric Eng. 37(2):114–122.