
 ?Mathematical formulae have been encoded as MathML and are displayed in this HTML version using MathJax in order to improve their display. Uncheck the box to turn MathJax off. This feature requires Javascript. Click on a formula to zoom.
Abstract
Extreme precipitation (rain or/and snow) in upstream areas of the Himalayan region often triggers water and sediment hazards, including flash floods, landslides, debris flow, and river damming. These hazards often interact with the environmental and human systems, resulting in acute and chronic disasters that deleteriously impact the economy, infrastructure, and livelihoods. As cascading and compound hazards become more common in the Himalayan region, a more holistic approach is needed to understand the complex interaction among human, natural, and engineered systems and tackle problems connected to several system constraints. Recent catastrophes like the 2021 Melamchi disaster cannot be attributed to a single cause; rather, they result from several geomorphologic and hydroclimatic factors and physical processes. Individual and interacting dynamics and their cascading and compounding effects occurred in various settings, from high elevations to river valleys along the Melamchi River. This study diagnoses the likely causal effects of hydroclimatic processes of the 2021 Melamchi disaster by integrating space-borne remotely sensed data, hydrologic and hydrodynamic modeling, and machine learning techniques. We have evaluated several scenarios of landslide damming and breaching and analyzed flooding impacts on major settlements across the Melamchi River. Model outputs evaluated using satellite flood imagery, field-based surveys, and published reports were used to understand the characteristics of the 2021 Melamchi disaster. We find that earlier rain episodes had saturated the soil and increased the river’s water level. Therefore, after the outburst of the landslide dam coupled with heavy downpours, a sudden release of huge water had enormous energy to inundate vast areas of flood plains and damaged settlements near riverbanks far downstream up to the Melamchi Bazar. It was not just one extreme event that led to the devastation but a series of non-extreme events. This further reinforces the idea that not just extreme events, but several not-extreme series of events may lead to disaster. Thus, the chances of such a sequence of cascading events must be investigated for risk computation along with extreme events.
1. Introduction
The Himalayan region is some of the most dynamic regions in the world (Norris et al. Citation2020). This region is known as the water towers of Asia (Immerzeel et al. Citation2020) and is home to a large proportion of the world’s population, ecological diversity, and biological productivity (Kattel Citation2022). The Himalayan region is experiencing a wide range of hazards and stresses, from extreme weather to unmanaged land use practices to ecological degradation (Rusk et al. Citation2022; Kattel Citation2022). Different hazards often interact, and the impacts cascade across human and natural systems (Sharma, Dahal et al. Citation2022; Sharma, Talchabhadel et al. Citation2022). These impacts are expected to increase in the future as the climate is changing and unmanaged land use practices are changing the exposure (Pandit Citation2013). Designing sound strategies to manage the increasing risk of cascading hazards requires a comprehensive understanding of recent hazards, their interactions, and the cascading phenomena across a wide range of spatial and temporal scales (Talchabhadel, Sanjib Sharma et al. Citation2022).
This study characterizes the hydrology and hydrometeorology of the 2021 Melamchi flood of Nepal. A catastrophic debris flood hit the Melamchi Bazar, located 60 km north-east of Kathmandu, on June 15, 2021 (Maharjan et al. Citation2021; Pandey et al. Citation2021; Takamatsu et al. Citation2022). The Melamchi flood killed five people, six were injured, twenty-three remained missing, and over five hundred were displaced (Maharjan et al. Citation2021; Pandey et al. Citation2021; Takamatsu et al. Citation2022). This event has impacted different systems and sectors, including human settlement, transportation, energy, agricultural land, and ecosystems (Maharjan et al. Citation2021; Pandey et al. Citation2021; Takamatsu et al. Citation2022; Gautam et al. Citation2022). The flood interrupted critical infrastructure facilities, including roadways, utility power poles, bridges, and water supply systems. In addition, the headworks for the $800 million Melamchi Project supplying water to Kathmandu were buried under rock and mud (Petley Citation2021; Takamatsu et al. Citation2022; Gautam et al. Citation2022).
The Melamchi disaster results from a sequence of hazards and interactions (Maharjan et al. Citation2021). First, heavy downpours upstream triggered massive erosion, resulting in the temporary damming of the river (Pandey et al. Citation2021) (). The dam breach resulted in a large flow of debris and sediment along the Melamchi River (Maharjan et al. Citation2021; Pandey et al. Citation2021). Such cascading phenomena are often prevalent in the Himalayan region (Sharma, Talchabhadel et al. Citation2022). Recent other examples of cascading hazards include the 2012 Seti flood triggered by high mountains’ rock and ice avalanches (Dwivedi and Neupane Citation2013), the 2014 debris dam in Sunkoshi River created by the mass failure of massive rock fragments (Shrestha and Nakagawa Citation2016), and the seismically induced Baisari Landslide in 2015 (Collins and Jibson Citation2015).
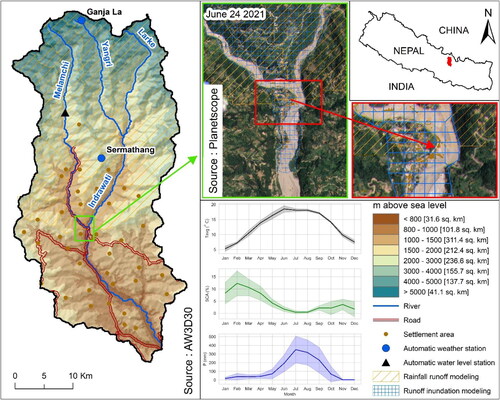
Figure 1. Location and topography of the Melamchi-Indrawati watershed. The elevations are based on the global digital surface model, with a horizontal resolution of 30 meters by the Advanced Land Observing Satellite (ALOS), the data commonly known as ALOS World 3D - 30 m, i.e. AW3D30. The hatched area was modeled for the rainfall-runoff processes, and the river downstream was modeled for runoff propagation and inundation. Daily Planetscope image (https://developers.planet.com/docs/data/planetscope/) of June 24, 2021, available at 3 m spatial resolution, shows the extent of the swollen river around the Melamchi Bazar (river confluence area) superimposed with the OpenStreetMap building data (https://osmbuildings.org/data/) as of 2021-09-08. Monthly variation of average temperature (Tavg), snow cover area (SCA in % of the watershed), and precipitation (P) of the Melamchi watershed during the period from 2011 to 2017. The SCA data are derived from the MODerate Resolution Imaging Spectroradiometer (MODIS (Justice et al. Citation1998) Snow-Covered Area and Grain size (MODSCAG) algorithm (Painter et al. Citation2009), Tavg is computed as an arithmetic average of the maximum and minimum temperature of TerraClimate (Abatzoglou et al. Citation2018), and P is the monthly precipitation of the TerraClimate. The line indicates mean values, and the spread shows the range of ± Standard Deviation computed based on the inter-annual variation.
Several studies have provided important insights into the likelihood of specific hazards under weather and climate extremes (Raymond et al. Citation2020; Zscheischler et al. Citation2020), land-use intensifications (Winkler et al. Citation2021), and infrastructure failures (Koks et al. Citation2019). However, there is a limited understanding of how one hazard can trigger the other. Cascading hazards lead to greater impacts than expected from a single hazard (AghaKouchak et al. Citation2018). The chain of hazards can often act as a series of toppling dominoes, turning them into a disaster (Sharma, Talchabhadel et al. Citation2022). Cascading hazards and their impacts are expected to rise under changing climate and intensifying settlement (Lawrence et al. Citation2020). Nepal ranks as the fourth country regarding climate hazards and 20th position in connection with multihazards (United Nations Development Programme Citation2004; Gautam et al. Citation2021). Climate change is expected to increase rainfall intensity, raise the temperature, induce the early onset of snowmelt, and escalate the snow/glacier melt rate (Kemp et al. Citation2022). Development activities are more concentrated in the flood-prone region (Kundzewicz et al. Citation2014). Haphazard earthen road construction in recent decades has raised the devastating risk of landslides and flooding, particularly during the monsoon period (McAdoo et al. Citation2018; Talchabhadel et al. Citation2021). There is a need for integrated models, modeling frameworks, and a comprehensive analysis that can account for complex interactions across different hazards in the context of multiple interacting stresses (e.g. hydrometeorological extremes and land use/land cover changes), especially at decision-relevant spatial and temporal scales (Wang et al. Citation2018).
We assemble remote sensing, hydrologic-hydrodynamic (H&H) modeling, and machine learning techniques to develop an integrated modeling framework to characterize the cascading mechanism and the impacts of the 2021 Melamchi flood. The framework consists of hydrometeorological observations, H&H models, land use/land cover (LULC) characteristics, and landslide susceptibility (LS) analysis. We used ground-based rainfall observation, water-level records, remotely sensed information, and satellite imagery to predict flood inundation extent. Hydrometeorological observations are used to force the hydrologic model and generate streamflow predictions. We characterize the Melamchi flood disaster under different landslide dam break scenarios. A comprehensive understanding of an extreme event’s hydrologic and hydrometeorological characteristics is crucial to improving the forecasting capabilities and informing the design of adaptation responses and risk management strategies (Cassardo Citation2009; Sillmann et al. Citation2017; Ma et al. Citation2021).
2. Study area
The Melamchi-Indrawati (M-I) watershed is characterized by rugged topography and narrow valleys with steep slopes due to the Himalayan orogeny. The elevation varies from 629 to 6075 m above sea level, with a catchment area of 1228 km2. The M-I watershed is characterized by a range of climate classes varying from temperate to polar (Karki et al. Citation2016) and possesses a high stream network density; many streams originate at high altitudes, including glaciers. They suddenly reach lower altitudes within a short distance, making them fast-flowing rivers/streams with steep gradients. The steep gradient also leads to quicker propagation of surface runoff carrying a lot of energy. The river gorges and upstream catchments are highly susceptible to mass failures and soil erosion.
We used Landsat-based LULC products, developed by Uddin et al. (Citation2021) from 2000 to 2018, to estimate the change in the land cover along the Melamchi branch of the Indrawati River basin (: 1 km buffer) and also the entire M-I basin (Figure S1). Significant cropland areas are converted to built-up areas within the catchment. In particular, the transition from cropland to built-up areas is dominant across the 1 km buffers on both sides of the Melamchi River, as shown in . This so-called development along the river corridor increased the flood risk, as seen in the current flooding. The sediment transport in the river is dependent on the lithological unit. The weathering tendencies of the intact and exposed bedrock, the mantle cover’s thickness, and the bedrock’s structural conditions are highly influential. The Main Central Thrust (MCT) separates the high-grade rock of the Higher Himalayan complex from the low-grade or un-metamorphosed rock of the Lesser Himalayan sedimentary zone (DiPietro and Pogue Citation2004) below the confluence of the Melamchi and Indrawati rivers. The upper part of the watershed has lithological units associated with Higher Himalayan complexes like Gneiss, Quartzite, and Marble. In contrast, the areas below the MCT are characterized by low-grade metamorphic rocks like phyllite, slates, Schichts metasandstone, etc.
Figure 2. a-b) Temporal evolution of annual coverage of different land-use types from 2000 to 2018 across the 1 km buffer of the river centerline of the Melamchi River and the Indrawati River downstream of the confluence. Across the 1 km buffer of the Melamchi River, a noticeable land-use change could be observed; in particular, the built-up area increased by about three times in the recent year compared to the 2010s. Landslide susceptibility maps of Indrawati basin: c) pre-Gorkha earthquake 2015 and d) post-Gorkha earthquake. Insets c* and d* show a typical representation of a substantial increase in landslide susceptibilities.
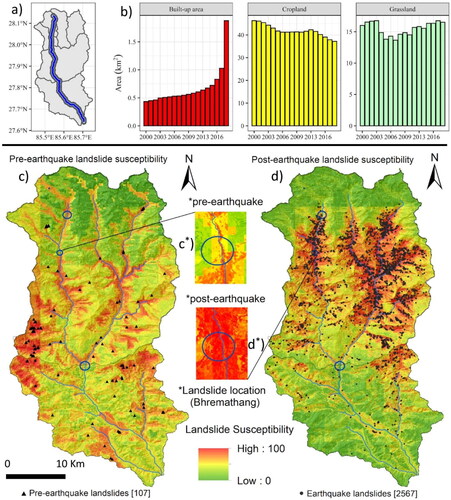
Not many landslides were reported before the Gorkha earthquake of 2015 (GE2015), but the number of landslides increased during and after GE2015. For example, 107 landslides were reported before the GE2015, whereas more than 2500 earthquake-induced landslides were reported after the GE2015 (Gnyawali et al. Citation2018; McAdoo et al. Citation2018). Gnyawali et al. (Citation2018) prepared a database of all landslides in Sindhupalchok, Nepal, present before the GE2015, and those generated by the earthquake. Especially after the GE2015, the entire catchment across high elevations is susceptible to landslide and sediment transport during monsoon extreme precipitation events (). We show that the LS pattern has significantly increased in the basin after GE2015.
Based on this pre-and post GE2015 landslide information, we ran a Random Forest model (Dahal et al. Citation2021) in Google Earth Engine platform to evaluate the spatial details of susceptibility across the M-I watershed. We present the performance of LS susceptibility (Figure A1), feature importance (Figure A2), and data/variables used for machine learning model (Table A1) in the Appendix. We observe that the LS is more clustered in the upstream area of the M-I watershed (Melamchi, Yangri, and Larke basins). A new landslide is generally triggered when susceptibility values increase (see Inset Maps in and ). In addition, future landslides can be expected in Melamchi, Yangri, and Larke sub-basins; it is critical to assess the resiliency of settlements and infrastructures in these areas.
3. Cascading phenomenon of Melamchi disaster 2021
pictures an overview of the Melamchi disaster. Only four days after the Department of Hydrology and Meteorology (DHM) announced the monsoon onset, the Melamchi Bazar witnessed a massive flood. The daily rainfall totals on 13 and 14 June 2021 were 18.8 mm and 11.8 mm, respectively, at the nearby meteorological station, Sermathang station, about 15 km from the AWL station at the Nakote station (refer to ). The satellite-based rainfall estimates derived from the Integrated Multi-satellitE Retrievals for Global Precipitation Measurement (IMERG) Early, Late, and Final runs show the daily rainfall total to be 1, 1, 6 mm on the day of the event and 46, 36, 53, mm on the previous day, respectively for three IMERG runs. The cumulative 10-day rainfall amounts are 80, 67, and 113 mm, respectively. We find the maximum rainfall intensity of all three runs is about 8 mm/h on the previous day. None of these rainfall estimates are typical of an extreme rainfall scenario, such as cloudburst events, in the region. This region is among the high-rainfall areas in eastern Nepal, and it is quite normal that a single-day rainfall of over 100 mm occurs almost every year in that area. After the GE2015, the region was severely affected, and several landslides and fractures were present in the Melamchi watershed (Zekkos et al. Citation2017; Gnyawali et al. Citation2018; Pandey et al. Citation2021). Water infiltration through these fractures could likely cause hillslope instability and mass failure. As a result, although this rainfall event is not considered a hydrometeorological extreme, it could trigger sediment disasters. Massive debris flow was observed due to the transport of landslide masses and high-altitude glacial deposits (Maharjan et al. Citation2021).
Figure 3. Overview of the Melamchi event showing the locations of four typical hazards that modulated the disaster. a) high elevation lake (2665 m2) observed in satellite imagery before the Melamchi event and its disappearance, indicating a glacial lake outburst flood, b) a representative example showing how old riverside landslides before the Melamchi event reactivated during the Melamchi disaster, c) another representative example of how new landslide formed after the event, and d) Melamchi Bazar area and deposited sediment coverage. The map is prepared using the Planet imagery base map (https://developers.planet.com/docs/data/planetscope/), with a spatial resolution of 4.7 meters.
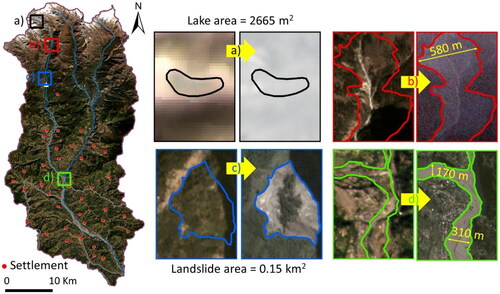
The automatic water level (AWL) data at Nakote showed a drop of two meters in an hour from 6:00 PM and a sudden increase of three meters within a couple of minutes. The DHM reported that the stations halted data transmission because the flood washed away the data acquisition system. These observations provide an indication of landslide damming for about an hour upstream. And a subsequent breach resulted in a highly sediment-laden flow. The initial reports (Maharjan et al. Citation2021; Pandey et al. Citation2021) even indicate more than 10 m river aggradation in the Melamchi Bazar due to the sediment transport along the meandering and the river confluence. In addition, a small glacial lake of around 2500 m2 at a high elevation was reported to be outbursted upstream of landslide damming (Maharjan et al. Citation2021). Though the amount of water is not a dominant factor for this particular disaster, an associated flood could sweep the natural dams and erode substantial sediments across its course, reaching the landslide-damming location. In our modeling effort, we did not comprehensively look at this lake outburst dynamics; however, we incorporated the water volume into the landslide damming using hydrologic modeling. A detailed diagnosis of this would be required for further analyses.
However, we try to assess whether the hydrometeorological condition of this particular event was an extreme case scenario. Upon a retrospective analysis of long-term historical data, we find that the Melamchi River’s highest recorded mean daily streamflow at Helambu (catchment area = 84 km2), 3.5 km upstream of the AWL station, was 288 m3/s on August 1, 2000. The highest recorded one-day rainfall total was 200 mm on August 13, 2010. Therefore, the hydrometeorological synopsis of the Melamchi disaster is smaller in magnitude compared to the historical maximums. However, it points to moderate hydrometeorological conditions that could modulate cascading multihazards. Therefore, the locations of higher LS coupled with higher stream power and localized torrential rainfall are most vulnerable to cascading hazards and require attention for risk assessment.
4. Methods
We gather the periodic rainfall data of Sermathang (5 min interval) and Ganja La (5 min interval) data from the automatic weather stations of the DHM and ICIMOD, respectively. Then, using the Thiessen polygon method, we compute the area rainfall at the sub-basin scale. Next, the LULC and soil-related data are used to estimate Curve Number (CN) values. The CN values are critical to estimate the excess rainfall due to a storm event by combining soil distribution and prevalent patterns of LULC.
4.1. Landslide susceptibility mapping
We collect landslides inventories delineated by (Gnyawali et al. Citation2018), available at https://scholarbank.nus.edu.sg/handle/10635/148909, and also explored earthquake-triggered landslides delineated by (Zekkos et al. Citation2017) available at https://www.sciencebase.gov/catalog/item/582c74fbe4b04d580bd377e8. We use Random Forest machine learning to prepare landslide susceptibility maps. The Random Forest classifiers build several de-correlated bootstrapped random decision trees and aggregate them to categorize using the mode of predictions from all decision trees. We use the Random Forest classifiers available in Google Earth Engine platform.
4.2. Rainfall-runoff modeling using HEC-HMS
Figure S2 shows a schematic diagram of rainfall-runoff modeling used to estimate streamflow. A major component of the rainfall-runoff process is concisely described as follows:
4.2.1. Terrain preprocessing and basin delineation
We use the 30 m resolution digital elevation model (DEM) to develop the rainfall-runoff model using the HEC-HMS. Thirteen sub-basins are created from the M-I headwater location to Melamchi Bazar, with a total catchment area of around 800 km2. The entire catchment is delineated to obtain junctions, reaches, and a single outlet. The final outlet is placed in the Melamchi Bazar, which is the prime area of our study. The general characteristics of the catchment area are shown in Table S1 in the supplement section.
4.2.2. Flow loss - SCS curve number method
We use the SCS curve number method to calculate the flow loss in our simulation. The SCS curve number method is a simple, and commonly used technique for determining the approximate runoff from rainfall in a particular area (US Army Corps of Engineers Citation2016). Although the method is designed for a single storm event, it can be scaled to find average annual runoff values. The SCS curve number is an empirical technique to calculate runoff by eliminating abstracted rainfall. The excess runoff is expressed as a combination of land use, soil properties, and relative wetness.
[1]
[1]
where, P = accumulated rainfall, Ia = Initial abstraction and S = potential maximum retention.
4.2.3. Flow transform and routing
The flow transform method calculates the surface runoff. We use the SCS unit hydrograph transform method in this study. This method first defines a curvilinear unit hydrograph and then fits the triangular unit hydrograph to calculate the base time (Natural Resources Conservation Service Citation2007). Next, we must manually calculate and insert the lag time (L) into the HEC-HMS. The lag time is sixty percent of the Time of Concentration (Tc). Tc is the time taken by runoff at a hydraulically farthest point to reach the watershed’s outlet. We calculated Tc and L as follows:
[2]
[2]
[3]
[3]
where, L = lag time in hours, Tc = Time of concentration in hours, l = flow length in feet, Y = Basin slope in % and S = potential maximum retention = (1000/CN) − 10
Details of subbasins, their characteristics, and the lag time are shown in Table S1 in the supplement section. The flood routing was carried out using the Muskingum-Cunge method. The modified version of the Muskingum method is based on continuity and the simplified momentum method. (Cunge Citation1969) evaluated the numerical diffusion that is produced using the Muskingum routing equation. The Muskingum-Cunge method is also mentioned as a "variable coefficient" method since the routing parameters are recomputed every time step (US Army Corps of Engineers Citation2016). The routing parameters are computed based on the flow depth and channel properties. The parameters and their value used in the Muskingum-Cunge method are summarized in Table S2. We assign CN numbers for each sub basin as described by United States Soil Conservation Service (1986). It requires 1) a LULC map and 2) a hydrologic soil group map to assign a CN number. We used the LULC map of Nepal prepared for 2010 (Uddin et al. Citation2015; FRTC Citation2022). We used HYSOGs250m developed by (Ross et al. Citation2018) for the hydrologic soil group map.
4.3. Runoff inundation
We use a 1D steady analysis of the peak flood discharge in HEC-RAS 6.0 to obtain the flood depth, velocity, and inundation extent (Brunner Citation2020). We employ a normal depth as the boundary condition and the mixed flow regime for calculations. In addition, the results from the rainfall-runoff model are used as inflow boundary data. We use a 30 m resolution DEM to build the terrain model in the HEC-RAS system. Melamchi and Yangri are two major upstream reaches with 2 and 1.1 km lengths. The M-I River is our focal area, where the settlements are also concentrated. We cover approximately 1.34 km of the section after the confluence of two major rivers upstream. The spacing of both Melamchi and Yangri cross sections was initially maintained at 100 m.
Similarly, the cross-section width of the Melamchi and Yangri rivers is 200 m and 100 m, respectively. However, the downstream reach’s width is 200 m to cover broad floodplains, and the cross-section spacing is 50 m for the M-I reach (Figure S3). The manning’s roughness coefficient adopted in this study is 0.035 for the river channel and 0.04 for the side banks based on visual inspection of aerial imageries. After the preliminary simulation, we added additional cross-sections in a few previously short segments. In total, nine flow profiles were set within the steady flow module. To determine the magnitude of peak flow at the Melamchi Bazaar, a schematic hydrological model was run in HEC-HMS, keeping the actual routing parameters.
5. Results and discussion
shows hydrographs for the minimum and maximum value of likely landslide dam break scenarios at major junctions (red), subbasins (blue), and outlets near Melamchi Bazar (green) (refer to for spatial location). Based on topography, river cross-section, and downstream water level changes measured at AWL stations at the Nakote station, we assume the landslide dam obstructed the river flow for eight to sixteen hours. Similarly, the average breach width and dam breaching time (between 4 to 12 min) are based on the equations proposed by Froehlich (Citation2008). We use an overtop dam break method in HEC-HMS (US Army Corps of Engineers Citation2016) to predict peak discharge based on dam breach. We find that 12- to 16-h obstruction seems more realistic than 8- and 10-h scenarios. We estimate nearly 2000 m3/s of peak discharge from the landslide damming location with a scenario of 16 h damming and a dam breaching time of 4 min (i.e. 16h_4min scenario). Similarly, the peak flow is estimated to be approximately 350 m3/s for 8-h damming and 12 min breaching time (i.e. 8h_12min scenario). The peak discharges for other scenarios are shown in . These dam-break peak discharges are added to rainfall-driven river runoff. show the hydrograph at intermediate locations (junctions and subbasins near the Melamchi Bazar) and outlet locations in Melamchi Bazar. The maximum peak discharge for the 16h_4min scenario is 1921.6 m3/s at the close location from the dam breach point and is attenuated to 1349.6 m3/s at junction 7 (). The discharge near the Melamchi Bazar for the 16h_4min scenario is only 288.7 m3/s, about 1.5 times the peak generated by rainfall runoff during the event.
Figure 4. a) Different scenarios of peak discharge from the landslide damming location based on water volume stored time and landslide dam breaching time, b) spatial location of major junctions and subbasins of the hydrologic model used in this study, c) intermediate (red and blue hydrographs) and outflow (green hydrographs) discharge (Q) at major junctions and subbasins simulated through the hydrologic model for the minimum value of peak discharge (i.e. 352.3 m3/s for 8-h damming and 12 min dam breaching), d) same as c but for the maximum value of peak discharge (i.e. 1921.6 m3/s for 16 h damming and 4 min dam breaching), and e) close view of intermediate discharge of subplot d) to show the routed peak discharge at Junction 7. The outflow discharges from Melamchi (left catchment: solid green), and Yangri and Larke (right catchment: dashed green) are used for hydrodynamic simulation in Melamchi Bazar. Damming scenarios effect could be seen in the left catchment, i.e. solid green.
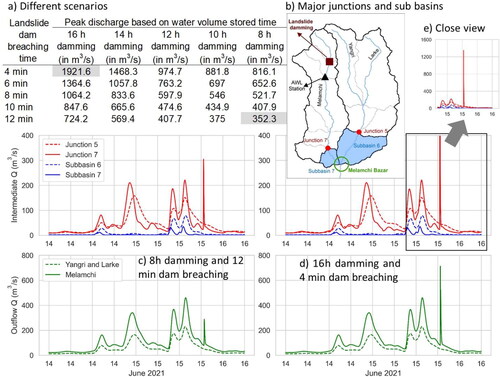
Earlier rainfalls (moderate and a few peaks) have already saturated the soil and increased the river’s water level. A sudden release of a huge volume of water from a dam breach possesses enormous energy. It brings substantial water to flood plains and even settlements near riverbanks. Therefore, a reasonable estimate of dam breach volume is critical to inform detailed flood characteristics downstream. Below we show simulated inundation based on several scenarios to assess the likely hydrometeorological scenario of the Melamchi disaster. The peak discharge for the 8h_12min scenario is 352.3 m3/s at the close dam breach location and is attenuated to 304.4 m3/s at junction 7 (). The discharge near the Melamchi Bazar for the 8h_12min scenario is 712.2 m3/s, even less than the peak generated by a rainfall-runoff process. It indicates that the small-scale landslide blockage would not influence the settlement near the Melamchi Bazar. However, landslides greatly control the volume of sediment transport, and the riverbed could aggravate substantially. As a result, similar nature of hydrometeorology could result in disastrous inundation. Figure S4 shows the spatial distribution of simulated inundation for different scenarios. The maximum simulated depth for no damming scenario (i.e. subplot i) is 4.3 m around the river confluence. At the same location, the inundation depth is found to be a) 6.5 m for a 16h_4min scenario, b) 6.1 m for a 16_6min scenario, c) 5.7 m for a 16_8min scenario, d) 5.3 m for a 16_10min scenario, e) 5.7 m for a 14_4min scenario, f) 5.5 m for a 14_6min scenario, g) 5.1 m for a 14_8min scenario, h)5.0 m for a 12_4min scenario. The scenarios whose peak discharge is less than the case of the 12h_4min scenarios are not shown.
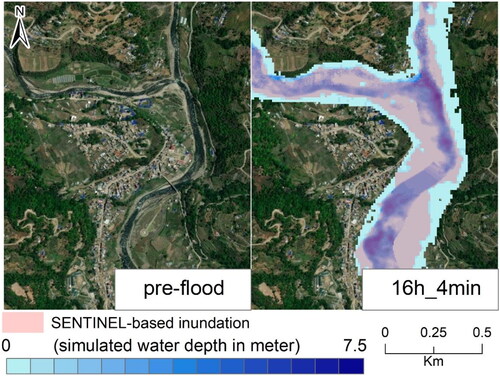
shows pre- and post-flood scenarios based on hydrologic-hydrodynamic simulation for the case of the 16h_4min scenario and remotely sensed information. The simulated inundation pattern is similar to the World Bank Group study by (Takamatsu et al. Citation2022). Over ten trail bridges and a few reinforced concrete bridges, a hydropower project, and the headwork of the Melamchi Water Supply Project were greatly affected by the flood (Pandey et al. Citation2021; Gautam et al. Citation2022). Also, as many buildings were constructed in a debris fan and riverbank, many such buildings were either washed away, heavily sedimented, or damaged (Takamatsu et al. Citation2022; Gautam et al. Citation2022). Based on the open street map building layer, nearly 16,735 m2 of building areas were substantially affected by inundation. Of these, 36% of buildings were inundated with 0.5 m water depth. Almost 45% of building areas were inundated between 0.5 to 1.0 m water depth, 7.9% with 1.0 m to 2.0 m, 7.9% with 2.0 m to 3.0 m, and the remaining 2.2% greater than 3.0 m. Google Earth Imagery also confirms that several buildings were affected by inundation. The flood severely affected almost all buildings on the river banks (Gautam et al. Citation2022). Site inspection data showed an inundation extent of over 7 m (i.e. at some locations, up to 10 m) (Pandey et al. Citation2021; Gautam et al. Citation2022). Our simulation could not capture such extreme depths. However, spatial patterns of observed flood inundation generally match the simulated. Also, the simulated inundation extent seems slightly higher than satellite-based inundation estimates. Lower depths inundation (less than a meter) was prevalent over large areas, and many buildings had such shallow inundations. Lower depths inundation may not be well captured by remotely sensed information (Notti et al. Citation2018). The H&H model simulation can be fine-tuned upon the availability of detailed ground-based information.
Figure 5. Pre-flood scenario and spatial distribution of simulated inundation for 16 h damming and 4 min dam breaching (16h_4min) overlaid over SENTINEL-based inundation across Melamchi Bazar.
6. Conclusion and way forward
This study provides a diagnostic analysis of the 2021 Melamchi flood. We developed an integrated modeling framework to characterize the cascading mechanism. The framework comprised hydrometeorological observations, the H&H model, LULC characteristics, and landslide susceptibility analysis. We analyzed the potential drivers of the Melamchi flood and demonstrated the modeling capabilities for cascading hazards. Our result supports the hypothesis that the Melamchi disaster was caused by a sequence of hazards and interactions, including heavy rains, erosion of glacial deposits, overtopping of a glacial lake, temporary damming of a river reach, dam breach, and a large flow of debris and sediment along the river.
Rainfall is a key driver of landslides. Rainfall (intensity and duration) thresholds are often used to communicate the chances of rainfall-induced landslides in a specific region (Dahal and Hasegawa Citation2008; Segoni et al. Citation2014; Vaz et al. Citation2018). Integrating the forecasts of rainfall thresholds with soil moisture conditions can provide valuable information to develop a reliable regional-scale landslide early warning system (Segoni et al. Citation2018). Several studies have shown the importance of satellite products for improving the modeling, simulations, and predictions of landslides in the Himalayan region (Talchabhadel, Shankar Sharma et al. Citation2022). Satellite products such as synthetic aperture radar (SAR) satellite images and accurate Interferometric SAR (InSAR) algorithms (Moretto et al. Citation2021) provide continuous monitoring of surface movement, which is critical to predicting landslides. However, the coarser spatial resolution of satellite rainfall estimates and remotely sensed soil moisture data constraints their ability to capture localized phenomena. Downscaling and bias correction techniques can improve the estimates of satellite-derived products, but that requires observation data, often lacking at high altitudes in the Himalayas (Talchabhadel et al. Citation2021; Talchabhadel, Shankar Sharma et al. Citation2022).
LS analysis revealed a considerable increase in landslide likelihood following the GE2015. In addition, the neighboring river basins have also been identified as landslide-prone zones. In such areas, landslides can be triggered even with little rainfall and cause river obstruction. A river with a steep channel has more stream force, eroding huge amounts of sediment (Zhou et al. Citation2019). Similar incidents have been reported across the central Himalayas (Sharma, Talchabhadel et al. Citation2022). Such episodes are becoming more common in the Central Himalayas, suggesting a change in LS following the GE2015 (Gnyawali et al. Citation2018). Timely and precise susceptibility assessments can provide information about landslide triggers and their changes. The mountainous terrain is highly vulnerable to landslides - particularly during the summer monsoon and earthquakes. Surface materials get easily detached from the unstable slopes during heavy and/or continuous rainfall. The large chunk of mud & debris downfall from the hills and form barrier lakes across the narrow gorges. Such barrier lakes impound a large amount of water and can trigger a disaster chain when outbursts occur. Developing reliable early warning systems and risk communication strategies could help reduce the impacts of cascading hazards in the downstream communities if such damming occurs in the remote upstream. Similarly, detailed geophysical and geotechnical assessment is crucial to understand the material properties of landslide dams and their breaching phenomena (Fan et al. Citation2020).
Mass failure, such as glacial lake outbursts, landslides, and debris flow, often cascades to cause sediment-laden floods in mountain topography (Nepal et al. Citation2014; Nepal et al. Citation2018; Sharma, Talchabhadel et al. Citation2022). Geomorphology, settlement pattern, and critical infrastructure distribution further exacerbate the impacts of cascading hazards (Lawrence et al. Citation2020). There is an urgent need to understand the extent, scope, and implications of cascading changes (Challinor et al. Citation2018; Willner et al. Citation2018; Koks et al. Citation2019). Reliable predictions of cascading hazards and risks require integrated models, modeling frameworks, and analyses that can account for nonlinear interactions among multihazards across various spatial and temporal scales. More research is needed to improve our fundamental understanding of key drivers of cascading hazards and their interactions in high mountains, mid-hills, and low-lying lands. Reliable predictions can inform the design of sustainable risk management strategies, for example deciding structural or nature-based hazard mitigation solutions and when and where to relocate the settlement. Developing multi-objective risk management strategies will require collaborative and interdisciplinary research with engineers, climate scientists, economists, and policymakers.
Disclaimer
The views and interpretations in this publication are those of the authors, and they are not necessarily attributable to their organizations.
Supplemental Material
Download MS Word (1.5 MB)Acknowledgments
The authors would like to thank the Department of Hydrology and Meteorology (DHM) and the International Center for Integrated Mountain Development (ICIMOD) for sharing the hydrometeorological data.
Code and model availability
The Google Earth Engine code and dataset are available on GitHub (https://github.com/geokshitij/hazardMap). H&H models used in this study are available upon a reasonable request.
Disclosure statement
No potential conflict of interest was reported by the authors.
References
- Abatzoglou JT, Dobrowski SZ, Parks SA, Hegewisch KC. 2018. TerraClimate, a highresolution global dataset of monthly climate and climatic water balance from 1958–2015. Sci Data. 5:170191.
- AghaKouchak A, Huning LS, Chiang F, Sadegh M, Vahedifard F, Mazdiyasni O, Moftakhari H, Mallakpour I. 2018. How do natural hazards cascade to cause disasters? Nature. 561(7724):458–460.
- Brunner GW. 2020. HEC-RAS, River analysis system hydraulic reference manual. In: US army corps of engineers. Davis, CA: Hydrologic Engineering Center (HEC).
- Cassardo C. 2009. The role of meteorological models in the prediction of weather hazards—the European approach. In: Jones JAA, Vardanian TG, Hakopian C, editors. Threats to global water security. Dordrecht, Netherlands: Springer; p. 265–276; [accessed 2022 Sep 8].
- Challinor AJ, Adger WN, Benton TG, Conway D, Joshi M, Frame D. 2018. Transmission of climate risks across sectors and borders. Phil Trans R Soc A. 376(2121):20170301.
- Collins BD, Jibson RW. 2015. Assessment of existing and potential landslide hazards resulting from the April 25, 2015 Gorkha, Nepal earthquake sequence. (ver. 1.1, August 2015): U.S. Reston, VA: Geological Survey Open-File Report 2015–1142; p. 50.
- Cunge JA. 1969. On the subject of a flood propagation computation method (Muskingum method). J Hydraulic Res. 7(2):205–230.
- Dahal K, Liu G, Gnyawali KR, Talchabhadel R, Kumar S. 2021. Framework for multi-hazards susceptibility assessment in Google Earth Engine. New Orleans, LA: AGU Fall Meeting. https://agu.confex.com/agu/fm21/meetingapp.cgi/Paper/828783.
- Dahal RK, Hasegawa S. 2008. Representative rainfall thresholds for landslides in the Nepal Himalaya. Geomorphology. 100(3–4):429–443.
- DiPietro JA, Pogue KR. 2004. Tectonostratigraphic subdivisions of the Himalaya: a view from the west: Himalayan tectonostratigraphic zones. Tectonics. 23(5):TC5001.
- Dwivedi S, Neupane Y. 2013. Cause and mechanism of the Seti River flood, 5th May 2012, western Nepal. J Nepal Geol Soc. 46:11–18.
- Fan X, Dufresne A, Siva Subramanian S, Strom A, Hermanns R, Tacconi Stefanelli C, Hewitt K, Yunus AP, Dunning S, Capra L, et al. 2020. The formation and impact of landslide dams – State of the art. Earth-Science Reviews. 203:103116.
- Froehlich DC. 2008. Embankment dam breach parameters and their uncertainties. J Hydraul Eng. 134:1708–1721.
- FRTC. 2022. Land cover of Nepal. Forest Research and Training Centre (FRTC). [accessed 2022 Jul 14]. https://doi.org/10.26066/RDS.1972729
- Gautam D, Adhikari R, Gautam S, Pandey VP, Thapa BR, Lamichhane S, Talchabhadel R, Thapa S, Niraula S, Aryal KR, et al. 2022. Unzipping flood vulnerability and functionality loss: tale of struggle for existence of riparian buildings. Nat Hazards. [accessed 2022 Jul 14]. https://doi.org/10.1007/s11069-022-05433-5
- Gautam D, Thapa S, Pokhrel S, Lamichhane S. 2021. Local level multi-hazard zonation of Nepal. Geomatics Nat Hazards Risk. 12(1):405–423.
- Gnyawali KR, Adhikari BR, Mc Adoo BG. 2018. Landslides in Sindhupalchok District, Nepal before and after the 2015 Gorkha Earthquake. [accessed 2021 Jul 14]. ScholarBank@NUS Repository. [Dataset]. https://scholarbank.nus.edu.sg/handle/10635/148909
- Immerzeel WW, Lutz AF, Andrade M, Bahl A, Biemans H, Bolch T, Hyde S, Brumby S, Davies BJ, Elmore AC, et al. 2020. Importance and vulnerability of the world’s water towers. Nature. 577(7790):364–369.
- Justice CO, Vermote E, Townshend JRG, Defries R, Roy DP, Hall DK, Salomonson VV, Privette JL, Riggs G, Strahler A, et al. 1998. The moderate resolution imaging spectroradiometer (MODIS): Land remote sensing for global change research. IEEE Trans Geosci Remote Sensing. 36(4):1228–1249.
- Karki R, Talchabhadel R, Aalto J, Baidya SK. 2016. New climatic classification of Nepal. Theor Appl Climatol. 125(3–4):799–808.
- Kattel GR. 2022. Climate warming in the Himalayas threatens biodiversity, ecosystem functioning and ecosystem services in the 21st century: is there a better solution? Biodivers Conserv. 31(8–9):2017–2044.
- Kemp L, Xu C, Depledge J, Ebi KL, Gibbins G, Kohler TA, Rockström J, Scheffer M, Schellnhuber HJ, Steffen W, et al. 2022. Climate Endgame: exploring catastrophic climate change scenarios. Proc Natl Acad Sci USA. 119(34):e2108146119.
- Koks EE, Rozenberg J, Zorn C, Tariverdi M, Vousdoukas M, Fraser SA, Hall JW, Hallegatte S. 2019. A global multi-hazard risk analysis of road and railway infrastructure assets. Nat Commun. 10(1):2677.
- Kundzewicz ZW, Kanae S, Seneviratne SI, Handmer J, Nicholls N, Peduzzi P, Mechler R, Bouwer LM, Arnell N, Mach K, et al. 2014. Flood risk and climate change: global and regional perspectives. Hydrol Sci J. 59(1):1–28.
- Lawrence J, Blackett P, Cradock-Henry NA. 2020. Cascading climate change impacts and implications. Clim Risk Manage. 29(100234):1–15.
- Ma W, Ishitsuka Y, Takeshima A, Hibino K, Yamazaki D, Yamamoto K, Kachi M, Oki R, Oki T, Yoshimura K. 2021. Applicability of a nationwide flood forecasting system for Typhoon Hagibis 2019. Sci Rep. 11(1):10213.
- Maharjan SB, Steiner JF, Shrestha AB, Maharjan A, Nepal S, Shrestha MS, Bajracharya B, Rasul G, Shrestha M, Jackson M, et al. 2021. The Melamchi flood disaster: cascading hazard and the need for multihazard risk management. Kathmandu, Nepal: ICIMOD.
- McAdoo BG, Quak M, Gnyawali KR, Adhikari BR, Devkota S, Rajbhandari PL, Sudmeier-Rieux K. 2018. Roads and landslides in Nepal: how development affects environmental risk. Nat Hazards Earth Syst Sci. 18(12):3203–3210.
- Moretto S, Bozzano F, Mazzanti P. 2021. The Role of Satellite InSAR for landslide forecasting: limitations and openings. Remote Sensing. 13(18):3735.
- Natural Resources Conservation Service. 2007. National engineering handbook: chapter 16 hydrographs. Washington, DC: Natural Resources Conservation Service.
- Nepal S, Flügel W-A, Shrestha AB. 2014. Upstream-downstream linkages of hydrological processes in the Himalayan region. Ecol Process. 3(1):19.
- Nepal S, Pandey A, Shrestha AB, Mukherji A. 2018. Revisiting key questions regarding upstream–downstream linkages of land and water management in the Hindu Kush Himalaya (HKH) Region. Kathmandu, Nepal: International Centre for Integrated Mountain Development.
- Norris J, Carvalho LMV, Jones C, Cannon F. 2020. Warming and drying over the central Himalaya caused by an amplification of local mountain circulation. Npj Clim Atmos Sci. 3(1):1.
- Notti D, Giordan D, Caló F, Pepe A, Zucca F, Galve J. 2018. Potential and limitations of open satellite data for flood mapping. Remote Sens. 10(11):1673.
- Painter TH, Rittger K, McKenzie C, Slaughter P, Davis RE, Dozier J. 2009. Retrieval of subpixel snow covered area, grain size, and albedo from MODIS. Remote Sens Environ. 113(4):868–879.
- Pandey VP, Acharya IP, Bhattarai P, Lamichhane S, Yadav SK, Thapa BR, Dahal BK, Talchabhadel R, Subedi SK, Adhikari T, et al. 2021. Multi-perspective field reconnaissance after the Melamchi Debris Flow of June 15, 2021 in Central Nepal. Nepal Engineers’ Association. Lalitpur, Nepal.
- Pandit MK. 2013. The Himalayas must be protected. Nature. 501(7467):283–283.
- Petley D. 2021. The cause of the Melamchi disaster in Nepal. [accessed 2022 Mar 15]. https://blogs.agu.org/landslideblog/2021/07/02/melamchi-disaster/.
- Raymond C, Horton RM, Zscheischler J, Martius O, AghaKouchak A, Balch J, Bowen SG, Camargo SJ, Hess J, Kornhuber K, et al. 2020. Understanding and managing connected extreme events. Nat Clim Chang. 10(7):611–621.
- Ross CW, Prihodko L, Anchang J, Kumar S, Ji W, Hanan NP. 2018. HYSOGs250m, global gridded hydrologic soil groups for curve-number-based runoff modeling. Sci Data. 5(1):180091.
- Rusk J, Maharjan A, Tiwari P, Chen T-HK, Shneiderman S, Turin M, Seto KC. 2022. Multi-hazard susceptibility and exposure assessment of the Hindu Kush Himalaya. Sci Total Environ. 804(150039):1–14.
- Segoni S, Rosi A, Lagomarsino D, Fanti R, Casagli N. 2018. Brief communication: using averaged soil moisture estimates to improve the performances of a regional-scale landslide early warning system. Nat Hazards Earth Syst Sci. 18(3):807–812.
- Segoni S, Rossi G, Rosi A, Catani F. 2014. Landslides triggered by rainfall: a semi-automated procedure to define consistent intensity–duration thresholds. Computers & Geosci. 63:123–131.
- Sharma S, Dahal K, Nava L, Gouli MR, Talchabhadel R, Panthi J, Roy T, Ghimire GR. 2022. Natural hazards perspectives on Integrated, Coordinated, Open, Networked (ICON) science. Earth and Space Science. 9(1):e2021EA002114.
- Sharma S, Talchabhadel R, Nepal S, Ghimire GR, Rakhal B, Panthi J, Adhikari BR, Pradhanang SM, Maskey S, Kumar S. 2022. Increasing risk of cascading hazards in the central Himalayas. Natural Hazards. https://doi.org/10.1007/s11069-022-05462-0.
- Shrestha BB, Nakagawa H. 2016. Hazard assessment of the formation and failure of the Sunkoshi landslide dam in Nepal. Nat Hazards. 82(3):2029–2049.
- Sillmann J, Thorarinsdottir T, Keenlyside N, Schaller N, Alexander LV, Hegerl G, Seneviratne SI, Vautard R, Zhang X, Zwiers FW. 2017. Understanding, modeling and predicting weather and climate extremes: challenges and opportunities. Weather Clim Extremes. 18:65–74.
- Takamatsu M, Karelia HD, Lnu TO, Dahal RK. 2022. Melamchi flood disaster in Nepal: damage and risk quantification with drone survey, satellite-based land displacement analysis, and 2D flood modeling. Washington, DC: World Bank Group. https://documents.worldbank.org/curated/en/099600006212237293/P16057809e269a0cf096ab044bc77400259.
- Talchabhadel R, Nakagawa H, Kawaike K, Yamanoi K, Musumari H, Adhikari TR, Prajapati R. 2021. Appraising the potential of using satellite‐based rainfall estimates for evaluating extreme precipitation: a case study of August 2014 event across the West Rapti River Basin, Nepal. Earth Space Sci. 8(8):e2020EA001518.
- Talchabhadel R, Panthi J, Sharma S, Ghimire GR, Baniya R, Dahal P, Baniya MKS, Jha B, Kaini S, et al. 2021. Insights on the impacts of hydroclimatic extremes and anthropogenic activities on sediment yield of a River Basin. Earth. 2(1):32–50.
- Talchabhadel R, Sanjib S, Kumar S. 2022. Understanding multiscale drivers of natural hazards, cascading failures, and risk management strategies within a multisector system. EGU General Assembly 2022. [accessed 2022 Nov 12]. https://doi.org/10.5194/egusphere-egu22-3029.
- Talchabhadel R, Shankar S, Khadka N, Hamal K, Karki S, Thapa BR. 2022. An outlook on the applicability of satellite precipitation products for monitoring extreme precipitation events in Nepal Himalaya. Weather. 77(5):174–180.
- Uddin K, Matin MA, Khanal N, Maharjan S, Bajracharya B, Tenneson K, Poortinga A, Quyen NH, Aryal RR, Saah D, et al. 2021. Regional land cover monitoring system for Hindu Kush Himalaya. In: Bajracharya B, Thapa RB, Matin MA, editors. Earth observation science and applications for risk reduction and enhanced resilience in Hindu Kush Himalaya Region. Cham: Springer International Publishing; p. 103–125.
- Uddin K, Shrestha HL, Murthy MSR, Bajracharya B, Shrestha B, Gilani H, Pradhan S, Dangol B. 2015. Development of 2010 national land cover database for the Nepal. J Environ Manage. 148:82–90.
- United Nations Development Programme. 2004. Reducing disaster risk: A challenge for development. New York: United Nations Development Programme Bureau for Crisis Prevention and Recovery. https://www.undp.org/sites/g/files/zskgke326/files/publications/Reducing%20Disaster%20risk%20a%20Challenge%20for%20development.pdf.
- US Army Corps of Engineers. 2016. Hydrologic modeling system HEC-HMS user’s manual. Davis, CA: Hydrologic Engineering Center. https://www.hec.usace.army.mil/confluence/hmsdocs/hmsum/latest.
- Vaz T, Zêzere JL, Pereira S, Oliveira SC, Garcia RAC, Quaresma I. 2018. Regional rainfall thresholds for landslide occurrence using a centenary database. Nat Hazards Earth Syst Sci. 18(4):1037–1054.
- Wang Y, Chen AS, Fu G, Djordjević S, Zhang C, Savić DA. 2018. An integrated framework for high-resolution urban flood modelling considering multiple information sources and urban features. Environ Modelling & Software. 107:85–95.
- Willner SN, Otto C, Levermann A. 2018. Global economic response to river floods. Nature Clim Change. 8(7):594–598.
- Winkler K, Fuchs R, Rounsevell M, Herold M. 2021. Global land use changes are four times greater than previously estimated. Nat Commun. 12(1):2501.
- Zekkos D, Clark MK, Roback K, Gallen SF, West AJ, Gen L, Chamlagain D, Godt JW. 2017. Map data of landslides triggered by the 25 April 2015 Mw 7.8 Gorkha. Nepal Earthquake. [accessed 2022 Jan 25]. https://www.usgs.gov/data/map-data-landslides-triggered-25-april-2015-mw-78-gorkha-nepal-earthquake
- Zhou GGD, Zhou M, Shrestha MS, Song D, Choi CE, Cui KFE, Peng M, Shi Z, Zhu X, Chen H. 2019. Experimental investigation on the longitudinal evolution of landslide dam breaching and outburst floods. Geomorphology. 334:29–43.
- Zscheischler J, Martius O, Westra S, Bevacqua E, Raymond C, Horton RM, van den Hurk B, AghaKouchak A, Jézéquel A, Mahecha MD, et al. 2020. A typology of compound weather and climate events. Nat Rev Earth Environ. 1(7):333–347.