
 ?Mathematical formulae have been encoded as MathML and are displayed in this HTML version using MathJax in order to improve their display. Uncheck the box to turn MathJax off. This feature requires Javascript. Click on a formula to zoom.
Abstract
A rapid method to assess the potential seismic risk of a building due to its height or, equivalently, to the number of stories above ground is described. It was applied, despite already existing studies in this regard, to two earthquakes, those of Casamicciola, Ischia Island, on 21 August 2017 and Santa Venerina, Catania, on 26 December 2018; although characterized by a moderate magnitude (Mw 4.0 and Mw 4.8) and short duration, they produced victims and considerable damage. Accelerometric recordings of seismic stations in the areas of the two earthquakes were acquired and the pseudoacceleration spectra and dynamic amplification factors of the ground were obtained from them. By inversion of the algebraic relation between a building’s elastic period of vibration T0 and its height H, the so-called ‘critical’ heights (and corresponding number of stories above ground) to which corresponded the ‘greatest’ dynamic amplifications were identified: buildings with a number of stories above ground equal to the ‘critical’ values were considered potentially more exposed to seismic risk. For verification of the method, ca. 200 buildings in the areas of the earthquakes were surveyed and the resulting damages were related to the number of stories above ground. The results showed that, even though the two earthquakes were of moderate magnitude and short duration, the amplifications of the ground (at Casamicciola equal to 3 for reinforced concrete buildings and 2.4 for masonry buildings; at Santa Venerina 2 and 1.7 respectively) produced appreciable accelerations in buildings with two stories above ground, which turned out to be the ones with the greatest damage. The principle underlying the method consists of rapid numerical calculations performed on the pseudoacceleration spectra of the ground. Therefore, in areas with historical seismicity where accelerometric recordings are available, it is possible to identify buildings with potential exposure to seismic risk based on the number of ‘critical’ stories above ground and to subject them to more careful controls.
1. Introduction
Seismic Risk is the engineering measure for assessment of expected damages in buildings or other structures following a probable earthquake: it is the product of the hazard [P], exposure [E] and vulnerability [V]. [P] is the acceleration, with a fixed probability, transmitted by the earthquake to the ground: OPCM 3274/2003 (OPCM, 2003) has classified the Italian territory into four seismic categories; later, the National Institute of Geophysics and Volcanology - INGV confirmed the classification, making it more exact on the basis of geographical coordinates (NTC Citation2018). All the municipalities in Italy (about 8700) are located in a seismic zone. [E] is related to the importance of a construction within its social and economic fabric. There are structures whose use or operation cannot be interrupted (hospitals, schools, universities, major roads and railway lines, airports, ports, bridges-viaducts, electrical, thermal and nuclear power plants, aqueducts, gas pipelines, dams, etc.). For these constructions, the seismic risk is estimated by means of a thorough structural analysis, although there are exceptions for road networks (Costa et al. Citation2020; El-Maissi et al. Citation2020). [V] is the predisposition of a structure to suffer damage and collapse: this predisposition is related to the size (in planimetry and height), geometry, materials, design and construction types, degradation and damage mechanisms, i.e. to its box-like behavior in the presence of a seismic stress.
Seismic risk estimation based on structural analysis requires long and complicated computational processes as well as the work of many experts. Therefore, except for structures that cannot be exposed to seismic risk, some countries have adopted simplified estimation methodologies (FEMA 2003, Citation2015a, 2015b; Rai Citation2005) based on rapid assessments and indicated in the literature by the term Rapid Visual Screening (RVS): Italy (Dolce et al. Citation2021), Albania (World Bank Gpurl D-Ras Team Citation2019), Algeria (Boutaraa et al. Citation2018), Bosnia (Ademović et al. Citation2022), Canada (Ward Citation1966; Fathi-Fazl et al. Citation2022), Japan (JBDPA 2001), Greece (EPPO Citation1984, Citation1997, Citation2000; Pomonis et al. Citation2012), Indonesia (TDMRC (Tsunami Disaster Mitigation Research Center) Citation2019), New Zealand (NZSEE 2006), India (Sarmaha and Dasab Citation2018), Thailand (Warnitchai et al. Citation2000; Palasri and Ruangrassamee Citation2010; Ornthammarath et al. Citation2011), Philippines (Vallejo Citation2010), Turkey (Ansal et al. Citation2003; Askan et al. Citation2010; Işık et al. Citation2022), to name a few.
The RVS assessment has been aimed in particular at the elements characterizing [V]: for example the damage (Bilgin et al. Citation2021; Freddi et al. Citation2021; Shkodrani et al. Citation2021; Leti and Bilgin Citation2022) or the geometry associated with the damage (Ozcebe et al. Citation2004) or location, number of stories above ground, construction period, structural class, consolidation interventions, type of roof and pre-existing damage (Zucconi et al. Citation2017) or, as in the case of Taiwan’s NCRRE (2018), ground acceleration.
Other authors have studied the vulnerability (for single buildings or groups of them) by reworking the methods centered on ‘soft computing’ techniques (Ghaboussi Citation2018; Falcone et al. Citation2020). Some of these techniques, such as artificial neural networks (Kostinakis and Morfidis Citation2020; Oh et al. Citation2020; Lazaridis et al. Citation2021; Li et al. Citation2021), fuzzy logic (Harirchian and Lahmer Citation2020; Yariyan et al. Citation2020), machine learning (Xie et al. Citation2020; Sun et al. Citation2021; Thaler et al. Citation2021) and probabilistic approaches (Vrochidou et al. Citation2021), were recently reviewed by Harirchian et al. (Citation2021), while Ji et al. (Citation2020), Zhou et al. (Citation2020) and Yu et al. (Citation2021) extended them to the post-earthquake vulnerability during aftershocks.
These examples indicate that the elements for assessment of the vulnerability of a building consist of the dimensions (Abide et al. Citation2021), in particular the height on account of its relation to the elastic period of vibration. In fact, it is known that the ground vibrates in its natural period from ca. 0.1” for hard soils or rocks up to ca. 1” for alluvial soils: hence, for heights of buildings corresponding to elastic periods of vibration close to those of the ground, the acceleration transmitted by the earthquake is appreciably amplified (Kanai Citation1957). Although this theory has been applied previously (Drimmel Citation1984; Celebi Citation2000; Balendra et al. Citation2002; Pan et al. Citation2011; Du et al. Citation2017; Gatti Citation2020), it seemed interesting to extend it to two recent earthquakes in Italy, at Casamicciola, Ischia Island, on 21 August 2017 and at Santa Venerina, Catania, on 26 December 2018; despite being of moderate magnitude (Mw 4.0 the former, Mw 4.8 the latter) and short duration (30” the former, 35” the latter), they produced victims and considerable damage to buildings.
The accelerometric recordings of two stations of the Italian national seismic network located in the respective epicentral areas of the two earthquakes were acquired and the pseudoacceleration response spectra and dynamic amplification factors (DAF) of the ground were obtained from them.
By inversion of the algebraic relation between a building’s elastic period of vibration T and its height H (vertical distance between the ground level or floor and the attic level or floor), practically equivalent to the number of stories above ground (hereafter simply ‘stories’), it was possible to obtain the so-called ‘critical’ heights or numbers of stories corresponding to the greatest dynamic amplification factors of the ground: buildings with the number of stories coinciding with the critical ones were considered potentially most exposed to seismic risk.
To verify this hypothesis, a comparison was made between the number of stories of the buildings that suffered the greatest damage during the earthquakes and the number of critical stories with the greatest dynamic amplification factor. At Casamicciola and at Santa Venerina, ca. 200 heterogeneous buildings were surveyed from both a geometric and constructive point of view and the damages produced by the earthquakes were visually associated (on the basis of a purposely defined damage scale) with the number of stories of the buildings. In addition to the damage and the number of stories, information was collected on the geometries and the structural characteristics and types of the buildings.
The results showed that, even though the two earthquakes were of moderate magnitude and short duration, the amplifications of the ground due to the earthquakes (at Casamicciola equal to 3 for reinforced concrete buildings and 2.4 for masonry buildings; at Santa Venerina 2 and 1.7 respectively) produced appreciable accelerations in buildings with two stories, which turned out to be the ones with the greatest recorded damage.
The principle underlying the method consists of rapid numerical calculations performed on the pseudoacceleration spectra of the ground. Therefore, in areas with historical seismicity where accelerometric recordings are available, it is possible to identify buildings with potential exposure to seismic risk based on the number of ‘critical’ stories above ground and to subject them to more careful controls.
2. Theoretical basis of the method
2.1. Relation between height H, elastic period of vibration T and dynamic amplification factor DAF
The first step was to establish the relation between the elastic period of vibration T and the height H (vertical distance between the level or floor of the ground and the level or floor of the attic, practically equivalent to the number of stories above ground) of the building. The formula proposed by Chopra (Citation1995) was used:
(1)
(1)
where T was expressed in seconds and H in meters. The values of the coefficients
and β, generally expressed on the basis of the building material (ATC Citation1978; Goel and Chopra Citation1997; SEAOC 1998; Hong and Hwang Citation2000; CEN Citation2004) were:
equal to 0.05 for masonry and 0.075 for reinforced concrete; β equal to 0.75.
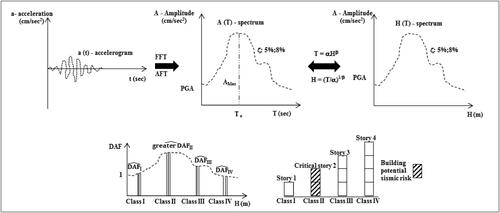
The second step was to calculate the dynamic amplification factor DAF produced by the acceleration of the ground on the buildings. By definition, the DAF is the ratio between a generic ordinate of the pseudoacceleration spectrum of the ground and its ordinate at the origin (the latter coinciding with the peak ground acceleration PGA):
(2)
(2)
The pseudoacceleration spectra of the ground were extracted from the accelerometer recordings of the seismic stations in the study areas. In the fast Fourier transforms (FFT) and anti-Fourier transforms (AFT), a value of the elastic period T ranging from 0” to 0.5” was set on the abscissa, with increments of 0.002”, and a damping ratio ζ equal to 5% for reinforced concrete and 8% for masonry. The latter choice influences the calculation of DAF, for which the indications provided in the literature by Jeary (Citation1986), ESDU (1991), Chopra (Citation1995), Fang et al. (Citation1999), Satake et al. (Citation2003), Lin et al. (Citation2005), Elnashai and Di Sarno (Citation2008) were followed; this resulted in a lower damping ratio ζ for reinforced concrete (5%) than for masonry (8%), confirmed by Gatti (Citation2018a). The same spectra were recalculated as a function of the height H obtained by inversion of [1]: in particular, the interval of T from 0” to 0.5” has corresponding H values between 0 and 12.5 m (the latter value being the maximum height of Italian buildings, especially masonry ones) (ISTAT Citation2018).
The buildings were divided into four classes: I, II, III and IV: each class was distinguished by a number of stories above ground of 1, 2, 3 and 4 respectively and by a triad of distinct heights for discrete values typical of buildings constructed in Italy: 2.70, 2.85 and 3.00 m for Class I; 5.50, 5.75 and 6.00 m for Class II; 8.50, 8.75 and 9.00 m for Class III and 11.50, 11.75 and 12.00 m for Class IV.
For each class, three dynamic amplification coefficients DAFi(Hi) were calculated with i = 1, 2 and 3, with the numerator of (2) being the spectral ordinates corresponding to the value of the elastic period T, from which, by inverting (1), were obtained the respective three heights Hi and, from them, the mean value of each Class J = I, II, III and IV:
(3)
(3)
The number of so-called ‘critical’ stories Pc was then defined by extracting them from the class with the greatest values. The value of Pc represents the number of stories corresponding to the highest value of amplification of the ground acceleration due to the earthquake. In the assumption of this method, buildings with a number of stories equal to Pc are potentially those most exposed to seismic risk. shows a simplified scheme of the numerical steps.
Figure 1. Simplified scheme of the numerical steps.
2.2. Relation between the recorded damage and the structural height or number of stories above ground
Before verifying the method, it was necessary to define a scale of the damage produced by the earthquake in the studied buildings. The damage was quantified on a numerical scale between 0 and 10: zero corresponds to the absence of damage and ten to the greatest damage. The intermediate values correspond to low, medium and high damage. Each value was associated with a description of the visible damages. The scale and corresponding descriptions are reported in .
Table 1. Numerical damage scale.
shows some images of damage corresponding to the descriptions given in .
Figure 2. (a) Low damage. (b) Medium damage. (c) High damage. (d) Very high damage.
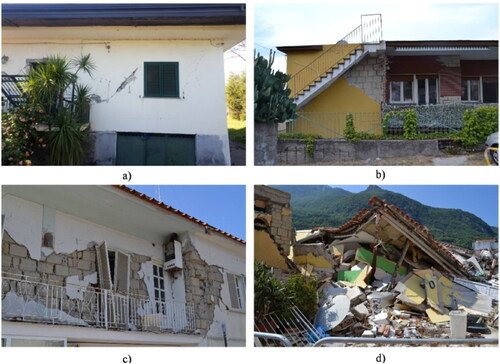
During the survey after the earthquake to verify the method, the investigator recorded on a form the number of stories above ground of the building and placed a cross marking the damage most similar to that described in . Within the limits of this visual survey, not characterized by linear measurements and mainly carried out from outside the buildings due to their instability, the investigator noted other information on the form, with the aid of a supporting dictionary: planimetric shape (square or rectangular, more or less regular), roof geometry (flat, single-pitched, dual-pitched, hipped, shed, other), thickness of walls, distribution of the loads (permanent and incidental), height regularity, construction materials of walls (full masonry, hollow masonry, unhewn stone, concrete, reinforced concrete, masonry and reinforced concrete, steel, other) and of horizontal load-bearing structures (wood, hollow-core concrete, steel and brick, other), presence of stairwells or elevator shafts, structural type (full masonry, frame in reinforced concrete and infill walls, other), building use (residential, industrial-agricultural-artisanal, public, religious, other), presumed year of construction, presence of post-construction structural works (expansions, additions of stories, replacement of horizontal load-bearing structures, other), building context (isolated or attached/adjacent buildings), damage mechanisms of walls (shear, buckling, crushing, simple or composite wall overturning) and of horizontal load-bearing structures (thrusting roofs, ridge beam hammering, other); interactions with adjacent buildings.
This information was used when assigning the numerical value of the damage to the building: the operation was performed a posteriori, dividing the buildings by survey areas and for each building associating the definitive numerical damage value with the corresponding number of stories.
3. Study cases
3.1. Casamicciola, Ischia Island. Earthquake of 2017
The earthquake occurred on 21 August 2017 18:57:51 UTC with the epicenter near Casamicciola at a depth of 1.73 km, Mw 4.0, duration ca. 30”. It was classified as a superficial-middle event (De Novellis et al. Citation2018; Devoti et al. Citation2018; Nappi et al. Citation2018) but with damage recorded on the EMS98 macroseismic scale (Grünthal Citation1998) that reached values of 8 at Casamicciola Terme Zona Rossa, 7 at Bagni di Casamicciola Terme and Fango di Lacco Ameno, 6 at Marina di Casamicciola Terme. For this study, four localities were identified: Casamicciola, Bagni, Fango and Lacco Ameno, which are about 1 km from the epicenter. There is only one seismic recording station on the island, IOCA, ca. 0.65 km from the epicenter ().
Figure 3. Epicenter of the earthquake of 21 August 2017. Localities and seismic station.
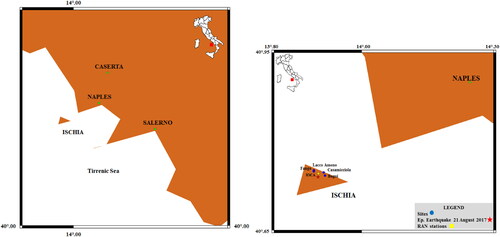
In summer 2018, 100 buildings were surveyed: 51 at Casamicciola, 10 at Bagni, 22 at Fango and 17 at Lacco Ameno. The average date of construction was prior to the middle of the twentieth century, although many buildings had undergone interventions of expansion or additional stories. Almost all the buildings were for residential use (only 3% were places of worship), with 63% isolated and 37% attached/adjacent. The planimetric geometry was mainly irregular (57% trapezoid with oblique sides), present not only in attached/adjacent buildings but also in isolated ones, and the height geometry was irregular for 55% of the buildings: this means that the structures were geometrically eccentric in terms of mass/stiffness centers. Two-story buildings made up 48% of the total versus 28% with one story and 24% with three stories (there were no buildings with more than three stories in the surveyed localities) and the prevalent roof geometry was flat (76%), typical of Mediterranean constructions, with 11% dual-pitched and 13% four-pitched.
The prevailing construction material was tuff, and thus the walls were mainly of this material alternating with concrete blocks or hollow bricks, almost totally bedded by hydraulic mortar (pozzolan); walls made only of concrete or brick blocks were rare. Dry masonry walls were absent, while the extensions were made with materials different from the original ones. The floor assemblies were almost equally in hollow-core concrete (51%) or steel and brick (45%), while those in wood were almost absent. The roof joists were almost in the same percentages with a slight increase of those in wood and brick (+6%). The walls were one- and two-headers thick. The most frequent damage mechanisms were on the walls: 21% traction shear, 19% thrust shear, 23% buckling, 17% crushing and a high percentage of composite overturning; although the percentages of dual- and four-pitched roofs were small, damage mechanisms related to ridge beam hammering and thrusting of the roof were recorded. There were five buildings with total collapses and six with partial ones.
3.2. Santa Venerina, Catania. Earthquake of 2018
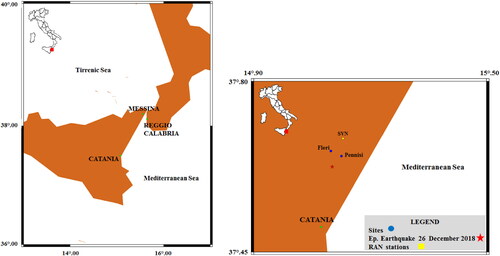
The case refers to the earthquake of 26 December 2018 02:19:14 UTC whose epicenter was near Viagrande (Catania), on the southeastern slope of Etna, at a depth of ca. 1.2 km, Mw 4.8, duration 35”. Like the preceding event, this was a superficial volcanic-tectonic event (Tusa and Langer Citation2016) typical of the zone in which tectonic movements and eruptions of Etna are periodically combined, with the characteristic of causing substantial damage (in relation to the magnitude) within a very limited range. Many earthquakes have been recorded in this area and all with the same characteristics (1875, 1914, 1919, 1931, 1984 and lastly 2002). The MCS macroseismic scale surveys (Sieberg Citation1930) revealed damage to buildings up to degree VI, particularly at Fleri (a portion of Zafferana Etnea), Santa Venerina and Aci Catena (Patanè et al. Citation2022).
For this study, two localities were identified: Fleri and Pennisi (a portion of Acireale), which are about 5 km from the epicenter. There are several RAN seismic stations in the area: Santa Venerina (SVN), the closest to the two localities and the epicenter, was chosen ().
Figure 4. Epicenter of the earthquake of 26 December 2018. Localities and seismic station.
In winter 2019, 102 buildings were surveyed: 84 at Fleri (a portion of Zafferana Etnea) and 18 at Pennisi (a portion of Acireale). The dates of construction were after the middle of the twentieth century and almost all the buildings had undergone structural interventions, since earthquakes had been frequent in the area (at least one every 15 years). All the buildings were for residential use, with 38% isolated and 62% attached/adjacent. Regular planimetric geometry was prevalent (only 11% irregular trapezoids), present not only in attached/adjacent buildings but also in isolated ones, while the percentage of buildings with irregular height geometry increased to 30%, so that only 54% of the total presented both planimetric and height regularity: this means that the structures were eccentric in terms of mass/stiffness centers. Two-story buildings made up 47% of the total versus 22% with one story and 25% with three stories. The prevalent roof geometry was dual-pitched (60%) and hipped (27%).
The structural type was reinforced concrete frame with light brick infill walls (97% of those surveyed) with one or two headers. The floor assemblies were mainly in hollow-core concrete; those in wood were absent. The roof joists were in almost the same percentages, with a slight increase of those in wood and brick (+10%). The most frequent damage mechanisms were separations of infill walls and stairwells (80%) while, due to the high percentages of dual- and four-pitched roofs, there were instances of ridge beam hammering and thrusting of the roofs. Only a single total collapse (of a religious building) was recorded.
3.3. Computing DAF(H). Critical height Hc (or critical story Pc)
The two seismic stations located closest to the epicenters, IOCA Isola di Ischia and SVN Santa Venerina, are equipped with triaxial accelerometers that continuously record ground accelerations with a rate of 200 Hz. Only the ground acceleration measurements recorded at the time and day of the two largest earthquakes, along the North/South and East/West directions, were acquired from them. To obtain the pseudoacceleration spectra of the ground along these directions, the acceleration measurements were filtered with the Butterworth bandpass algorithm of order 3 or 6 and variable range from 0.1 to 50 Hz (Stearns and David Citation1996; Lynn and Fuerst Citation1998; Boore and Akkar Citation2003), while the FFT and AFT were calculated with the interval and increments of T and damping ratios ζ reported in Section 2.1. The amplitudes of the two pseudoacceleration spectra were averaged and the dynamic amplification factors were obtained from the mean spectrum as a function of the period T and the height H. In this regard, a code in Matlab environment was developed. As an example, the trends of the dynamic amplification factors of the ground as a function of the height H are represented in with ζ = 8% (masonry buildings) obtained from the mean spectrum of the IOCA accelerometric recordings and in with ζ = 5% (reinforced concrete buildings) from the mean spectrum of the SVN – Santa Venerina recordings.
Figure 5. DAF(H) for ζ = 8% (masonry buildings). Casamicciola. Earthquake of 21 August 2017 18:57:51 UTC Mw 4.0. IOCA station.
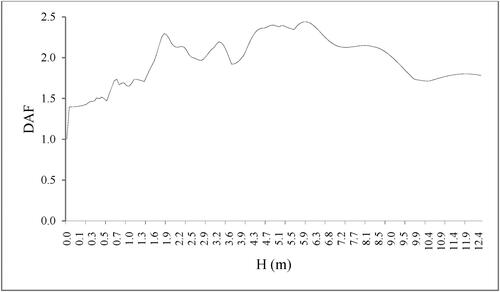
Figure 6. DAF(H) for ζ = 5% (reinforced concrete buildings). Santa Venerina. Earthquake of 26 December 2018 02:19:14 UTC Mw 4.8. SVN station.
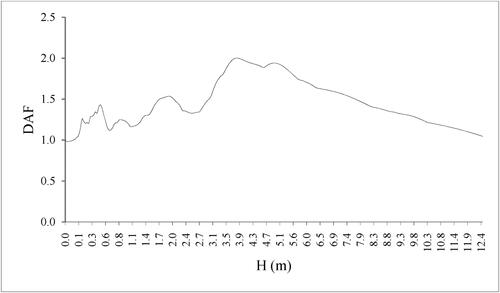
The numerical values reported in and were obtained from the same calculations and, for each of the study areas, refer to:
Table 2. Casamicciola. Earthquake of 21 August 2017 18:57:51 UTC Mw 4.0. IOCA station. Maximum DAFm for ζ = 5% (reinforced concrete buildings) and ζ = 8% (masonry buildings).
Table 3. Santa Venerina. Earthquake of 26 December 2018 02:19:14 UTC Mw 4.8. SVN station. Maximum DAFm for ζ = 5% (reinforced concrete buildings) and ζ = 8% (masonry buildings).
distance de (Km) of the seismic station from the epicenter;
mean significant duration td (sec) of the earthquake (Bolt Citation1973; Trifumac and Brady Citation1975; Du and Wang Citation2017);
peak ground acceleration PGA (g);
elastic period of vibration To (sec) of the ground corresponding to the maximum ordinate of the mean spectrum;
‘maximum’ dynamic amplification factor (obtained by placing the maximum ordinate of the mean spectrum in the numerator of (2).
From and , it can be seen that at Casamicciola the PGA (0.214 g) is less than half that recorded at Santa Venerina (0.519 g) while the maximum amplification factor was higher, i.e. respectively 3 versus 2 for reinforced concrete buildings and 2.4 versus 1.7 for masonry ones. Independently of the damping ratios, this means that, even though the maximum amplification factors at Casamicciola were higher than at Santa Venerina, the acceleration transmitted to the buildings of Santa Venerina due to the ground amplification was much greater: 2 and 1.7 (multiplied by 0.514 g) versus 3 and 2.4 (multiplied by 0.214 g).
The dynamic amplification factors for each of the four classes and the corresponding mean values were obtained from the same mean spectra. and report the highest values together with the class of the building, the triad of heights and the corresponding critical story Pc; it should be noted that the values refer to masonry buildings for Casamicciola (as they represent the main type) and to reinforced concrete ones for Santa Venerina (almost 100% of those surveyed).
Table 4. Casamicciola. Earthquake of 21 August 2017 18.57.51 UTC Mw 4.0. critical height Hc, critical story Pc. α = 0.05; β = 0.75; ζ = 8% (masonry buildings).
Table 5. Santa Venerina. Earthquake of 26 December 2018 02:19:14 UTC Mw 4.8. critical height Hc, critical story Pc. α = 0.075; β = 0.75; ζ = 5% (reinforced concrete buildings).
From and , it can be deduced that the buildings that underwent the greatest amplification due to ground accelerations during the earthquakes were those of Class II: hence, those potentially most exposed to seismic risk had heights of 5.5, 5.75 and 6.0 m, i.e. a number of stories equal to 2.
3.4. Mean damage and mean number of stories
The buildings surveyed in each case study were grouped by locality (Casamicciola, Bagni, Fango and Lacco Ameno) Ischia Island; (Fleri and Pennisi) Catania; of these, only those with an assigned damage greater than 5 were considered (together with their number of stories), with estimation of their mean damage Dm and mean number of stories Pm. and report the name of the locality, its distance from the epicenter, the percentage of surveyed buildings with damage greater than 5, the mean damage Dm and the mean number of stories Pm, in masonry at Casamicciola and in reinforced concrete at Santa Venerina.
Table 6. Casamicciola. Earthquake of 21 August 2017 18.57.51 UTC Mw 4.0. Locality, percentage of buildings with damage greater than 5, mean damage Dm and mean story Pm.
Table 7. Santa Venerina. Earthquake of 26 December 2018 02:19:14 UTC Mw 4.8. Locality, percentage of buildings with damage greater than 5, mean damage Dm and mean story Pm.
3.5. Comparisons and verifications
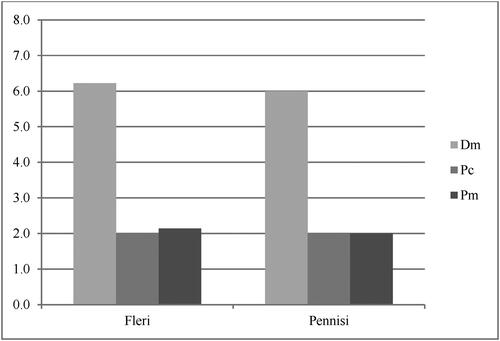
The verification was carried out for each locality by comparing the ‘critical’ story Pc deduced from the mean spectra ( and ) with the mean story Pm ( and ) extracted in correspondence of the mean damage greater than 5. The comparisons are summarized in and .
Figure 7. Casamicciola. Earthquake of 21 August 2017 18.57.51 UTC Mw 4.0. Masonry buildings: locality, mean damage Dm > 5, Pc and Pm.
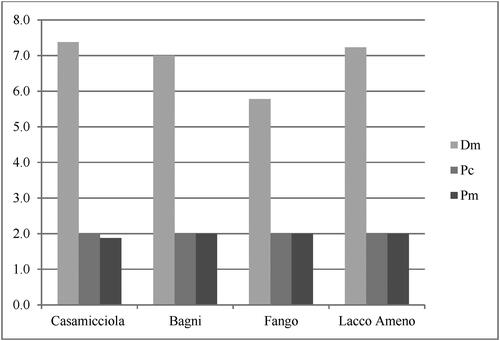
shows that the mean damage on Ischia Island was ‘high’, with values close to or above 6 and not always explainable by the distance from the epicenter; for example, at Lacco Ameno 76% of the buildings suffered mean damage above 7, even though the locality was the most distant one from the epicenter. Vice versa at Santa Venerina the mean damage was just over 6 with close to 30% of the buildings suffering damage.
From the comparison reported in and between the critical stories Pc and those with the highest mean damage Pm, there is an almost identical convergence on the second story both for the four localities of Ischia and the two of Santa Venerina independently of the structural material (tuff masonry in the former case, reinforced concrete and masonry infill in the latter).
Figure 8. Santa Venerina. Earthquake of 26 December 2018 02:19:14 UTC Mw 4.8. Reinforced concrete buildings: locality, mean damage Dm > 5, Pc and Pm.
4. Conclusions
The proposed method is simple and can be automated. It consists of elementary numerical calculations and requires limited resources (acquisition of accelerometric recordings) in the seismic areas. It can be used to rapidly identify buildings potentially most exposed to seismic risk, to increase their visualization on maps (or Geographic Information System tools), to make more accurate vulnerability checks, and to plan large-scale protection of the structural patrimony. More thought should be given to the values of the coefficients and β of EquationEquation (1)
(1)
(1) , in the light of recent studies (Gatti Citation2018b), and the subdivision of buildings into classes which, although initially useful for application of the method, could be expanded to other heights.
In the two case studies, it emerged that the earthquakes were characterized by dynamic amplification values transmitting accelerations to two-story buildings that were up to three times those recorded in the ground, thus explaining the recorded levels of damage.
At Casamicciola the coincidence between the mean number of stories with the greatest damage and the number of critical stories should be verified by separating construction type and materials from the resonance in height, even though a convergence independent of the structural material has already been confirmed in similar construction contexts by sophisticated analytical studies (Hysenlliu and Bilgin Citation2021). At Santa Venerina, where such coincidence is more realistic, the effect of the site on the PGA should be investigated (Du and Pan Citation2016).
Acknowledgments
Thanks are due to the Department of Civil Protection and the National Institute of Geophysics and Volcanology – Vesuvius Observatory for the accelerometric data from the seismic stations of Santa Venerina and IOCA. Special thanks go to Drs. Alessandra Salato and Fangyuan Zheng for their contribution to the rapid survey of the buildings.
Data availability statement
The data processed by the author in this paper are available upon request from him. The data from the seismic stations of Santa Venerina and IOCA can be requested from the Italian Department of Civil Protection and the National Institute of Geophysics and Volcanology – Vesuvius Observatory.
References
- Abide A, Vasconcelos G, Lourenco PB. 2021. Overview on the nonlinear static procedures and performance-based approach on modern unreinforced masonry buildings with structural irregularity. Buildings. 11(4):147.
- Ademović N, Hadzima-Nyarko M, Zagora N, Piljug A, Medanović Ć. 2022. Vulnerability of residential buildings in Sarajevo, Advanced technologies. Proceedings of the International Symposium on Innovative and Interdisciplinary Applications of Advanced Technologies (IAT). Systems and Applications VII. Lecture Notes in Networks and Systems. Springer; 3–14.
- Ansal A, Özaydın K, Edinçliler A, Sağlamer A, Sucuoğlu H, Özdemir P. 2003. Earthquake master plan for Istanbul. Metropolitan Munіcіpalіty of Istanbul Plannіng and Construction Dіrectorіat. Geotechnical and Earthquake Investіgatіon Department, Istanbul, Turkey; 1, p. 1–568.
- Askan A, Yucemen M, Semih A. 2010. Probabilistic methods for the estimation of potential seismic damage: application to reinforced concrete buildings in Turkey. Struct Saf. 32(4):262–271.
- ATC Applied Technological Council. 1978. Tentative provisions for the development of seismic regulations for buildings. ATC3-06, Palo Alto, California: Applied Technological Council.
- Balendra T, Lam NTK, Wilson JL, Kong KH. 2002. Analysis of long-distance earthquake tremors and base shear demand for buildings in Singapore. Eng Struct. 24(1):99–108.
- Bilgin H, Shkodrani N, Hysenlliu M, Ozmen HB, Işık E, Harirchian E. 2021. Damage and performance evaluation of masonry buildings constructed in 1970s during the 2019 Albania earthquakes. Eng Fail Anal. 31(15):105824.
- Bolt BA. 1973. Duration of strong ground motion. In Proceedings of the 5th World Conference on Earthquake Engineering, Rome, Italy, 25–29 June 1973. 292:25–29.
- Boore DM, Akkar S. 2003. Effects of causal and acausal filters on elastic and inelastic response spectra. Earthquake Engng Struct Dyn. 32(11):1729–1748.
- Boutaraa Z, Caterina N, Ahmed A, Olivier S. 2018. Buildings vulnerability assessment and damage seismic scenarios at urban scale: application to Chlef City (Algeria). J Civ Eng. 22:1–13.
- Celebi M. 2000. Revelations from a single strong-motion record retrieved during the 27 June 1998 Adana (Turkey) earthquake. Soil Dyn Earthq Eng. 20(5-8):283–288.
- CEN. 2004. European Prestandard ENV 1998-1-4: eurocode 8 – Design of structures for earthquake resistance, Part 1-4: strengthening and repair of buildings. Brussels: Comité Européen de Normalisation.
- Chopra AK. 1995. Dynamics of structures: theory and applications to earthquake engineering. Upper Saddle River, NJ: Prentice-Hall, Inc.
- Costa C, Figueiredo R, Silva V, Bazzurro P. 2020. Application of open tools and datasets to probabilistic modeling of road traffic disruptions due to earthquake damage. Earthquake Engng Struct Dyn. 49(12):1236–1255.
- De Novellis V, Carlino S, Castaldo R, Tramelli A, De Luca C, Pino NA, Pepe S, Convertito V, Zinno I, De Martino P, et al., 2018. The 21 August 2017 Ischia (Italy) earthquake source model inferred from seismological, GPS, and DInSAR measurements. Geophys Res Lett. 45(5):2193–2202.
- Devoti R, De Martino P, Pietrantorio G, Dolce M. 2018. Coseismic displacements on Ischia island, real-time GPS positioning constraints on earthquake source location. Ann Geophys. 61(3):1–13.
- Dolce M, Prota A, Borzi B, Da Porto F, Lagomarsino S, Magenes G, Moroni C, Penna A, Polese M, Speranza E, et al. 2021. Seismic risk assessment of residential buildings in Italy. Bull Earthquake Eng. 19(8):2999–3032.
- Drimmel J. 1984. A theoretical basis for macroseismic scales and some implications for practical work. Eng Geol. 20(1-2):99–104.
- Du W, Pan TC. 2016. Site response analyses using downhole arrays at various seismic hazard levels of Singapore. Soil Dyn Earthq Eng. 90:169–182.
- Du W, Wang G. 2017. Prediction equations for ground motion significant durations using the NGA-West2 database. Bull Seismol Soc Am. 107(1):319–333.
- Du W, Goh KS, Pan TC. 2017. Methodology for estimating human perception to tremors in high-rise buildings. J Seismol. 21(4):667–682.
- El-Maissi AM, Argyroudis SA, Nazri FM. 2020. Seismic vulnerability assessment methodologies for roadway assets and networks: a state-of-the-art review. Sustainability. 13(1):61.
- Elnashai AS, Di Sarno L. 2008. Fundamentals of earthquake engineering. Chichester UK: John Wiley & Sons.
- EPPO. 1984. Post-earthquake damage inspection of buildings: guidelines and forms for post-earthquake damage surveys. Athens, Greece: Earthquake Prot. Plann. Organiz.
- EPPO. 1997. Instructions and forms for post-earthquake usability assessment of buildings. Athens, Greece: Earthquake Prot. Plann. Organiz.
- EPPO. 2000. Provisions for pre-earthquake vulnerability assessment of public buildings. Athens, Greece: Earthquake Prot. Plann. Organiz.
- ESDU - Engineering Sciences Data Unit. 1991. Structural parameters used in response calculations (estimation of numerical values). London UK: ESDU International Item N. 91001.
- Falcone R, Lima C, Martinelli E. 2020. Soft computing techniques in structural and earthquake engineering: a literature review. Eng Struct. 207:110269.
- Fang JQ, Li QS, Jeary AP, Liu DK. 1999. Damping of tall buildings: its evaluation and probabilistic characteristics. Struct Design Tall Build. 8(2):145–153.
- Fathi-Fazl R, Fazileh F, Cai Z, Cortés-Puentes WL. 2022. Development of quick seismic evaluation procedure for existing buildings in Canada. Can J Civ Eng. 0(Just-IN):12–17.
- FEMA Federal Emergency Management Agency. 2003. Multi-hazard loss estimation methodology—earthquake module: HAZUS-MH MR1 advanced engineering building module technical and user’s manual. 3rd ed. Washington, DC, USA: Federal Emergency Management Agency.
- FEMA Federal Emergency Management Agency. 2015a. Rapid visual screening of buildings for potential seismic hazards: a handbook FEMA P-154, 3rd ed. Washington, DC, USA. Applied Technology Council (ATC), Federal Emergency Management Agency.
- FEMA Federal Emergency Management Agency. 2015b. Rapid visual screening of buildings for potential seismic hazards: supporting documentation FEMA P-155. 3rd ed. Washington, DC, USA: Applied Technology Council (ATC), Federal Emergency Management Agency.
- Freddi F, Novelli V, Gentile R, Stoyan E, Veliu A, Andreev A, Greco F, Zhuleku E. 2021. Observations from the 26th November 2019 Albania earthquake: the earthquake engineering field investigation team (EEFIT) mission. Bull Earthq Eng. 19(5):1–32.
- Gatti M. 2018a. Experimental calculation of the damping ratio in buildings hosting permanent GPS stations during the recent Italian earthquakes. Adv Civil Eng Tech. 1(3):1–20.
- Gatti M. 2018b. Elastic period of vibration calculated experimentally in buildings hosting permanent GPS stations. Earthq Eng Eng Vib. 17(3):607–625.
- Gatti M. 2020. Relation between dynamic amplification, structural height and damage in buildings affected by the recent Italian earthquakes. Geomat Nat Haz Risk. 11(1):1154–1174.
- Ghaboussi J. 2018. Soft computing in engineering. 1st ed. Boca Raton, FL: CRC Press Taylor & Francis; p. 1–220.
- Goel RK, Chopra AK. 1997. Period formulas for moment-resisting frame buildings. J Struct Eng. 123(11):1454–1461.
- Grünthal G. 1998. European Macroseismic Scale 1998 (EMS-98). European seismological commission, subcommission on engineering seismology, working group macroseismic scales. Cahiers Du Centre Européen De Géodynamique Et De Séismologie. 15th ed. p. 1–99
- Harirchian E, Lahmer T. 2020. Improved rapid visual earthquake hazard safety evaluation of existing buildings using a type-2 fuzzy logic model. Appl Sci. 10(7):2375.
- Harirchian E, Hosseini Aghakouchaki SE, Jadhav K, Kumari V, Rasulzade S, Işık E, Wasif M, Lahmer T. 2021. A review on application of soft computing techniques for the rapid visual safety evaluation and damage classification of existing buildings. J Build Eng. 43(05):102536.
- Hong L, Hwang W. 2000. Empirical formula for fundamental vibration periods of reinforced concrete buildings in Taiwan. Earthquake Engng Struct Dyn. 29(3):327–337.
- Hysenlliu M, Bilgin H. 2021. The use of macro element approach for the seismic risk assessment of brick masonry buildings. Critical thinking in the sustainable rehabilitation and risk management of the built environment. Springer; p. 362–373.
- Işık E, Emre Ulu A, Büyüksaraç A, Cihan Mehmet A. 2022. A study on damages in masonry structures and determination of damage levels in the 2020 Sivrice (Elazig) earthquake. Proceedings of the International Symposium on Innovative and Interdisciplinary Applications of Advanced Technologies (IAT). Systems and Applications VII. Lecture Notes in Networks and Systems, 26–35. Springer.
- ISTAT 2018. Permanent census of population and housing, https://www.istat.it/it/censimenti-permanenti.
- JBDPA Japan Building Disaster Prevention Association. 2001. Seismic evaluation and retrofit. Tokyo, Japan: JBDPA.
- Jeary AP. 1986. Damping in tall buildings. A mechanism and a predictor. Earthquake Engng Struct Dyn. 14(5):733–750.
- Ji D, Wen W, Zhai C, Katsanos EI. 2020. Maximum inelastic displacement of mainshock-damaged structures under succeeding aftershock. Soil Dyn Earthq Eng. 136:106248.
- Kanai K. 1957. Semi-empirical formula for the seismic characteristics of the ground. Bull Earthq Res Inst. 35(2):309–325.
- Kostinakis K, Morfidis K. 2020. Application of artificial neural networks for the assessment of the seismic damage of buildings with irregular infills’ distribution. In Seismic behaviour and design of irregular and complex civil structures III. Berlin/Heidelberg, Germany: Springer; p. 291–306.
- Lazaridis PC, Kavvadias IE, Demertzis K, Iliadis L, Papaleonidas A, Vasiliadis LK, Elenas A. 2021. Structural damage prediction under seismic sequence using neural networks. Proceedings of the 8th ECCOMAS Thematic Conference on Computational Methods in Structural Dynamics and Earthquake Engineering, Athens, Greece, 28–30 June 2021.
- Leti M, Bilgin H. 2022. Predicting the seismic performance of typical r/c residential buildings. Proceedings of the International Symposium on Innovative and Interdisciplinary Applications of Advanced Technologies (IAT). Systems and Applications VII. Lecture Notes in Networks and Systems:15–24. Springer.
- Li J, He Z, Zhao X. 2021. A data-driven building’s seismic response estimation method using a deep convolutional neural network. IEEE Access. 9:50061–50077.
- Lin YY, Miranda E, Chang KC. 2005. Evaluation of damping reduction factors for estimating elastic response of structures with high damping. Earthquake Engng Struct Dyn. 34(11):1427–1443.
- Lynn PA, Fuerst W. 1998. Introductory digital signal processing with computer applications. Hoboken, NJ: Wiley & Sons. p. 1–496.
- Nappi R, Alessio G, Gaudiosi G, Nave R, Marotta E, Siniscalchi V, Civico R, Pizzimenti L, Peluso R, Belviso P, et al. 2018. The 21 August 2017 Md 4.0 Casamicciola earthquake: first evidence of coseismic normal surface faulting at the Ischia volcanic island. Seismol Res Lett. 89(4):1323–1334.
- NCRRE National Center for Research on Earthquake Engineering di Taiwan. 2018. VV.AA NCRRE Research AA.VV. NAR Labs Taipei. 200, p. 1–144.
- NTC. 2018. Technical regulations for buildings, Official document of the Italian Government n° 42. 20 February 2018 (in Italian).
- NZSEE New Zealand Society for Earthquake Engineering. 2006. Assessment and improvement of the structural performance of buildings in earthquake. Recommendations of a Nzsee Study Group on Earthquake Risk Buildings. 3:1–388.
- Oh BK, Park Y, Park HS. 2020. Seismic response prediction method for building structures using convolutional neural network. Struct Control Health Monit. 27(5):e2519.
- OPCM 3274. 2003. Primi elementi in materia di criteri generali per la classificazione sismica del territorio nazionale e di normative tecniche per le costruzioni in zona sismica. Official document of the Italian Government n° 105 8 May 2003 (in Italian).
- Ornthammarath T, Warnitchai P, Worakanchana K, Zaman S, Sigbjörnsson R, Lai CG. 2011. Probabilistic seismic hazard assessment for Thailand. Bull Earthquake Eng. 9(2):367–394.
- Ozcebe G, Yucemen MS, Aydogan V. 2004. Statistical seismic vulnerability assessment of existing reinforced concrete buildings in Turkey on a regional scale. J Earthq Eng. 8(5):749–773.
- Palasri C, Ruangrassamee A. 2010. Probabilistic seismic hazard maps of Thailand. J Earthquake and Tsunami. 04(04):369–386.
- Pan TC, Megawati K, Goh KS. 2011. Response of high-rise buildings in Singapore due to a potential giant earthquake in the Sumatran megathrust. J Earthq Eng. 15(sup1):90–106.
- Patanè D, Tusa G, Yang W, Astuti A, Colino A, Costanza A, D’Anna G, Di Prima S, Fertitta G, Mangiagli S, et al. 2022. The urban seismic observatory of Catania (Italy): a real-time seismic monitoring at urban scale. Remote Sens. 14(11):2583.
- Pomonis A, Gaspari M, Karababa F. 2012. Seismic vulnerability assessment for buildings in Greece based on observed damage data sets. Boll Geofis Teor Appl. 54(X):1–34.
- Rai DC. 2005. Review of documents on seismic evaluation of existing buildings. Kampur, India: Department of Civil Engineering, Indian Institute of Technology Kanpur. IITK-GSDMA-EQ03-V1.0; p. 1–32.
- Sarmaha T, Dasab S. 2018. Earthquake vulnerability assessment for rcc buildings of Guwahati City using rapid visual screening. Procedia Eng. 212:214–221.
- Satake N, Suda K, Arakawa T, Sasaki A, Tamura Y. 2003. Damping evaluation using full scale data of buildings in Japan. J Struct Eng. 129(4):470–477.
- SEAOC. 1996. Recommended lateral force requirements and commentary. San Francisco, California: Seismological Engineers Association of California.
- Shkodrani N, Bilgin H, Hysenlliu M, Department of Civil Engineering, Polytechnic University of Tirana 2021. Influence of interventions on the seismic performance of URM buildings designed according to pre-modern codes. Res Eng Struct Mater. 7(2):315–330.
- Sieberg A. 1930. Geologie der Erdbeben. Handboch der Geophys. 2(4):552–554. [Tabb. 100, 101, 102, 103]. Berlin.
- Stearns S, David R. 1996. Signal processing algorithms. Hoboken, NJ: Prentice-Hall; 1, p. 1–297.
- Sun H, Burton HV, Huang H. 2021. Machine learning applications for building structural design and performance assessment: state-of-the-art review. J Build Eng. 33:101816.
- TDMRC (Tsunami Disaster Mitigation Research Center). 2019. Report on disaster risk maps for Aceh (tsunami, earthquake, landslides, and floods). Banda Aceh, Indonesia: TDMRC.
- Thaler D, Stoffel M, Markert B, Bamer F. 2021. Machine-learning-enhanced tail end prediction of structural response statistics in earthquake engineering. Earthquake Engng Struct Dyn. 50(8):2098–2114.
- Trifumac MD, Brady AG. 1975. A study on the duration of strong earthquake ground motion. Bull Seism Soc Am. 65(3):581–626.
- Tusa G, Langer H. 2016. Prediction of ground motion parameters for the volcanic area of Mount Etna. J Seismol. 20(1):1–42.
- Vallejo CB. 2010. Rapid visual screening of buildings in the city of Manila, Philippines. Proceedings of 5th Civil Engineering Conference in the Asian Region and Australasian. Sydney ; p. 510–518
- Vrochidou E, Bizergianidou V, Andreadis I, Elenas A. 2021. Assessment and localization of structural damage in r/c structures through intelligent seismic signal processing. Appl Artif Intell. 35(9):670–695.
- Ward HS. 1966. Earthquake load provisions of the national building code of Canada. Ottawa, Ontario: National Research Council of Canada, Division of Building Research; p. 1–26.
- Warnitchai P, Sangarayakul C, Ashford SA. 2000. Seismic hazard in Bangkok due to distant earthquakes. Proceeding of the 2nd Multi-lateral Workshop on Development of Earthquake and Tsunami Disaster Mitigation Technologies and their Integration for the Asia-Pacific Region. Kobe, Japan: Earthquake Disaster Mitigation Research Center (EDM).
- World Bank Gpurl D-Ras Team. 2019. M 6.4 Albania earthquake global rapid post disaster damage estimation (grade) report. Washington, DC: International Bank for Reconstruction and Development/The World Bank; p. 1–31.
- Zucconi M, Sorrentino L, Ferlito R. 2017. Principal component analysis for a seismic usability model of unreinforced masonry buildings. Soil Dynam Earthq Eng. 96:64–75.
- Zhou Z, Yu X, Lu D. 2020. Identifying optimal intensity measures for predicting damage potential of mainshock–aftershock sequences. Appl Sci. 10(19):6795.
- Xie Y, Ebad Sichani M, Padgett JE, DesRoches R. 2020. The promise of implementing machine learning in earthquake engineering: a state-of-the-art review. Earthq Spectra. 36:769–1801.
- Yariyan P, Zabihi H, Wolf ID, Karami M, Amiriyan S. 2020. Earthquake risk assessment using an integrated fuzzy analytic hierarchy process with artificial neural networks based on GIS: a case study of Sanandaj in Iran. Int J Disaster Risk Reduct. 50:101705.
- Yu X, Zhou Z, Du W, Lu D. 2021. Development of fragility surfaces for reinforced concrete buildings under mainshock‐aftershock sequences. Earthq Engng Struct Dyn. 50(15):3981–4000.