
 ?Mathematical formulae have been encoded as MathML and are displayed in this HTML version using MathJax in order to improve their display. Uncheck the box to turn MathJax off. This feature requires Javascript. Click on a formula to zoom.
Abstract
The occurrence of forest fires is determined by fuel, climate and ignition sources at different temporal and spatial scales. However, most analyses are performed only on a single scale, and few comprehensive statistical analyses elaborate on the cross-scale interaction of fire drivers. Understanding the differential effects of socioeconomic and climatic factors on forest fire incidence across different administrative and climatic scales can provide new information for wildfire studies. In this study, we applied a cross-classified multilevel model with forest fire incidence data derived from Moderate Resolution Imaging Spectroradiometer products (MODIS 14A1) to explore the relationship between the spatial distribution of fire incidence and socioeconomic and climatic factors at different levels and to estimate the effects of these drivers on forest fire incidence. Our results showed that the density of impervious surfaces, density of cropland, mean monthly precipitation, mean monthly temperature, density of primary gross domestic product, annual monthly average relative humidity, and annual monthly average precipitation at the county level, prefecture-level city and climatic levels had significant multilevel associations with forest fire incidence in the Changbai Mountain area. These findings will effectively support the development of forest fire administrative policies for specific regions.
1. Introduction
Forest fire is one of the major natural disturbances in the global forest ecosystem and plays a pivotal role in regulating the structure and function of forest ecosystems and shaping landscape patterns and species diversity (Oom and Pereira Citation2013; Abatzoglou et al. Citation2018). Increasing wildfire activities with ongoing global climate change have caused great damage to forestry production, the ecological environment, human health and the social economy (Reid et al. Citation2016; Senande-Rivera et al. Citation2022). In addition, shifting fire regimes have significantly affected energy transfer and carbon cycles in terrestrial and atmospheric systems (He et al. Citation2019; Pausas and Keeley Citation2019).
Remote sensing monitoring revealed that the global annual burned area was approximately 3.12 million km2/y, and the annual carbon emissions caused by biomass burning were approximately 2.2 Pg C/y in the past three decades (Van Der Werf et al. Citation2017; Otón et al. Citation2019). In the context of global climate change, extreme fire weather increased by 14.0%, and fire seasons lengthened by 18.7% (Jolly et al. Citation2015; Jain et al. Citation2022), leading to a rapid increase in the risk of wildfires at a global scale. However, global burned areas exhibited different change characteristics in different regions, which ultimately resulted in a significant decreasing trend (–1.35 ± 0.49%/y) in global annual burned areas from 1998 to 2015 (Andela et al. Citation2017). These various change characteristics have attracted extensive attention to the key drivers and interactions that affect the dynamics of wildfires in different regions.
The fire regime triangle theory states that the comprehensive effect of three types of factors (vegetation, climate and ignition source) determines the regional wildfire dynamics. Studies on the interaction between multiple factors have been carried out at different spatial and temporal scales (Keeley Citation2004; Falk et al. Citation2007). At the regional and interannual scales, climate determines the spatial pattern of vegetation and the seasonal dynamics of fuels, shaping the geographic pattern and seasonal variability of wildfires (Archibald et al. Citation2013; Abatzoglou et al. Citation2018; Shen et al. Citation2019). At the local and short-term scales, weather conditions directly affect the flammability of fuels and risk of fire occurrence, which are generally measured by the fire weather index (Abatzoglou et al. Citation2019; Di Virgilio et al. Citation2019). Additionally, human activities are the major ignition sources that often cause large wildfires (Balch et al. Citation2017; Hantson et al. Citation2022). Previous studies generally considered socioeconomic data (such as total population, educated population and gross domestic product), land use/land cover, distance from infrastructure, accessibility and road density as proxies of ignition sources to quantify the impact of human activities on wildfires (Fuentes-Santos et al. Citation2013; Ruffault and Mouillot Citation2017; Rodrigues et al. Citation2018; Zambon et al. Citation2019; D’Este et al. Citation2020). In most cases, human factors were generally measured and analyzed at different administrative levels.
Some studies quantify and analyze wildfire drivers using climatic condition, vegetation dynamic and human activity factors only at a specific and single geographical unit, such as a continent, a terrestrial ecoregion and an administrative zone, to characterize spatial or temporal patterns of wildfire risk (Aragao and Shimabukuro Citation2010; Luo et al. Citation2017; Ferreira et al. Citation2020; Zhang et al. Citation2021; Zhao et al. Citation2021). Moreover, previous modelling methods generally neglected the interaction among wildfire drivers between different scale levels. Traditional correlation-based methods also have difficulty explaining multilevel factor interactions (Littell et al. Citation2009). With the shift in geographical scale, the role of scale-sensitive factors and their interactions may become more complex across different regions, so the relative importance of various factors affecting fire incidence may change with the scale (Falk et al. Citation2007; Parisien and Moritz Citation2009; Archibald et al. Citation2010). Moreover, changes in the social background, such as county, province and country, may also occur in geographical space, which may also have remarkable impacts on fire incidence. Therefore, it is necessary to model wildfire incidence in a specific geographical context using the multiscale or multilevel method and to analyze the interactions among wildfire drivers of different levels from the perspective of climate, fuel and ignition conditions. More importantly, evidence of concentrated wildfire occurrence (Zhang et al. Citation2017) also suggests the need for regional integration analysis that focusses on the wider geographical context rather than individual fire events (Urbieta et al. Citation2015). Continuous regions provide an appropriate geographic context for studying the impacts of fuel, climate and ignition source factors on regional wildfires.
Currently, existing studies based on single-level data may omit spatial variations in the correlation between factors at different levels and wildfire incidence (Aragao and Shimabukuro Citation2010; Zhang et al. Citation2021). The relationship between socioeconomic and climatic factors in high-level regions and wildfire incidence in low-level regions is poorly understood. Moreover, from a statistical perspective, the wildfire incidence within a county may have significant spatial autocorrelations with the geographical context (contiguous prefecture-level cities and climatic regions), which will deviate from the assumptions of traditional statistical models (Leung et al. Citation2000). Therefore, a multilevel regression model is ideal for estimating the region-specific effects of factors on wildfire incidence.
In this study, we choose prefecture-level cities and climatic regions as the high-level geographical context to explore the effects of socioeconomic and climatic factors on low-level (county-level) wildfire incidence. With a multilevel model, we performed an empirical analysis to investigate the spatial pattern of forest fire incidence in the Changbai Mountain area in China and to identify socioeconomic and climatic factors of wildfire incidence across different prefecture-level cities and climatic zones. The primary objective of this work is to explore whether the same socioeconomic and climatic factors can have a substantially different effect on wildfire incidence across different geographical scales.
2. Materials and methods
2.1. Study area
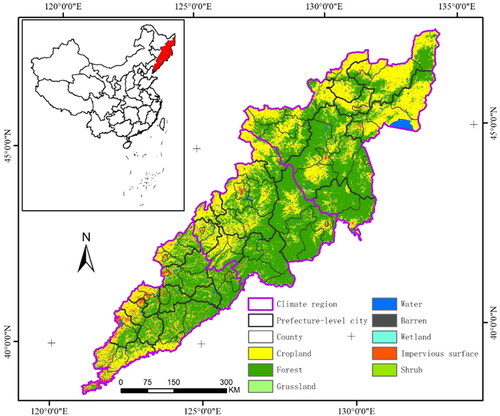
The Changbai Mountain area extends approximately 317,430.52 km2 across Northeast China (38°43′–47°32′ N, 121°2′–134°15′ E), geographically including the east of Heilongjiang, Jilin and Liaoning provinces. Changbai Mountain is approximately 1300 km long from north to south and 400 km wide from east to west. The topography of this area mostly varies from 410 to 1000 m, with a summit of 2740 m (Zhang et al. Citation2009). The temperate continental climate of the area is characterized by warm summers and cold winters. The mean annual temperature ranges from −7 °C to 3 °C. The mean annual precipitation ranges from 700 to 1400 mm, increasing with elevation (Bao et al. Citation2010). The forest community is the largest natural ecosystem (). Wildfires occur widely across forest regions and most wildfires were accidental events caused by human activities (Guo et al. Citation2016).
Figure 1. Study area and distribution of land use/land cover types in 2019.
2.2. Dataset and preprocessing
2.2.1. Administrative units and socioeconomic data
There are 85 counties and 21 prefecture-level cities in the study area (). We obtained the population size, middle school student count, primary school student count, gross domestic product (GDP) and agricultural GDP of each county and prefecture-level city from the annual statistical report. These variables were available from 2001 to 2019 and are measures of human ignition sources that may be associated with wildfire risk.
2.2.2. Land use/land cover data
The 30-m spatial resolution land use/land cover data from 2001 to 2019 were obtained from the website (http://doi.org/10.5281/zenodo.4417809). This Landsat-derived annual China land cover dataset (CLCD) covers the period from 1985 to 2019 and was extracted based on the Landsat images on the Google Earth Engine. We used the annual land use/land cover data of the Changbai Mountain area from 2001 to 2019 (). Additionally, the cropland and impervious areas (including residential areas and roads) of each county were calculated and used to characterize the ignition sources caused by changes in land cover type.
2.2.3. Climate data and climatic region
We obtained site records from 60 meteorological stations in the Changbai Mountain area from the China Meteorological Science Data Center (http://data.cma.cn/site/index.html), which included monthly average temperature, monthly total precipitation and monthly average relative humidity from 2001 to 2019. Using ANUSPLIN software and taking the altitude information of the station as a covariate, the climate data were interpolated into 1-km spatial resolution grid data (Hutchinson and Xu Citation2013). The mean monthly average temperature, precipitation and relative humidity were calculated by county.
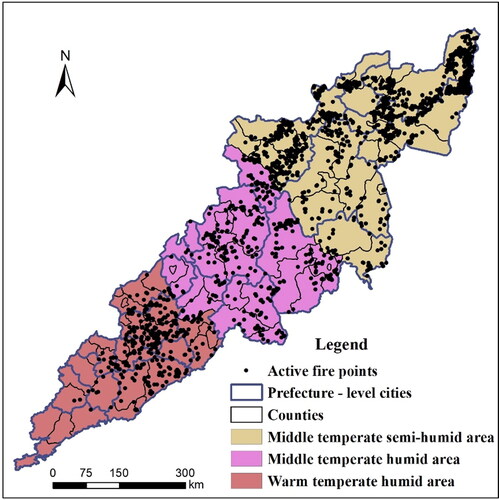
Referring to previous division methods of ecological climate zones (Hou Citation2012), the heat condition (temperature) and moisture condition (precipitation) were taken as the main indicators to synthesize all indicators into three climate zones using the K-means clustering algorithm. We then modified the boundaries of the original climate zones by intersecting the borderlines of counties to prevent spatial mismatches between administrative and climate zones (Parisien and Moritz Citation2009). Ultimately, this analysis developed three climate zones: middle temperate semi-humid areas, middle temperate humid areas, and warm temperate humid areas (). We also synthesized the average monthly temperature, precipitation and relative humidity according to the climate zones.
Figure 2. Climate zones and spatial pattern of active fire points in the study area from 2001 to 2019.
2.2.4. Active fire point data
This study used a satellite-based MODIS active fire dataset (version 6) containing daily fire pixel coordinate positions (MOD14A1/MYD14A1) (Giglio et al. Citation2016). The active fire product data from January 2001 to December 2019 in the study area were downloaded from the Level-1 and Atmosphere Archive & Distribution System (LAADS) Distributed Active Archive Center (DAAC) (https://ladsweb.modaps.eosdis.nasa.gov/). In addition, annual land cover classification data that matched each active fire image by year were also used to extract monthly active fires occurring in forest areas (). The count of monthly active fire points was summed by county. Then, the monthly fire incidence of each county is calculated by dividing the monthly fire points by the county area and expanding it 1000 times (the unit is times/1000 km2). Considering that the relationship between fire incidence and these factors is mostly nonlinear, the values of fire incidence were natural log-transformed.
2.3. Methods
2.3.1. Multilevel model
The multilevel model has different names, such as the multilevel linear model, mixed effects model, random coefficient regression model, random effects model and hierarchical linear model, in different research fields, for example, sociology, biostatistics and econometrics (Guo Citation2002; Liu et al. Citation2012; Peng and Knaap Citation2021). The multilevel model examines the influence of group-level and individual-level covariates on individual-level results by analyzing hierarchical data (Diez-Roux Citation2000; Leyland and Groenewegen Citation2003). This method solves the problem of data nesting (Matsueda and Drakulich Citation2016). Thus, multilevel models can link dependent variables (wildfire incidence) with predictive variables (social and climatic factors) at multiple geographical levels (Srholec Citation2010). In this study, multilevel models were implemented using hierarchical linear and nonlinear modelling (HLM, version 7.0).
2.3.2. Analysis of wildfire incidence with the cross-classified multilevel model
2.3.2.1. Structure of the cross-classified multilevel model
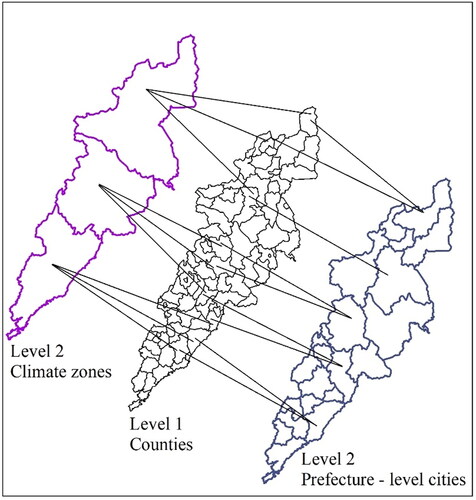
Suppose a cross-classified multilevel model has a two-level structure in which wildfire incidence may be the level 1 units (counties) nested within level 2 structures (prefecture-level cities and climate zones) that can be used to test for the statistical significance of various cross-level interactions (). With this model, we can identify and assess how the associations between group characteristics and wildfire incidence vary among counties, prefecture-level cities and climate zones. shows the cross-classified two-level model adopted in this study. Level 1 represents the effects of internal county variables on fire incidence, and level 2 represents the combined effects of variables in prefecture-level cities and climate zones on fire incidence.
Figure 3. Methodological framework. The abbreviations of variables used in level 1 were Den_Pop (population size), Den_Mid (middle school student count), Den_Pri (primary school student count), Den_GDP (gross domestic product), Den_PGDP (agricultural GDP), Den_Cro (cropland), Den_Imp (impervious area), Mon_Tem (temperature), Mon_Pre (precipitation), and Mon_RH (relative humidity). The abbreviations of variables used in level 2 were Pre_Pop (population size), Pre_Mid (middle school student count), Pre_Pri (primary school student count), Pre_GDP (gross domestic product), Pre_PGDP (agricultural GDP), Cli_Tem (temperature), Cli_Pre (precipitation) and Cli_RH (relative humidity).
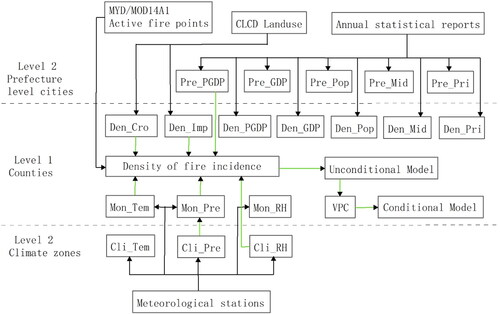
Figure 4. County-level factors and cross-classification between prefecture-level cities and climate zone characteristics as determinants of wildfire incidence.
2.3.2.2. Unconditional model
In cross-classified multilevel models, an unconditional model (also called empty/null model) is used to identify the variance component between the two levels, that is, to estimate whether the influence of the geographical regional background can be quantified through the clustering characteristics of wildfire incidence in prefecture-level cities and climate zones. This model did not consider the predictive variables in any level of analysis and was formulated as follows (Raudenbush and Bryk Citation2002):
(1)
(1)
where
is the forest fire incidence of the
th county,
th climate zone and
th prefecture-level city;
is the mean fire incidence in the
unit; and
is the random effect of the deviation in fire incidence of county
from the unit mean, and these deviations are normally distributed with
(2)
(2)
where
is the general mean (intercept) of fire incidence for all counties;
is the main random effect of climate zone
th, that is, the contribution of climate zone
th to all prefecture-level cities;
is the main random effect of prefecture-level city
th, that is, the contribution of prefecture-level city
th to all climate zones; and
is the random effect of the interaction, that is, the unit mean deviation from the predictions of the general mean and the two main effects.
The mixed model is defined by replacing (Equation2(2)
(2) ) in (Equation1
(1)
(1) ) as follows:
(3)
(3)
This model is known as a two-way analysis of variance model with random effects in line random effects in
a two-way interaction
and deviations within the unit
2.3.2.3. Variance partition coefficient
The two-level cross-classified multilevel model decomposes the total variance in wildfire incidence into county units () and group unit components. The variance partition coefficient (VPC) was used to quantify the clustering extent of wildfire incidence within geographical regions. Then, the group unit components were described as three components: variance between climate zone units (
), variance between prefecture-level city units (
) and residual variance between interaction terms (
). These intraclass coefficients are as follows (Raudenbush and Bryk Citation2002):
(4)
(4)
for the correlation between the wildfire incidence of counties that occur in the same prefecture-level city and climate zone.
(5)
(5)
for the correlation between the wildfire incidence of counties that occur in the same climate zone but in different prefecture-level cities.
(6)
(6)
for the correlation between the wildfire incidence of counties that occur in the same prefecture-level city but in different climate zones.
This statistical measure of clustering can provide the rationale for using prefecture-level cities and climate zones as geographical contexts. The value of VPC is between 0 and 1. A high VPC value indicates that a large-scale geographical context is very important in exploring the differences in wildfire incidence, whereas a value of 0 suggests that the high-level units are similar to random samples, the large-scale geographical region characteristics are not relevant to understanding the differences in wildfire incidence and the suitability of performing a multilevel analysis is less appropriate than using traditional models.
2.3.2.4. Conditional model
Except for the effects of intergroup heterogeneity (the unit in different levels), the variables related to level 1 (county) and level 2 (climate zone and prefecture-level city) affected the variation in the variance of wildfire incidence. In the unit of the corresponding level, the effect of independent variables of counties, prefecture-level cities and climate zones may be fixed. The influence of independent variables of counties may only be random between prefecture-level cities or between climate zones. Sometimes it is random in prefecture-level cities and climate zones at the same times. The effect of independent variables of prefecture-level cities may be random between climate zones, and the effect of independent variables of climate zones is the same in the prefecture-level cities. The fixed effects of the interaction terms of these independent variables of different levels may be estimated. Thus, the conditional model that incorporated the independent variables into EquationEquations (1)–(3) changed the meaning of the residual term and reflected the fixed and random effects of independent variables. This model can be formulated as follows (Raudenbush and Bryk Citation2002):
(7)
(7)
where
is the number of independent variables in the unit of counties (level 1);
is the level 1 coefficient;
is the independent variable
for county
in unit
is the level 1 random effect and
(8)
(8)
Where
are the numbers of variables in climate zones, prefecture-level cities and interaction terms created as variables of
and
is the model intercept;
are the fixed effects of variable
(the independent variables of prefecture-level cities);
are the random effects of variable
varied randomly over climate zones;
are the fixed effects of variable
(the independent variables of climate zones);
are the random effects of variable
varied randomly over prefecture-level cities;
are the fixed effects of interaction terms
are residual random effects of climate zones, prefecture-level cities and interaction terms of these units on
after taking into account all the covariates of
and
respectively. It is assumed that
and
and these effects are independent of each other.
The mixed model is defined by replacing (Equation8(8)
(8) ) with (Equation7
(7)
(7) ) as follows:
(9)
(9)
EquationEquation (9)(9)
(9) presents the conditional model in the cross-classified multilevel model and estimates the coefficients and residuals of the variables in different levels considering the fixed and random effects.
3. Results
3.1. Descriptive statistics of variables
We carried out linear correlation analyses to avoid collinearity between independent variables. A total of six significant variables were selected to explain the variation in wildfire incidence in the counties, prefecture-level cities and climate zones. The descriptive statistics of these variables are shown in . These independent variables were normalized before being applied to the models to reduce the influence of different units.
Table 1. Descriptive statistics of variables in cross-classified models.
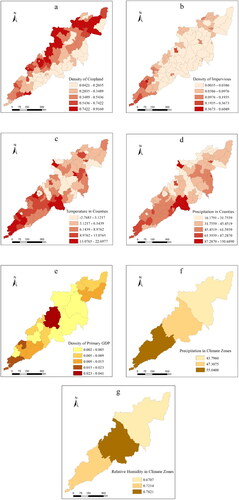
A total of 2164 active fire points were distributed in 85 counties in the study area from 2001 to 2019, and the mean annual fire incidence ranged from 0 to 2.294 times/km2 (expanded 1000 times) ( and ). The spatial distribution of fire incidence across the study area was quite different. The northern regions exhibited significantly higher fire incidence (>0.29) than the southern regions (<0.08). The top three counties with higher fire incidence were Raohe County, Hulin County and Yilan County (). In prefecture-level cities, the top three cities with the highest fire incidence were Shuangyashan city, Qitaihe city and Haerbin city (). At the climate zone level, the zone with the highest fire incidence was the middle temperate semi-humid area, followed by the warm temperate humid area and the middle temperate humid area (). The distribution of the mean values of some socioeconomic, land use and climate factor in county level, prefecture level and climate level were shown in . The spatial characteristics of these factors were significant difference at different levels. These results suggested that fire incidence and driving factors exhibited substantial differences between prefecture-level cities and climate zones.
Figure 5. Distribution of mean annual fire incidence in (a) counties, (b) prefecture-level cities and (c) climate zones in the study area.
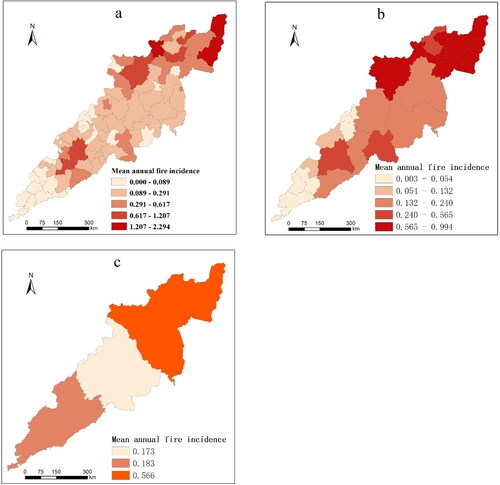
Figure 6. Distribution of mean annual land use and socioeconomic factors in county level (a, b, c, d), socioeconomic factor in prefecture level (e) and mean monthly climate factors in climate level (f, g).
3.2. Testing for the effects of level 2 regions on fire incidence
According to the cross-classified unconditional and conditional models, the equation becomes increasingly more complex, and the number of coefficients and residuals to be estimated increases drastically. To decrease the complexity, the random interaction effect () was equated to 0. The results for the unconditional model considering the restriction (
) showed that the county-level fire incidence was clustered within the higher-level regions (). The total variation in the fire incidence was divided into three components:
and
The correlations in level 2 units can be calculated as:
Table 2. Results of parameters and variance component of the unconditional model of fire incidence.
With the variance component, and
suggested that 13.64% of the total variation in fire incidence was estimated within prefecture-level cities and 10.00% within climate zones.
showed that 23.64% of the county-level differences in fire incidence were attributable to geographical contextual region factors. Thus, using cross-classified multilevel models was more suitable for analyzing the driving effects of multiscale factors on fire incidence than traditional regression models.
To assess the effects of the level 1 predictor variables in on the county fire incidence, the conditional level 1 model was developed as follows:
(10)
(10)
To decrease the complexity of the models and assess the interrelationship between level 1 and level 2, the intercept and slope coefficients were specified as functions of the variables of level 2 (). The conditional level 2 model was developed as follows:
(11)
(11)
(12)
(12)
(13)
(13)
(14)
(14)
(15)
(15)
Combining EquationEquation (10)(10)
(10) and EquationEquations (11)–(15), the full conditional model was written as follows:
(16)
(16)
This model assumed that the effects of the level 2 characteristics (climate zones and prefecture-level cities) on fire incidence were fixed and random. The variances in the intercept and slope of level 1 were significantly different across the different units of level 2.
3.3. Estimation of conditional models of fire incidence
The parameters and variance decomposition for the cross-classified conditional models of fire incidence are shown in . The estimation of the variance in fire incidence among county units () was 0.075 and less than 0.084 in the unconditional model. This showed that the independent variables explained 10.71% of the differences in fire incidence in the same climate zone and prefecture-level city after considering the effect of the difference in level 1 units. The Pre_PGDP of the prefecture-level city explained approximately 33.33% of the variation (
) in the mean fire incidence across the prefecture-level cities after considering the impact of the difference in county units and climate zones. This result indicated that a significant variation in fire incidence occurred due to differences in socioeconomic characteristics in level 2 (prefecture-level city). The Cli_RH of the climate zone level explained approximately 45.45% of the variation (
) in the mean fire incidence across the climate zones after considering the effects of the differences in county units and prefecture-level cities. The deviance of the conditional model (
) declined by 142.19 compared to the unconditional model (
= 502.878), suggesting that the level 2 characteristics can influence the fire incidence in level 1 units.
Table 3. Results of the parameter and variance components of the conditional model of fire incidence.
3.4. Association between fire incidence and level 1 variables
The relationships between fire incidence and variables in the multilevel model (EquationEquation (16)(16)
(16) ) are shown in . The level 1 variables Den_Cro, Den_Imp, Mon_Pre and Mon_Tem are significantly associated with the county fire incidence. The correlation between the density of cropland, as one of the proxies for fire ignition sources, and fire incidence showed a positive and significant coefficient (
). A positive correlation between the density of impervious surfaces and fire incidence was also found, and the coefficient (
) and significance were stronger than those of croplands. Impervious surfaces refer to surfaces covered by impermeable materials, generally including cities, roads and other surfaces with low permeability. The amount of impervious surface reflects the range and strength of human activities, which is also the main positive driver of fire incidence.
As one of the critical climatic variables in each county, a higher mean monthly temperature (Mon_Tem) was associated with higher fire incidence () according to the multilevel analysis. Conversely, a higher mean monthly precipitation (Mon_Pre) in each county resulted in lower fire incidence with stronger effects than temperature (
). These results showed that temperature has positive effects on fire incidence and precipitation has negative effects on the flammability of fuels, which indicated the distinct effects of climate on forest fires.
3.5. Association between fire incidence and level 2 variables
In level 2, we found that Pre_PGDP (determined by prefecture-level city) and Cli_Tem (determined by climate zone) were critical when estimating the region-specific effects based on multivariate analysis of fire incidence in county units. The counties of prefecture-level cities with higher PGDP have lower fire incidence (). The negative effects of socioeconomic factors on fire incidence implied that strengthened fire prevention capacity in developed regions limits forest fires. Likewise, the counties of climate zones with higher relative humidity have lower fire incidence (
), which suggests that higher relative humidity has negative effects on fuel flammability and forest fire incidence at regional scales.
Level 2 variables can affect the effect of level 1 variables on fire incidence. The positive and significant slope parameters () showed that the counties would have a positive impact on fire incidence if they were located in a wetter climate zone. In moister areas, well-hydrated environments facilitate the accumulation of fuels (especially small fuels) to promote the occurrence of fires.
4. Discussion
Exploring the spatial variation and identifying the socioeconomic and climatic drivers of wildfire incidence in contiguous regions are crucial for analyzing the driving effect of multiscale factors on wildfire occurrence. Unlike previous studies at a single level (Abatzoglou et al. Citation2018; Ferreira et al. Citation2020; Zhang et al. Citation2021), this study analyzed county-level fire incidence data using MODIS MOD/MYD14A1 products to assess the association between fire incidence and socioeconomic and climatic predictors across contiguous geographic regions. Using cross-classified multilevel models, we validated whether the relationships between the variables and fire incidence varied across the prefecture-level cities and climate zones. The results highlighted that the multiscale models can effectively analyze the spatial variation in wildfire incidence by estimating the regional contextual effects. With the unconditional model, the variance components ( and
) showed that 23.64% of the total individual differences in fire incidence were at the high contiguous region level from spatial and geographic perspectives. This finding suggested that contiguous contextual regions are very important in estimating individual differences in fire incidence. In addition to seeking to determine where most of the variability in the fire incidence occurs, this study evaluated the quantitative impacts of the presence of high-level variables. As the majority of studies on wildfire occurrence focussed on a single scale characteristic, our study would help wildfire managers or researchers focus their attention on the comprehensive effects of different types of factors on different scales.
In our study, the full conditional model indicated that the density of cropland, density of impervious surfaces, mean monthly precipitation and mean monthly temperature significantly impacted the wildfire incidence at level 1 (county). The effects of these variables on fire incidence are in line with those found in previous studies (Bian et al. Citation2013; Liu et al. Citation2017; Zhang et al. Citation2021). According to the variation in these four variables explained 10.71% of the differences in the fire incidence of counties in the same prefecture-level city and climatic zone. Therefore, other important factors affecting fire occurrences, such as population, weather and terrain, should be considered in the model (Iniguez et al. Citation2008; Rogers et al. Citation2020). However, with the increase in parameters, the complexity of the model will increase dramatically (Raudenbush and Bryk Citation2002). How to balance this contradiction is one of the main problems in the application of the cross-classified multilevel models.
We have set prefecture-level cities as one of the cross-classified level 2 regions. According to the administrative system of the study area, all counties are subordinate to the higher-level prefecture-level cities. The main policies and socioeconomic activities are affected by the prefecture-level city and are more direct than at the provincial level (Zhang et al. Citation2020). Therefore, as the higher-level geographical background of the county, the prefecture-level city can characterize the influence of regional environmental characteristics on county-level factors. The variation () in our study showed that the variable Pre_PGDP at the prefecture-level city level explained approximately 33.33% of the fire incidence across the prefecture-level cities. The remaining variation can be expressed by other variables in our model. Considering the contradiction between the number of parameters and the complexity of the model, selecting autocorrelated regions as the higher level in future studies may be a method to increase the interpretation of the geographical context region. There are two rationales: (i) the size of prefecture-level cities is different. In the larger cities, some counties are far away from each other, and the links between socioeconomic activities are weak. (ii) Counties with spatial autocorrelation have stronger similarities in socioeconomic and natural characteristics. Therefore, in subsequent research on the relationship between fire occurrence and socioeconomic parameters, it is imperative to break the administrative boundaries and build high-level regions with spatial autocorrelation.
The climate zone was another cross-classified level 2 region. The mean monthly relative humidity of this level explained 45.45% of the variation () in the fire incidence across the climatic zones. As one of the most important factors affecting fire occurrence, the important role of climate on forest fires was not sufficiently elucidated in this study. The reason was that the study area was located in the same climate zone (temperate continental climate). Although we generated three climate subareas (middle temperate semi-humid area, middle temperate humid area and warm temperate humid area) to embody the internal difference in the study area, these zones still differ from typical climatic regions (Beck et al. Citation2018). Therefore, if our model can be applied in a large-scale region with diverse climate types, our method will better reflect the multiscale effects of climate on regional forest fires.
5. Conclusion
The use of cross-classified multilevel models to assess the comprehensive effect of the vegetation, climate and ignition source factors on wildfire incidence is still rare. Using one single regression function to explore the relationship between these variables is a popular method. According to this study, the application of multilevel models provides researchers with new possibilities to test more complicated hypotheses in the case of multiscale factors.
We found that the density of impervious surfaces, density of cropland, mean monthly precipitation, mean monthly temperature, density of primary gross domestic product, annual monthly average relative humidity, and annual monthly average precipitation at the county level, prefecture-level city, and climatic levels had significant multilevel associations with forest fire incidence in the Changbai Mountain area. Our study justifies the application of the cross-classified multilevel model to wildfire research and establishes a novel method for estimating the effects of multi-scale factors on wildfire occurrences.
Understanding the spatial variations in wildfire incidence and examining the spatial heterogeneity in the effects of various socioeconomic and climatic variables on fire occurrence across regions with different geographical contexts provide a new perspective for making region-specific fire management policies. Researchers and administrators must focus on the factors of local and whole regions synchronously in the fire management activities.
Disclosure statement
The authors declare no conflicts of interest.
Data availability statement
The data that support the findings of this study are available from the corresponding author upon reasonable request.
Additional information
Funding
References
- Abatzoglou JT, Williams AP, Barbero R. 2019. Global emergence of anthropogenic climate change in fire weather indices. Geophys Res Lett. 46(1):326–336.
- Abatzoglou JT, Williams AP, Boschetti L, Zubkova M, Kolden CA. 2018. Global patterns of interannual climate-fire relationships. Glob Chang Biol. 24(11):5164–5175.
- Andela N, Morton DC, Giglio L, Chen Y, Van Der Werf GR, Kasibhatla PS, Defries RS, Collatz GJ, Hantson S, Kloster S, et al. 2017. A human-driven decline in global burned area. Science. 356(6345):1356–1362.
- Aragao L, Shimabukuro YE. 2010. The incidence of fire in Amazonian forests with implications for REDD. Science. 328(5983):1275–1278.
- Archibald S, Lehmann CER, Gomez-Dans JL, Bradstock RA. 2013. Defining pyromes and global syndromes of fire regimes. Proc Natl Acad Sci U S A. 110(16):6442–6447.
- Archibald S, Nickless A, Scholes RJ, Schulze R. 2010. Methods to determine the impact of rainfall on fuels and burned area in southern African savannas. Int J Wildland Fire. 19(6):774–782.
- Balch JK, Bradley BA, Abatzoglou JT, Nagy RC, Fusco EJ, Mahood AL. 2017. Human-started wildfires expand the fire niche across the United States. Proc Natl Acad Sci U S A. 114(11):2946–2951.
- Bao KS, Yu XF, Jia L, Wang GP. 2010. Recent carbon accumulation in Changbai Mountain Peatlands, Northeast China. Mt Res Dev. 30(1):33–41.
- Beck HE, Zimmermann NE, McVicar TR, Vergopolan N, Berg A, Wood EF. 2018. Present and future Koppen-Geiger climate classification maps at 1-km resolution. Sci Data. 5:180214.
- Bian HF, Zhang HY, Zhou DW, Xu JW, Zhang ZX. 2013. Integrating models to evaluate and map grassland fire risk zones in Hulunbuir of Inner Mongolia, China. Fire Saf J. 61:207–216.
- D’Este M, Ganga A, Elia M, Lovreglio R, Giannico V, Spano G, Colangelo G, Lafortezza R, Sanesi G. 2020. Modeling fire ignition probability and frequency using Hurdle models: a cross-regional study in Southern Europe. Ecol Process. 9:54.
- Di Virgilio G, Evans JP, Blake SAP, Armstrong M, Dowdy AJ, Sharples J, McRae R. 2019. Climate change increases the potential for extreme wildfires. Geophys Res Lett. 46(14):8517–8526.
- Diez-Roux AV. 2000. Multilevel analysis in public health research. Annu Rev Public Health. 21:171–192.
- Falk DA, Miller C, McKenzie D, Black AE. 2007. Cross-scale analysis of fire regimes. Ecosystems. 10(5):809–823.
- Ferreira LN, Vega-Oliveros DA, Zhao L, Cardoso MF, Macau EEN. 2020. Global fire season severity analysis and forecasting. Comput Geosci. 134:104339.
- Fuentes-Santos I, Marey-Perez MF, Gonzalez-Manteiga W. 2013. Forest fire spatial pattern analysis in Galicia (NW Spain). J Environ Manage. 128:30–42.
- Giglio L, Schroeder W, Justice CO. 2016. The collection 6 MODIS active fire detection algorithm and fire products. Remote Sens Environ. 178:31–41.
- Guo FT, Su ZW, Wang GY, Sun L, Lin FF, Liu AQ. 2016. Wildfire ignition in the forests of southeast China: identifying drivers and spatial distribution to predict wildfire likelihood. Appl Geogr. 66:12–21.
- Guo WS. 2002. Functional mixed effects models. Biometrics. 58(1):121–128.
- Hantson S, Andela N, Goulden ML, Randerson JT. 2022. Human-ignited fires result in more extreme fire behavior and ecosystem impacts. Nat Commun. 13(1):2717.
- He T, Lamont BB, Pausas JG. 2019. Fire as a key driver of Earth’s biodiversity. Biol Rev Camb Philos Soc. 94(6):1983–2010.
- Hou G. 2012. The study of the vegetation dynamic in eco-climatic regionalization of Changbai Mountains [dissertation]. Changchun: Northeast Normal University.
- Hutchinson MF, Xu T. 2013. ANUSPLIN version 4.4 user guide. [accessed 2023 Mar 16]. https://fennerschool.anu.edu.au/files/anusplin44.pdf.
- Iniguez JM, Swetnam TW, Yool SR. 2008. Topography affected landscape fire history patterns in southern Arizona, USA. For Ecol Manage. 256(3):295–303.
- Jain P, Castellanos-Acuna D, Coogan SCP, Abatzoglou JT, Flannigan MD. 2022. Observed increases in extreme fire weather driven by atmospheric humidity and temperature. Nat Clim Chang. 12(1):63–70.
- Jolly WM, Cochrane MA, Freeborn PH, Holden ZA, Brown TJ, Williamson GJ, Bowman D. 2015. Climate-induced variations in global wildfire danger from 1979 to 2013. Nat Commun. 6(1):7537.
- Keeley JE. 2004. Impact of antecedent climate on fire regimes in coastal California. Int J Wildland Fire. 13(2):173–182.
- Leung Y, Mei C-L, Zhang W-X. 2000. Testing for spatial autocorrelation among the residuals of the geographically weighted regression. Environ Plan A. 32(5):871–890.
- Leyland AH, Groenewegen PP. 2003. Multilevel modelling and public health policy. Scand J Public Health. 31(4):267–274.
- Littell JS, McKenzie D, Peterson DL, Westerling AL. 2009. Climate and wildfire area burned in western U.S. ecoprovinces, 1916-2003. Ecol Appl. 19(4):1003–1021.
- Liu MF, Zhao JJ, Guo XY, Zhang ZX, Tan G, Yang JH. 2017. Study on climate and grassland fire in HulunBuir, Inner Mongolia Autonomous Region, China. Sensors. 17(3):616.
- Liu Q, Dean AM, Allenby GM. 2012. Bayesian designs for hierarchical linear models. Stat Sinica. 22(1):393–417.
- Luo RS, Hui DF, Miao N, Liang C, Wells N. 2017. Global relationship of fire occurrence and fire intensity: a test of intermediate fire occurrence-intensity hypothesis. J Geophys Res Biogeosci. 122(5):1123–1136.
- Matsueda RL, Drakulich KM. 2016. Measuring collective efficacy: a multilevel measurement model for nested data. Sociol Methods Res. 45(2):191–230.
- Oom D, Pereira JMC. 2013. Exploratory spatial data analysis of global MODIS active fire data. Int J Appl Earth Obs Geoinf. 21:326–340.
- Otón G, Ramo R, Lizundia-Loiola J, Chuvieco E. 2019. Global detection of long-term (1982–2017) burned area with AVHRR-LTDR data. Remote Sensing. 11(18):2079.
- Parisien MA, Moritz MA. 2009. Environmental controls on the distribution of wildfire at multiple spatial scales. Ecol Monogr. 79(1):127–154.
- Pausas JG, Keeley JE. 2019. Wildfires as an ecosystem service. Front Ecol Environ. 17(5):289–295.
- Peng Q, Knaap GJ. 2021. Investigating the effects of service and management on multifamily rents: a multilevel linear model approach. J Hous Built Environ. 36(3):991–1009.
- Raudenbush SW, Bryk AS. 2002. Hierarchical linear models: Applications and data analysis methods. 2nd ed. Thousand Oaks, CA: SAGE Publications.
- Reid CE, Brauer M, Johnston FH, Jerrett M, Balmes JR, Elliott CT. 2016. Critical review of health impacts of wildfire smoke exposure. Environ Health Perspect. 124(9):1334–1343.
- Rodrigues M, Jimenez-Ruano A, Pena-Angulo D, de la Riva J. 2018. A comprehensive spatial-temporal analysis of driving factors of human-caused wildfires in Spain using geographically weighted logistic regression. J Environ Manage. 225:177–192.
- Rogers BM, Balch JK, Goetz SJ, Lehmann CER, Turetsky M. 2020. Focus on changing fire regimes: interactions with climate, ecosystems, and society. Environ Res Lett. 15(3):030201.
- Ruffault J, Mouillot F. 2017. Contribution of human and biophysical factors to the spatial distribution of forest fire ignitions and large wildfires in a French Mediterranean region. Int J Wildland Fire. 26(6):498–508.
- Senande-Rivera M, Insua-Costa D, Miguez-Macho G. 2022. Spatial and temporal expansion of global wildland fire activity in response to climate change. Nat Commun. 13(1):1208.
- Shen H, Tao S, Chen Y, Odman MT, Zou Y, Huang Y, Chen H, Zhong Q, Zhang Y, Chen Y, et al. 2019. Global fire forecasts using both large‐scale climate indices and local meteorological parameters. Glob Biogeochem Cycles. 33(8):1129–1145.
- Srholec M. 2010. A multilevel approach to geography of innovation. Region Stud. 44(9):1207–1220.
- Urbieta IR, Zavala G, Bedia J, Gutierrez JM, San Miguel-Ayanz J, Camia A, Keeley JE, Moreno JM. 2015. Fire activity as a function of fire-weather seasonal severity and antecedent climate across spatial scales in southern Europe and Pacific western USA. Environ Res Lett. 10(11):114013.
- Van Der Werf GR, Randerson JT, Giglio L, Van Leeuwen TT, Chen Y, Rogers BM, Mu M, Van Marle MJE, Morton DC, Collatz GJ, et al. 2017. Global fire emissions estimates during 1997–2016. Earth Syst Sci Data. 9(2):697–720.
- Zambon I, Cerda A, Cudlin P, Serra P, Pili S, Salvati L. 2019. Road network and the spatial distribution of wildfires in the Valencian community (1993-2015). Agriculture-Basel. 9(5):1–15.
- Zhang Y, Xu M, Adams J, Wang X. 2009. Can Landsat imagery detect tree line dynamics? Int J Remote Sens. 30(5):1327–1340.
- Zhang Y, Wang Q, Wang Z, Yang Y, Li J. 2020. Impact of human activities and climate change on the grassland dynamics under different regime policies in the Mongolian Plateau. Sci Total Environ. 698:134304.
- Zhang ZX, Feng ZQ, Zhang HY, Zhao JJ, Yu S, Du W. 2017. Spatial distribution of grassland fires at the regional scale based on the MODIS active fire products. Int J Wildland Fire. 26(3):209–218.
- Zhang ZX, Li JJ, Yu S, Zhao JJ. 2021. Spatial accessibility of anthropogenic fire ignition sources of grassland fire in northeast China. Int J Wildland Fire. 30(10):763–775.
- Zhao H, Zhang Z, Ying H, Chen J, Zhen S, Wang X, Shan Y. 2021. The spatial patterns of climate-fire relationships on the Mongolian Plateau. Agric For Meteorol. 308–309:108549.