
 ?Mathematical formulae have been encoded as MathML and are displayed in this HTML version using MathJax in order to improve their display. Uncheck the box to turn MathJax off. This feature requires Javascript. Click on a formula to zoom.
Abstract
This study investigates the potential of freely available Sentinel-1 imagery coupled with Google Earth Engine (GEE) for mapping and monitoring flooding in Dar es Salaam. Sentinel-1 images (n = 55) available during the rainy season (March–May) since 2016 were used and processed in GEE. For separating water and land surfaces, we used a histogram-based automatic thresholding method. The binarization accuracy was assessed using confusion matrix based on 1064 randomly generated points in GEE. Overall accuracy of 95% (Kappa = 0.90) were achieved. Dar es Salaam has experienced flood inundation per flood event on average over an area of 50 km2 in March 2019 and 2021. Territories located along the Ocean and inland water shores, built and bare ground were subject to flooding compared to other land cover types. Flooding inundations have been difficult to detect in the city center. With the current temporal and spatial resolution of Sentinel-1, flood detection in city centers remains a challenge yet. However, Sentinel-1 images, coupled with GEE cloud computing simplified flood mapping and monitoring in a large urban region and this approach can be applied in other large cities and their surroundings for countries where data gap and lack of processing tools are critical challenges.
1. Introduction
Urban flooding hazard has become one of the key concerns of researchers, policy makers, and the wider community due to its impacts on natural environment, infrastructure, and human life (Callaghan et al. Citation2020; O’Donnell et al. Citation2020). In urban areas, the most common causes of flooding are urbanization and its correlated increase in impervious surfaces, disappearance of green areas and land use changes. Moreover, in poor countries, insufficient drainage, and inappropriate solid waste management result in blockage of drainage (Sakijege et al. Citation2012; Woldai Citation2020). Flood disasters are worse in African countries where urban infrastructures are poor (Ramiaramanana and Teller Citation2021). It is aggravated by the absence of proper planning and decision making at various scales which in turn are the result of absence of multi-scale and high-quality data. The best cost-effective solution for mapping flooding hazards in cities of sub-Saharan Africa that have geographic data gaps is the use of open access remote sensing data and free and open-source solutions (Notti et al. Citation2018; DeVries et al. Citation2020).
One of these resources is the freely available Sentinel-1 SAR imageries. Although flood mapping based on SAR imagery is usually complex due to data and processing errors, it could be the best option for flood monitoring in data-poor areas such as sub-Saharan Africa. The sources of these errors are water-like surfaces, noise-like speckle, and geometric correction algorithms (Shen et al. Citation2019). Similar to water surfaces, smooth surfaces and shadowed areas exhibit close-to-specular scattering. Noise-like speckle is a major problem of SAR images; SAR images with 5–10 m resolution are subject to speckles and surrounding strong scatters for detecting flooding in headwater flood plains due to their narrow channels (Gomez et al. Citation2019). Location errors are also introduced due to limited accuracy of input elevation data and bias from geometric correction algorithms in the attempt to correct SAR images to ground distance.
Despite their complexity, various studies have demonstrated the use of SAR data for flood monitoring and other disasters in both rural and urban areas (Montalti et al. Citation2019; Shen et al. Citation2019). Some of these studies used high-resolution SAR data for a near-real-time monitoring (Tanguy et al. Citation2017). Various studies have also investigated the use of moderate resolution SAR data, such as Sentinel-1 for flood monitoring (Giustarini et al. Citation2013; Li et al. Citation2019; Zhang et al. Citation2021). In Africa, there are a few studies on flood monitoring that used SAR data. Most of these studies either fail to use Sentinel-1 images, use Sentinel-1 images for flood mapping in non-urban areas (Refice et al. Citation2020), or focus on small catchments (Adedeji et al. Citation2021; Cherif et al. Citation2021; C. Li et al. Citation2022; Series et al. Citation2021). There are also studies that used participatory disaster risk method for assessing vulnerability in spatial terms using both biophysical and social indicators before Sentinel-1 was operational (Hambati and Gaston Citation2015). However, most flood mapping studies were conducted based on measured flood data including community participation and laboratory analysis (Kikwasi and Mbuya Citation2019; Petersson et al. Citation2020).
The recent development of new machine learning techniques has improved the processing of large data and flood monitoring, which has advanced the simplification of SAR data processing (Munawar et al. Citation2022). Various methods are available that assist the use of SAR data for flood mapping and other water related applications. The most commonly used methods are classification (supervised/unsupervised), thresholding, segmentation, and change detection (Shen et al. Citation2019). In the classification method, the fuzzy logic and random forest classifiers are most widely used to determine a threshold by using a theoretical scattering model for classifying pixels (Andaya et al. Citation2019; Iqbal and Talukder Citation2020; Lin et al. Citation2020; Arboleda et al. Citation2021). These methods prove reasonable accuracy beside the fact that the automatic classification requires a microwave scattering model that in turn introduces model uncertainty. Moreover, human labeling of samples is tedious and consumes time (Pulvirenti et al. Citation2011; Shen et al. Citation2019). The most famous thresholding method is the Otsu method (Otsu Citation1979). This method divides features into binary classes, such as water and non-water in case of flood mapping. This method uses a histogram thresholding approach for binarization. Similarly, a histogram partitioning method was introduced by (Matgen et al. Citation2011). These methods require either a bimodal image histogram or some sample data to initialize the water distribution. Unlike the above pixel-based methods, segmentation considers connected homogeneous pixels to separate water and non-water pixels. Segmentation method is believed to be more resistant to speckle because it utilizes morphological information together with radiometric information (Dubey et al. Citation2017; Zhou et al. Citation2020). This method suffers from over estimation of either of the classes as the classification takes place at object level (Shen et al. Citation2019). The change detection approach considers the before and after flood backscattering intensities. This avoids geometric errors either by using SAR images acquired from the same or by indirect evaluation of changes from binary water masks, yet could compromise speckle-caused noise (Landuyt et al. Citation2019).
Despite the availability of new SAR data processing methods, flood mapping and monitoring in complex urban environments remain a critical challenge (Pelich et al. Citation2022). Among the various techniques, interferometric coherence has been widely used for flood mapping in urban areas (Munawar et al. Citation2022). A recent study also used both the Polarimetric (PolSAR) and Interferometric (InSAR) of Sentinel-1 to detect urban flooding using random forest method (Baghermanesh et al. Citation2021). Various studies use a single or combined methods to separate water surfaces from non-water features. For example, a split-based automatic thresholding method was applied to determine the global threshold water and non-water features (Bovolo and Bruzzone Citation2007; Martinis et al. Citation2009). In split-based automatic thresholding, a SAR image is first divided into tiles and individual thresholds are determined using the Kittler and Illingworth (KI) method (Kittler and Illingworth Citation1986). Global minimum and quality index are used to determine a global threshold based on splits that have sufficient water and non-water pixels. Then, the OO segmentation algorithm is used to segment the image into continuous and non-overlapping object patches at different scales. A combination of segmentation and fuzzy logic classifier methods was used for densely vegetated areas by using backscattering change and backscattering during flooding as inputs (Pulvirenti et al. Citation2011). A change detection method was also combined with the M2a algorithm in order to determine a threshold to separate water and non-water pixels (Matgen et al. Citation2011). Similarly, Lu et al. (Citation2014) used a change detection method combined with a method that estimates the statistical curve of the water pixels to determine flood pixels. A change detection method does not necessarily require a bimodal distribution, yet determining and globalizing change detection threshold becomes problematic. Senthilnath et al. (Citation2013) have also fused speckle removal filters and image segmentation methods for flood mapping.
In addition, flood monitoring in sub-Saharan Africa and other poor regions remains a challenge due to the complexity of methods and data gaps. Similarly, despite the development of new machine learning methods and Sentinel-1 SAR imagery being a tremendous resource for flood monitoring (Bauer-Marschallinger et al. Citation2018; Psomiadis Citation2016), its potential in sub-Saharan urban regions has been under-explored to date. Furthermore, flood monitoring in sub-Saharan Africa and other poor regions remains a challenge due to methodological complexity and data gaps. This study investigates the potential of the open access Sentinel-1 ground range detection (GRD) intensity data for flood mapping and monitoring in large urban areas using a simple automatic histogram-based thresholding method and Google Earth Engine (GEE) cloud computing. We used the GRD backscatter intensity data also because the SLC data from which coherence can be derived are not available on GEE. We used the Otsu image thresholding method because it is a simple method that can binarize water and non-water pixels based on a bimodal image histogram approach used in GEE cloud computing and is easily adaptable to similar studies. The study explores a simple method for mapping and monitoring flood disasters in large urban areas using Sentinel-1 and GEE cloud computing that can be easily reproducible and transferable in other studies without much adaptation.
Focusing on Dar es Salaam urban region, the study investigates (1) the capability of Sentinel-1 imagery for mapping and monitoring flood inundation, the use of GEE for a simplified method of flood disaster mapping and monitoring, and (2) the spatial and temporal pattern of flooding in Dar es Salaam from 2016–2021.
2. Methodology
2.1. Study area description
Dar es Salaam is located between 6.58°–7.25° S and 39°–39.56° E at the coast of Indian Ocean in Tanzania. It is one of the fastest growing mega cities in Africa with a total area of 1660 km2 (Kebede and Nicholls Citation2012). Generally, the city is divided into four ecological zones. The upland zone comprises of hilly areas to the west and north of the city, the middle plateau and lowland zone extend from Tegeta valley in the north through Msimbazi and Mzinga valleys in the middle to Muguvia valley in the south east (). Shoreline fields consisting of superimposed Pleistocne clay bound and equally unvarying topography of up to 35 m above sea level. The fourth ecological zone is the coastline and beach area that includes the shoreland shouldering the ocean (Kabanda Citation2020).
Figure 1. Study area map. The boundary of Dar es Salaam is delineated from OpenStreetMap. The data of the built up areas is found from GitHub (Dooley et al. Citation2020).
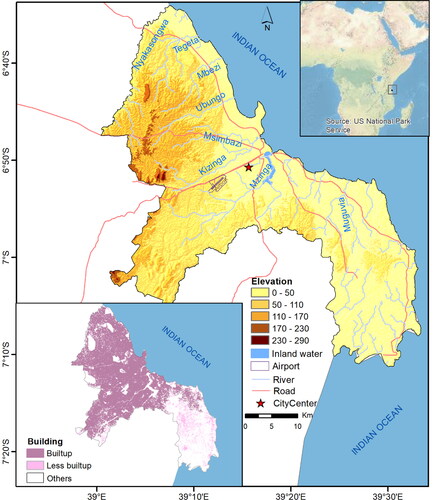
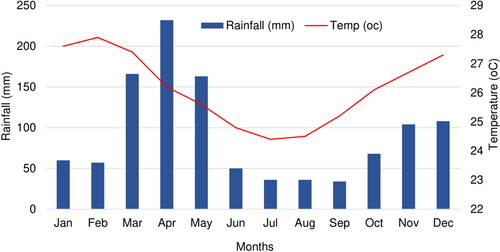
The climate of the city is tropical Aw according to the Köppen-Geiger climate classification with bimodal rain distribution characterizes the city with the high rain season extending from March-May (). The annual rainfall reaches 1115 mm (fluctuating between 800 and 1300 mm) with a mean monthly rainfall reaching 232 mm in April. The average daily temperature is 26 °C rising to 35 °C during the warmest months from October to March. (Kebede and Nicholls Citation2012; Anande and Luhunga Citation2019). Even though there are less than 30 years of records and sea-level change are not well known under projected climate change and possible sea level rise, coastal ecosystems are highly threatened (Anande and Luhunga Citation2019).
Figure 2. Climate of the study area. Date source: CLIMATE-DATA.ORG.
In terms of drainage, various rivers and small streams flowing mainly west-east direction towards the Indian Ocean drain the city. The Indian Ocean borders the city from the northeast to southeast coasts (). The inland rivers, inland water bodies, and the Indian Ocean are the source of flood inundation in the city.
In terms of urbanization and building expansion, the building patterns of Dar es Salaam are categorized as builtup and less builtup based on the building data obtained from GitHub (Dooley et al. Citation2020). The building data contains an urban/rural classification for each grid cell based on building patterns in their surroundings. The builtup area in indicates the most builtup areas of the city, whereas the less builtup contains grid cells with less urban buildings. The rest indicate grid cells without any building-footprint centroid. The most built-up areas of the city lay in the northern half section of the city ().
2.2. Study design and methodological flow
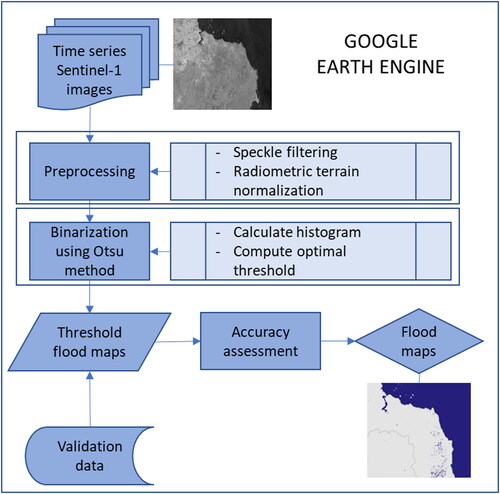
The study used Sentinel-1 images processed in Google Earth Engine (GEE) to map flooded areas in the Dar es Salam region. Preprocessing that includes speckle filtering and radiometric terrain normalization was carried. The preprocessed images were binarized into two classes (water and non-water) using the Otsu method. Thresholds were determined using image histogram method. Accuracy assessment was carried out on the binary maps using automatically generated validation points in GEE. Finally, time-series flood maps were produced ().
Figure 3. Flow diagram of the methodological approaches used.
2.3. Image availability and selection
Sentinel-1A and B work synchronically to map the earth every six days, each of them capturing the same place every 12 days (ESA Citation2021). The images are available in various processing levels and are already calibrated and ortho-corrected using the Sentinel-1 Toolbox. They are freely available from the Copernicus Open Access Hub (https://scihub.copernicus.eu/dhus/#/home) and GEE. Sentinel-1A and B are equipped with a C-Band SAR payload (at 5.405 GHz) and the interferometric wide swath (IW) acquiring GRD images of dual polarized SAR data with VV/VH polarization (Twele et al. Citation2016). The GRD images have a high spatial resolution of 10 m acquired in IW mode (Torres et al. Citation2012). We used the Sentinel-1 GRD C-band product to extract the ground backscatter of the images to detect flood inundation. We used the vertical transmit and vertical receive (VV) co-polarization mode that gives intensity values of scattering radiation due to its appropriateness for urban and non-forest areas (Veloso et al. Citation2017; Mullissa et al. Citation2021). The VV co-polarization is more accurate than the VH and other co-polarization modes for detecting flooding in urban areas (Zhang et al. Citation2021; Pelich et al. Citation2022). Our study would have benefited from the added value of coherence, when combined with the backscattered intensities. However, the Single Look Complex (SLC) (Lu et al. Citation2018; Nikaein et al. Citation2021) data from which coherence is computed are not available in GEE as we aim to develop a simple method that is scalable and based on GEE.
Most of the flood events in Dar es Salaam happen in the high rainy season, March-May. As Sentinel-1B started operating in April 2016, all images available from 01 May 2016–31 May 2021 were used for this study.
The Sentinel-1 constellation consists of two satellites, with an orbital difference allowing them to provide repeat images of a location every six days when combined. However, as shown , Sentinel-1A images give a full coverage of the city (), whereas the coverage of Sentinel-1B varies. Some of the Sentinel-1B images cover only the southeastern half of the region () and the rest miss a small section in this part of the region (). Due to the pattern of availability, we used those images that cover more than 90% (images ‘a’ and ‘b’ as depicted in ) of the city.
Figure 4. (A) Footprints of Sentinel-1 (a, b) for May 2021 in Dar es Salaam. (a) Sentinel-1A including three images captured on 05, 17, and 29 May, (b) Sentinel-1B covering about 90% of the city with two images captured on 08 and 20 May, (c) Sentinel-1B covering only southeastern half of the city with three images captured on 03, 15, and 27 May, and (d) overlap of all repeat Sentinel-1A and B images, and (B) temporal distribution of the Sentinel-1A and B images in Dar es Salaam.
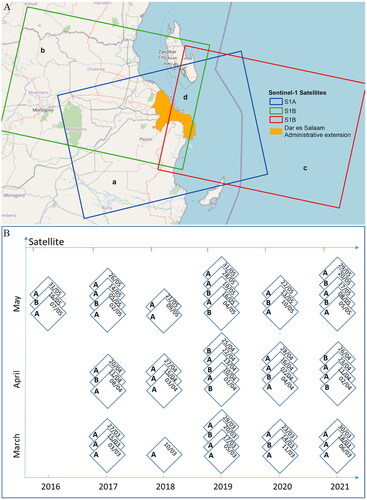
Out of the available images, 16 were from Sentinel-1B and have descending orbit passes, whereas the rest (39) images were Sentinel-1A with an ascending orbit pass. Sentinel-1B images that have more than 90% coverage of the city were not available in 2016 and 2018. They were also absent in March of 2017 and 2021 (). These images were randomly distributed across months and years without regularity. In the other years, except 2019, the image availability was not as expected according to the satellite constellation and revisit time.
The ESRI 10 m resolution land cover map generated from Sentinel-2 was obtained from the ESRI website living atlas. It was downloaded using the application in https://www.arcgis.com/apps/instant/media/index.html?appid=fc92d38533d440078f17678ebc20e8e2.
2.4. Preprocessing
In GEE, Sentinel-1 imagery is already preprocessed to calibrated backscatter coefficient (sigma0) in decibels (dB) using thermal noise removals, data calibration, multi-looking, and Range-Doppler terrain correction (Vollrath et al. Citation2020; Mullissa et al. Citation2021). In order to maximize the information extraction, we preprocessed the Sentinel-1 images for speckle filtering and radiometric terrain normalization in GEE (Mullissa et al. Citation2021).
2.4.1. Speckle filtering
Inherently, the SAR images are affected by speckle noises. The speckle effect is a result of interference from many scattering echoes within a resolution cell (Meyer Citation2019). Speckles downgrade the quality of image data, as well as interfering in the understanding of backscatter responses from the surface features (Adiri et al. Citation2017). Speckle filtering is an essential part of the preprocessing activities in SAR products (Veloso et al. Citation2017). The principle of speckle filtering is to reduce the variance of the complex speckle scattering and improve the estimate of the scattering coefficient. These speckle filters range from a simple blind low-pass filter, such as the boxcar filter, to different adaptive filters, such as the Lee filter (Lee Citation1980), Gamma Maximum A-posterior (MAP) Filter (Lopes et al. Citation1990), Refined Lee filter (Lee et al. Citation1999), and the improved Lee sigma filter (Lee et al. Citation2008). In this study, the Lee filter with a 5 × 5 window was applied to the images (Adiri et al. Citation2017; Kaplan and Avdan Citation2018; Filgueiras et al. Citation2019). The Lee filter is a particular case of the Kuan filter, which filters based on the criterion of the mean minimum square error (MMSE) (Gagnon and Jouan Citation1997).
2.4.2. Radiometric terrain normalization
Terrain correction is required to solve topographic effects on the SAR backscatter (Veloso et al. Citation2017). The terrain correction is needed because of the side looking of SAR systems. Every target located on the terrain being observed by the radar is mapped onto the slant range domain (Adiri et al. Citation2017; Filgueiras et al. Citation2019). Even though the Sentinel-1 images available in GEE are corrected for geometric distortions, radiometric terrain normalization was required. Radiometric terrain normalization masks pixels in the active layover and shadow area in the image (Veloso et al. Citation2017; Vollrath et al. Citation2020; Mullissa et al. Citation2021). For radiometric terrain normalization, two angular-based correction methods are available based on volume and surface scattering (Vollrath et al. Citation2020). The volume scattering model is important for applications related to vegetation mapping. For urban application, as is in our case, the angular-based surface scattering model is most appropriate (Vollrath et al. Citation2020). We implemented surface model for radiometric terrain normalization in GEE.
2.5. Separating water and non-water surfaces (binarization)
To detect flooded areas, separating water from non-water features was essential. There are various techniques commonly used for binarization of image data. Some of them are Markov random fields and wavelet transformation (Moser et al. Citation2007), histogram thresholding (Tobias and Seara Citation2002), and clustering (Li et al. Citation2015). These methods have been adopted in various applications in recent years. Histogram thresholding is one of the most widely used techniques for converting the values images with a single band into two classes as ’target’ and ’background’ (Chini et al. Citation2017; Sadek and Li Citation2019). Nevertheless, choosing an appropriate threshold is a crucial and challenging step for precise and reliable binarization. In image analysis, we need objective and automatic determination of a single threshold to distinguish two types of relatively homogenous features from a single band image space (bimodal pixel distribution), e.g. land and water (Ahmed Citation2021). In this study, Otsu Method for image segmentation was used (Otsu Citation1979). The Otsu Method is a histogram thresholding-based automatic image binarization technique. Otsu’s method is a means of automatically finding an optimal threshold based on the observed distribution of pixel values. The idea behind Otsu’s method is segmenting by minimizing the intra-class variance on two different homogeneous classes using an image histogram approach. The histograms of images of these classes represent different ranges of intensity values and the method divides the histogram into two clusters with a threshold defined as a result of minimizing the weighted variance of two different homogeneous classes. The following equation was used to minimize intra-class variance (Otsu Citation1979; Donchyts et al. Citation2016)
(1)
(1)
where p1 and p2 are the probabilities of the two classes divided by a threshold, the value of which ranges from 0 to 255.
In order to find the threshold, we used the approach that maximizes inter-class variance (equivalently, minimizes the sum of intra-class variances). The inter-class variance was defined as:
(2)
(2)
where
indicates the mean digital number in class k and μ refers to the mean digital number of the entire dataset. Class k is defined by every class value less than some threshold t. Here, we are estimating the threshold that maximizes the between sum of squares (BSS). Since we have two classes (water and land), p is 2 in our case. The BSS is calculated using the following formula (Sarnacchiaro and D’ambra Citation2007; Krishan Kumar et al. Citation2020):
(3)
(3)
where i refers to observations (pixels) in each class, j refers classes (water and non-water), and ni refers to the number of observations. Variable C denotes the global mean of the VV values for both water and land. The mean for the class and the global mean C is used in calculating the BSS. C is denoted as:
(4)
(4)
where N refers to the total number of observations in all classes (water and land). It examines the distance between the means of water and land and considers the squared sum of the observations in both classes-water and land (
) divided to N. Therefore, the BSS is the squared sum of water and land classes in in each Sentinel-1 image.
For each separate cluster (water and non-water), the probability is calculated using the cluster probability computation equation denoted as:
(3)
(3)
where
n denoting number of pixels in the image.
2.6. Mapping permanent water bodies
Not all water features detected from the binary classification represent flooded areas and a distinction should be made with permanent water bodies. To map the permanent water bodies, various options were available: using Sentinel-1 SAR images of the dry season where no rainfall and no flooding are experienced, or considering areas with the highest frequency of flooding during the rainy season with the assumption that flooding would not happen on each image of the rainy season. We used the second option by preserving the oceans around Dar Es Salaam as a base for detecting permanent water bodies (DeVries et al. Citation2020). The permanent water bodies were determined based on the frequency of flood marks obtained from the Sentinel-1 images. In this case, frequency measured by the number of years where flooding occurred in a location. Over the last six years we obtained 55 Sentinel-images available for Dar es Salaam. Water/flood marks after binarization of water and non-water features obtained in more than 50 of the images similar to the adjacent Ocean water were considered as permanent water bodies based on the assumption that flooding marks cannot be found at the same location in all the images.
2.7. Validation
In remote sensing data classification, several accuracy assessment methods are available (Huang et al. Citation2017). Recently, many remote sensing accuracy assessment methods for image classification are in use and most of those are derived from a confusion or error matrix. In the literature, confusion matrix is at the core of accuracy assessment (Congalton and Green Citation2019). In this study, the accuracy of the binarization to separate water and land was assessed using the confusion matrix. Point observations (n = 1064) randomly produced in GEE were used as test set. The accuracy assessment was implemented on the Sentinel-1 images acquired on 29 May 2021. The classes of the ground truth points were determined based on visual interpretation of higher resolution optical images (Airbus’ Pleiades, with around 0.5 m resolution) in Google Earth captured on 12/05/2020. In total, we determined 506 water and 558 non-water ground-truth points. VV backscatter of builtup, channelbed, floodplain, and waterbody by taking four sample areas in and around Mbezi river were analyzed to provide evidences of spectral confusion among these features that was used in the discussion section of this study.
3. Results
3.1. Distribution of the VV values
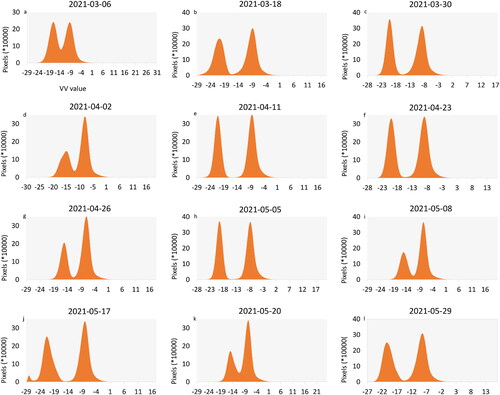
depicts the distribution of the intensity values of the polarization (VV) intensity images that cover Dar es Salaam over the periods from 01 March–31 May 2021. As we have over 50 images since 2016, we presented here only the images of the 2021 rainy season. The pixel distribution is a reflection of the area covered by the scene in relation to land and water (mainly the Indian Ocean). We observe a difference in the Sentinel-1A and B histograms. This difference is related to the proportion of water bodies and land surfaces area in the scenes. The Sentinel-1A scenes cover a proportional size of water bodies and land surfaces, whereas the Sentinel-1B scenes cover larger land surfaces than the ocean. The histograms clearly show the distinct separation of water and land surfaces based on the VV values of the ground range detection of the Sentinel-1 SAR images. The histograms of the VV values on 06/03/2021 seem to have a bias with less sharp separation and higher threshold value (−13.02) compared to the other dates. On this date, as can also be observed in , large areas appear to be flooded.
Figure 5. Histograms of the single co-polarization (VV) intensity images that cover Dar es Salaam over the period from 01 March–31 May 2021 presented as a sample representation to show the pattern of the sigma VV values (dB) over the images. S1A refers to Sentinel-1 A, and S1B refers to Sentinel-1 B.
3.2. Thresholds for separating water and land
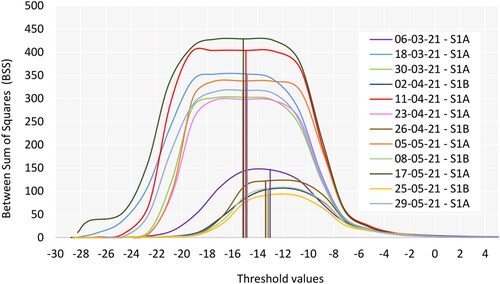
The threshold charts of the Sentinel-1 images available in 2021 are plotted in . This chart shows the distribution of the threshold values evaluated based on the variance of the co-polarization (VV) intensity values of the GRD band reflected by land and water. The y-axis gives the between sum of squares (BSS) values. The sum of squares measures the deviation of the VV intensity values from the mean. A higher sum of squares indicate a larger degree of variability. The BSS values are defined at different threshold values. The threshold at which the BSS value is maximized (indicated by the vertical lines) distinguishes water and land surfaces VV intensity values.
Figure 6. Representative threshold charts of the co-polarization (VV) intensity values over the period from 01 March–31 May 2021. The vertical lines indicate the thresholds that separate water and non-water surfaces. The satellite (A/B) is as presented in .
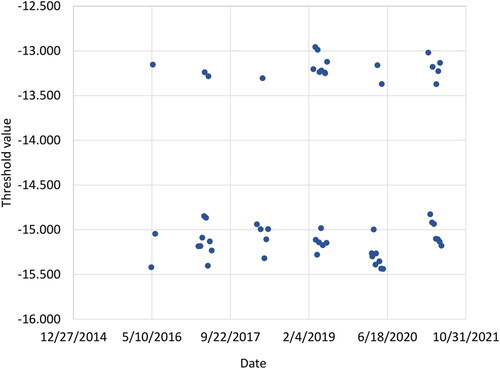
In , the discrete threshold values of over 55 images are plotted. These threshold values are used to separate water and land in each scene. The threshold values vary between −15 and −12. There is no significant variation observed among images in different years. Most of those images with threshold values ranging from −15.5 and −14.5 have an ascending orbit path, whereas most of those in the group with threshold values ranging between −13.5 and −12 have a descending orbit path. The variation in the threshold values seems mainly due to variation in VV values that arise from the difference in orbits, which by itself needs further investigation. It could also be related to the fact that SAR image suffers from the heterogeneity of the environment, caused by wind-roughening and satellite system parameters (Martinis et al. Citation2009). Also because of the temporal heterogeneity of the backscattering of permanent water bodies, implying the temporal variability of the threshold (Martinis and Rieke Citation2015). Regardless of this, we fused the two resources for flood detection. As thresholds are defined for each image of the different orbits based on the observed distribution of pixel values and segmenting by minimizing the intra-class variance on two different homogeneous classes using an image histogram approach, we believe that the separation of flood and non-flood features would not be affected by the relative difference in threshold values.
Figure 7. Distribution of threshold values of the Sentinel-1 C-band GRD VV polarization images for the period 2016–2021 (n = 55).
3.3. Validation results
The binarization for separating water and land was evaluated using the confusion matrix in GEE. The binarization was achieved with 95% overall accuracy and 0.90% Kappa coefficient. The producer’s and user’s accuracies for both water and land were greater than 93% (). This accuracy assessment assures a high level of accuracy acceptable for mapping flood inundation. As is depicted in , a few (4%) water test points were wrongly assigned to land and 7% of land test points were wrongly assigned to water, signifying a low level of confusion between the two classes. How well water is separated from land is presented in for visual interpretations.
Figure 8. Binarized Sentinel-1 images of a few dates that fully cover Dar es Salaam in 2021. The randomly generated validation points are included in the last map.
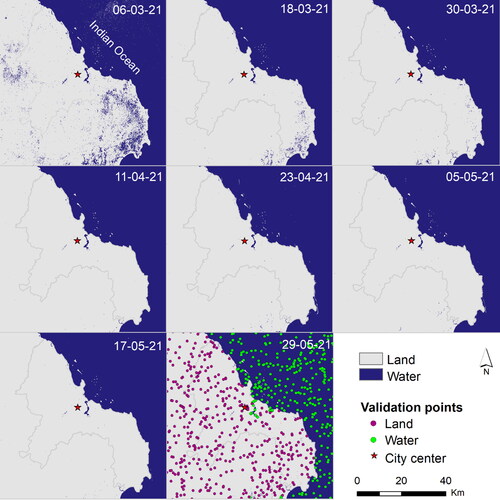
Table 1. Accuracy assessment result of the binarization of water and land.
3.4. Flooding occurrence and frequency
Flood inundation, be it from streams or overland flow affects every part of the city and varies from year to year (). Over the last six years, Dar es Salaam has experienced flood inundation that covers on average up to 50 km2 per flood event in March 2019 and 2021 (). In these years, large flooded areas are detected in March ranging from 6–200 km2 in total, with almost equal inundated areas in May and April. Flood records from other sources indicate also that flood inundation in the region is experienced in March, April and May (). Reportedly, the flood events in 2016 took place in January, a season with little rainfall. In the reports, flooding has also been experienced in October 2020, which is reportedly a season of no or little rainfall. Most of the dates given in the reports are a range of days within which flooding might have happened. In total only 13 flooding hazards are reported from 2014–2021. This may imply that all flood events in various parts of the Dar es Salaam region that might not have caused serious damage were not reported.
Figure 9. Flooded areas in Dar es Salaam in 2021, presented as representatives.
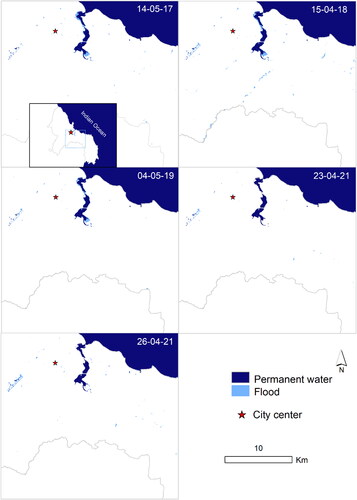
Table 2. Flood inundated areas (km2) in Dar es Salaam (2016–2021).
Table 3. Historical flood records in Dar es Salaam region reported from various sources (source: FloodList – https://floodlist.com/?s=dar+es+salaam&submit=).
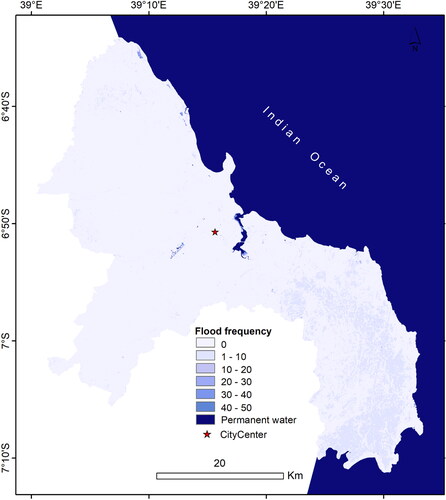
The flood frequency map in shows that the most frequently flooded areas (>20 times since 2016) are located near inland water bodies, and along the peripheries of the Indian Ocean. Some spot areas in the central part of the city are also subject to frequent flood inundation. Except for those areas that are nearby inland water bodies, the figure also shows that there is no clear spatial pattern in flooding frequency. Along the shorelines, most narrow stretches that are included in the city administration are frequently inundated. They are flooded for more than 20 times in the observation years starting from 2016. Less urbanized areas (), particularly, in the southern and southeastern parts of the city administration show widespread flooding on 06 March 2021 unlike the most urbanized areas in the northern section of the city. Flood inundations along roads and rivers were not detected due to the low resolution of the Sentinel-1 images compared mainly to the width of roads and rivers.
Figure 10. Flood frequency in Dar es Salaam from 2016–2021 rainy seasons.
3.5. Flood inundation under different land cover types
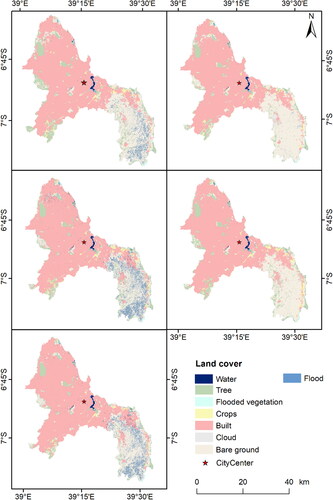
We assessed the flood inundation condition under different land cover types in Dar es Salaam region since 2017 using the flood data obtained from Sentinel-1 images and ESRI land cover data. As the data show in and , bare ground and built areas are widely inundated as compared to other land cover types. Actually, the size of these land cover types is larger than the rest and it is highly probable that they are affected by flood inundation. More than 35% of the areas of bare ground, flooded vegetation, and areas around water bodies are inundated by floods in Dar es Salaam ().
Figure 11. Flood inundation under different land cover types.
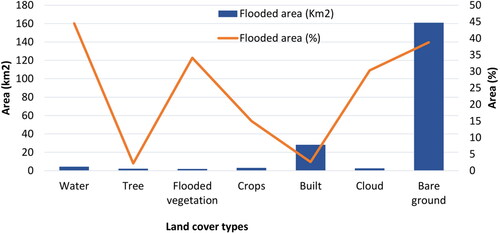
Figure 12. Spatial distribution of flood inundation in relation to different land cover types.
4. Discussion
4.1. Sentinel-1 and GEE as potential resources for flood monitoring
As indicated in , one of the concerns in remote sensing techniques for flood mapping and monitoring is the constraint related to orbital cycles and temporal and spatial gaps between satellite footprints. The Sentinel-1 satellites provide nominal 6-day repeat imagery over Europe with both the Sentinel-1A and B operating together making images available at 2–3 days temporal resolution, and a nominal 12-day repeat imagery over the rest of the globe enabling regular monitoring of flooding (ESA Citation2021). In view of the short lifetime and quick effect of flooding, Sentinel-1 images are not frequent for urban flood monitoring in tropical areas, such as Dar es Salam (). Nevertheless, considering the absence of sufficient in situ and remote sensing data at a finer temporal and spatial resolution, the availability of Sentinel-1 imagery is an option for flood mapping and monitoring (Torres et al. Citation2012; DeVries et al. Citation2020). There are some successful studies regarding the use of Sentinel-1 images for flood detection (Mason et al. Citation2014; Li et al. Citation2019). However, some of them were a onetime event flood detection supported by known flood occurrences by analyzing the before and after event changes (Long et al. Citation2014; Psomiadis Citation2016; Notti et al. Citation2018; Mason et al. Citation2021). Studies by Pelich et al. (Citation2022) used the InSAR coherence data to detect urban flooding using Sentinel-1 images. The study evaluated the contribution of co-polarization and cross-polarizations in detecting the presence of floodwater in urbanized areas. However, these studies did not use the GEE as a potential source of data and processing. The use of GEE to perform computing in the cloud enhances a simplified use of Sentinel-1 images for flood monitoring in Sub-Saharan African urban regions and their surroundings like Dar es Salaam where data and processing tools are main problems (Notti et al. Citation2018; DeVries et al. Citation2020). Some studies have also indicated the suitability of GEE for a wide range of land and inland water applications at a larger area coverage (Pradhan et al. Citation2018; DeVries et al. Citation2020; Mullissa et al. Citation2021; Liu et al. Citation2022).
4.2. Problems of detecting floods
Even though Sentinel-1 data can provide reasonable estimates of flooded areas, the challenge continues due to complexities in SAR backscatter as a function of reflection mechanisms of different features (DeVries et al. Citation2020). In Dar es Salaam, separation of flooded areas from smooth surfaces, such as airports (e.g. the Julius Nyerere airport at the city center in Dar es Salaam) and other pavements that are more than double wider than the resolution of the Sentinel-1 images (10 m) were difficult (). Flood inundations in roads and other pavements were not possible to detect using the Sentinel-1 images in Dar es Salaam. For pixels to fully represent roads and other pavements in the city, they have to be at least one-half the diameter of the target object (Myint et al. Citation2011). As the roads are narrow, detecting inundated roads and streets requires images with pixel resolutions significantly finer than the road width, which is unlikely in Dar es Salaam (Curran and Atkinson Citation1999; Giustarini et al. Citation2013; Hill et al. Citation2014; Zhang et al. Citation2021).
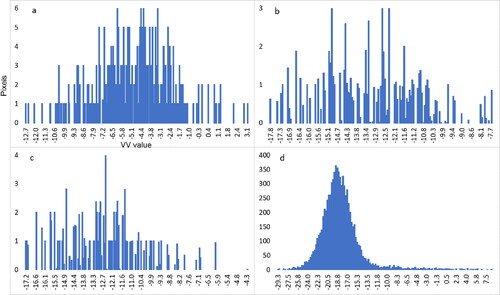
Flood inundations in and around the rivers in Dar es Salaam were not detectable. Surface reflectance spectra of flooded areas/rivers may be confused with built-up features and thus separating these features regardless of their width. As Brown and Chanson (Citation2012) reported, it could be because urban flood water carries sediments and other materials washed out from cities and surrounding areas t causing increase in backscatter signal amplitude. This issue needs further investigation in future studies. To strengthen the argument, we analyzed the backscatter from builtup, channelbed, floodplain, and waterbody by taking four sample areas in Mbezi river (). The mean VV values for builtup (-5.09 ± 2.68), channelbed (-7.5 ± 2.34), floodplain (-12.45 ± 2.6) are far from waterbody (-18.17 ± 3.44) implying high backscattering due to suspended materials in Mbezi river.
Figure 13. Histogram of VV backscatter values for builtup (a), channelbed (b), floodplain (c), and waterbody (d).
In addition, due to the complexity of urban environment and scattering from buildings, signals from water surfaces that reach the SAR sensor might be affected by noises that exaggerate signal strength (Meyer Citation2019; Frolking et al. Citation2022). Noise-like speckles are major problem of SAR images; SAR images with 5–10 m resolution are subject to speckles and surrounding strong scatters from buildings or other features for detecting flooding in narrow flood plains (Gomez et al. Citation2019). This adds to the difficulty of precisely separating flooded areas from other urban features. Therefore, developing methods that reduce the effect of scattering from buildings and other urban features may help to optimize the use of Sentinel-1 images for flood monitoring in complex urban environment. The look angle of the SAR sensors also has effects on the variation of the Sentinel-1A and B images. Schmidt et al. (Citation2020) evaluated the radiometric performance of Sentinel-1A and B for different target types covering a wide backscatter range from point targets with a high signal-to-noise ratio to distributed targets like rainforest, ice area, and calm waters with medium or low signal-to-noise ratio values. They confirmed that the look angle difference between Sentinel-1A and B images have effects on the backscatter intensity. For low backscatter targets, such as ice and calm waters targets higher backscatter differences were found. For these targets, Sentinal-1B shows systematically lower radar brightness compared to S-1A.
4.3. Flood occurrence and pattern in Dar es Salaam
In this study, most of the areas that are subjected to frequent flooding are found close to inland water bodies and the ocean shores. Though less frequently, built, flooded vegetation areas, and the lowlands and less urbanized bare ground areas in the southeastern parts of Dar es Salaam are also flooded (). This is one part of the city where settlement has been growing continuously since the end of the 1990s (Hill et al. Citation2014). Rapid urbanization in the city coupled with unplanned land use might have led to widespread settlement on environmentally fragile areas, such as flood plains and wetlands that are frequently flooded by stream or overland flow (Mitchell Citation2013; Mguni et al. Citation2016). Even though recent studies show that the Msimbazi River is one of the sources of flood inundation in Dar es Salaam city center (Rentschler et al. Citation2019), the Sentinel-1 based analysis does not prove this. This might be related to, in addition to the low resolution of the Sentinel image, the confusion in backscatter of floodwater and built-up features (Frolking et al. Citation2022) (). Further studies are required to develop state-of-the-art techniques for flood detection in complex urbanized environments that are scalable and transferable.
One of the challenges as regards the flood detection using the Sentinel-1 images and the reported flood events in the Dar es Salaam region is temporal compatibility. The sentinel images were not available for many of the dates when flooding was reported. Only a few flood records overlap with the capture dates of the Sentinel-1 images. Due to the time gap in the Sentinel-1 scenes, filling up the gap with reported flood events would be recommended for a better flood monitoring and decision making.
5. Conclusion
The Sentinel-1 SAR data was used to map and monitor flooding in Dar es Salaam since 2016. Considering the absence of data, such as high-resolution SAR data and ground measurements due to their high cost and unaffordability by Sub-Saharan African poor economies, the free access Sentinel-1 imageries were considered as good options for flood mapping and monitoring. As evaluated by this study, the open-source GEE cloud-computing platform has simplified the analysis of the Sentinel-1 images for mapping and monitoring urban flooding in Dar es Salaam. Hence, the open access Sentinel-1 images coupled with the powerful cloud computing GEE platform makes flood mapping and monitoring easier and this approach is scalable and can be applied to other African urban regions. It is advantageous economically and in terms of multi-temporal flood mapping, monitoring, and flood disaster management. This study investigated flooding at urban regional scale and did not go deep into the complex urban environment. Therefore, we recommend further studies to develop state of the art methods that would dive into detecting flooding in city centers and deal with reducing the backscatter reflectance from water bodies that come due to the scattering effects of buildings and other urban features. Moreover, developing methods that could integrate Sentinel-1 with other remote sensing data could be solutions. We also recommend a comprehensive study that incorporates Sentinel-1 images, measured flooding records, and a participatory approach that involves communities for an integrated disaster management and planning. Due to the anomaly experienced by Sentinel-1B on 23 December 2021, accessing a coupled Sentinel-1 images is not possible from this date on. This will have an impact on future flood monitoring.
Authors’ contributions
All authors contributed to the study conception and design. Material preparation, data extraction and analysis were performed by Biadgilgn Demissie. The first draft of the manuscript was written by Biadgilgn and all co-authors have revised the draft critically by adding new inputs. All authors read and approved the final version to be published and to be accountable for all aspects of the work.
Acknowledgements
The authors pass our gratitude to Universite Libre De Bruxelles (ULB), Brussels, Belgium for the postdoctoral grant support given to the first author. The authors are grateful for the team in Geospatial Analysis (ANAGEO) of ULB for the good working environment and discussions related to this paper and other issues. From this team, the authors would like to acknowledge Nicholus Mboga and Stefanos Georganos for their contributions as part of the discussions.
Disclosure statement
On behalf of all co-authors, the corresponding author states that there is no conflict of interest
Availability of data and materials
Data are available and can be provided when required.
Code availability
Data were processed using the GEE cloud computing. The GEE codes can be available after accepted for publication.
References
- Adedeji O, Olusola A, Babamaaji R, Adelabu S. 2021. An assessment of flood event along Lower Niger using Sentinel-1 imagery. Environ Monit Assess. 193(12):1–17.
- Adiri Z, El Harti A, Jellouli A, Lhissou R, Maacha L, Azmi M, Zouhair M, Bachaoui EM. 2017. Comparison of Landsat-8, ASTER and Sentinel 1 satellite remote sensing data in automatic lineaments extraction: a case study of Sidi Flah-Bouskour inlier, Moroccan Anti Atlas. Adv Sp Res. 60(11):2355–2367.
- Ahmed T. 2021. Monitoring and mapping of flash flood of Patna city using Sentinel-1 images: a case of India’s most flood prone state. Acad Lett. 2. https://doi.org/10.20935/AL1349
- Anande DM, Luhunga PM. 2019. Assessment of socio-economic impacts of the December 2011 flood event in Dar es Salaam, Tanzania. Atmos Clim Sci. 9(03):421.
- Andaya AE, Arboleda ER, Andilab AA, Dellosa RM. 2019. Meat marbling scoring using image processing with fuzzy logic based classifier. Int J Sci Technol Res. 8(08):1442–1445.
- Arboleda ER, De Jesus CLT, Tia LMS. 2021. Pineapple maturity classifier using image processing and fuzzy logic. IJ-AI. 10(4):830.
- Baghermanesh SS, Jabari S, McGrath H. 2021. Urban flood detection using Sentinel1-A images. International Geoscience and Remote Sensing Symposium. IEEE; p. 527–530.
- Bauer-Marschallinger B, Freeman V, Cao S, Paulik C, Schaufler S, Stachl T, Modanesi S, Massari C, Ciabatta L, Brocca L, et al. 2018. Toward global soil moisture monitoring with Sentinel-1: Harnessing assets and overcoming obstacles. IEEE Trans Geosci Remote Sens. 57(1):520–539.
- Bergler E, Hertel V, Mrak V. 2021. Space-based technologies for effective flood management in urban Africa: benefits, challenges and potential solutions. Austria: Regional Academy on the United Nations.
- Bovolo F, Bruzzone L. 2007. A split-based approach to unsupervised change detection in large-size multitemporal images: application to tsunami-damage assessment. IEEE Trans Geosci Remote Sens. 45(6):1658–1670.
- Brown R, Chanson H. 2012. Suspended sediment properties and suspended sediment flux estimates in an inundated urban environment during a major flood event. Water Resour Res. 48(11). https://doi.org/10.1029/2012WR012381
- Callaghan TV, Kulikova O, Rakhmanova L, Topp-Jørgensen E, Labba N, Kuhmanen L-A, Kirpotin S, Shaduyko O, Burgess H, Rautio A, et al. 2020. Improving dialogue among researchers, local and indigenous peoples and decision-makers to address issues of climate change in the North. Ambio. 49(6):1161–1178.
- Cherif I, Ovakoglou G, Alexandridis TK, Mensah F, Garba I. 2021. Near real time high resolution mapping of flood extent in west African sites. EGU General Assembly Conference Abstracts. Viena; p. EGU21–15170.
- Chini M, Hostache R, Giustarini L, Matgen P. 2017. A hierarchical split-based approach for parametric thresholding of SAR images: flood inundation as a test case. IEEE Trans Geosci Remote Sens. 55(12):6975–6988.
- Congalton RG, Green K. 2019. Assessing the accuracy of remotely sensed data: principles and practices. Boca Raton: CRC Press.
- Curran PJ, Atkinson PM. 1999. Issues of scale and optimal pixel size. In Spatial statistics for remote sensing. Dordrecht: Springer; p. 115–133.
- DeVries B, Huang C, Armston J, Huang W, Jones JW, Lang MW. 2020. Rapid and robust monitoring of flood events using Sentinel-1 and Landsat data on the Google Earth Engine. Remote Sens Environ. 240:111664.
- Donchyts G, Baart F, Winsemius H, Gorelick N, Kwadijk J, Van De Giesen N. 2016. Earth’s surface water change over the past 30 years. Nature Clim Change. 6(9):810–813.
- Dooley CA, Leasure DR, Tatem AJ. 2020. Gridded maps of building patterns throughout sub-Saharan Africa, version 1.1. Southampton, UK: University of Southampton.
- Dubey AK, Arora R, Ahmed A. 2017. A comparative review of various segmentation methods and its application. International Conference on Reliability, Infocom Technologies and Optimization (Trends and Future Directions). IEEE; p. 645–650.
- ESA. 2021. Sentinel-1 observation scenario. Available online [Internet]; [accessed 2021 Nov 16]. https://sentinels.copernicus.eu/web/sentinel/missions/sentinel-1/.
- Filgueiras R, Mantovani EC, Althoff D, Fernandes Filho EI, Cunha Fd. 2019. Crop NDVI monitoring based on sentinel 1. Remote Sens. 11(12):1441.
- Frolking S, Milliman T, Mahtta R, Paget A, Long DG, Seto KC. 2022. a global urban microwave backscatter time series data set for 1993–2020 using ERS, QuikSCAT, and ASCAT data. Sci Data. 9(1):1–12.
- Gagnon L, Jouan A. 1997. Speckle filtering of SAR images: a comparative study between complex-wavelet-based and standard filters. In Wavelet Applications in Signal and Image Processing V. Vol. 3169. SPIE; p. 80–91.
- Giustarini L, Hostache R, Matgen P, Schumann GJ-P, Bates PD, Mason DC. 2013. A change detection approach to flood mapping in urban areas using TerraSAR-X. IEEE Trans Geosci Remote Sens. 51(4):2417–2430.
- Gomez L, Ospina R, Frery AC. 2019. Statistical properties of an unassisted image quality index for SAR imagery. Remote Sens. 11(4):385–400.
- Hambati H, Gaston G. 2015. Revealing the vulnerability of urban communities to flood hazard in Tanzania: a case of the Dar es Salaam city ecosystem. Int J Geospat Environ Res. 2(1):3–25.
- Hill A, Hühner T, Kreibich V, Lindner C. 2014. Dar es Salaam, megacity of tomorrow: informal urban expansion and the provision of technical infrastructure. In: Megacities. Dordrecht: Springer; p. 165–177.
- Huang D, Xu S, Sun J, Liang S, Song W, Wang Z. 2017. Accuracy assessment model for classification result of remote sensing image based on spatial sampling. J Appl Remote Sens. 11(04):1.
- Iqbal MA, Talukder KH. 2020. Detection of potato disease using image segmentation and machine learning. 2020 International Conference on Wireless Communications Signal Processing and Networking. IEEE; p. 43–47.
- Kabanda T. 2020. GIS modeling of flooding exposure in Dar es Salaam coastal areas. Afr Geogr Rev. 39(2):134–143.
- Kaplan G, Avdan U. 2018. Monthly analysis of wetlands dynamics using remote sensing data. IJGI. 7(10):411.
- Kebede AS, Nicholls RJ. 2012. Exposure and vulnerability to climate extremes: population and asset exposure to coastal flooding in Dar es Salaam, Tanzania. Reg Environ Change. 12(1):81–94.
- Kikwasi G, Mbuya E. 2019. Vulnerability analysis of building structures to floods: the case of flooding informal settlements in Dar es salaam, Tanzania. Int J Build Pathol Adapt. 37(5):629–656.
- Kittler J, Illingworth J. 1986. Minimum error thresholding. Pattern Recognit. 19(1):41–47.
- Krishan Kumar A, Kaushal Kumar A, Guo S. 2020. Two viewpoints based real‐time recognition for hand gestures. IET Image Process. 14(17):4606–4613.
- Landuyt L, Van Wesemael A, Schumann GJ-P, Hostache R, Verhoest NEC, Van Coillie FMB. 2019. Flood mapping based on synthetic aperture radar: an assessment of established approaches. IEEE Trans Geosci Remote Sens. 57(2):722–739.
- Lee J-S. 1980. Digital image enhancement and noise filtering by use of local statistics. IEEE Trans Pattern Anal Mach Intell. 2(2):165–168.
- Lee J-S, Grunes MR, De Grandi G. 1999. Polarimetric SAR speckle filtering and its implication for classification. IEEE Trans. Geosci. Remote Sens. 37(5):2363–2373.
- Lee J-S, Wen J-H, Ainsworth TL, Chen K-S, Chen AJ. 2008. Improved sigma filter for speckle filtering of SAR imagery. IEEE Trans Geosci Remote Sens. 47(1):202–213.
- Li C, Dash J, Asamoah M, Sheffield J, Dzodzomenyo M, Gebrechorkos SH, Anghileri D, Wright J. 2022. Increased flooded area and exposure in the White Volta river basin in Western Africa, identified from multi-source remote sensing data. Sci Rep. 12(1):1–13.
- Li H-C, Celik T, Longbotham N, Emery WJ. 2015. Gabor feature based unsupervised change detection of multitemporal SAR images based on two-level clustering. IEEE Geosci. Remote Sens Lett. 12(12):2458–2462.
- Li Y, Martinis S, Wieland M, Schlaffer S, Natsuaki R. 2019. Urban flood mapping using SAR intensity and interferometric coherence via Bayesian network fusion. Remote Sens. 11(19):2231.
- Lin Y-T, Yang M-D, Han J-Y, Su Y-F, Jang J-H. 2020. Quantifying flood water levels using image-based volunteered geographic information. Remote Sens. 12(4):706.
- Liu J, Freudenberger D, Lim S. 2022. Mapping burned areas and land-uses in Kangaroo Island using an object-based image classification framework and Landsat 8 Imagery from Google Earth Engine. Geomat Nat Hazards Risk. 13(1):1867–1897.
- Long S, Fatoyinbo TE, Policelli F. 2014. Flood extent mapping for Namibia using change detection and thresholding with SAR. Environ Res Lett. 9(3):035002.
- Lopes A, Nezry E, Touzi R, Laur H. 1990. Maximum a posteriori speckle filtering and first order texture models in SAR images. 10th Annual International Symposium on Geoscience and Remote Sensing. IEEE; p. 2409–2412.
- Lu C-H, Ni C-F, Chang C-P, Yen J-Y, Chuang RY. 2018. Coherence difference analysis of sentinel-1 SAR interferogram to identify earthquake-induced disasters in urban areas. Remote Sens. 10(8):1318.
- Lu J, Giustarini L, Xiong B, Zhao L, Jiang Y, Kuang G. 2014. Automated flood detection with improved robustness and efficiency using multi-temporal SAR data. Remote Sens Lett. 5(3):240–248.
- Martinis S, Rieke C. 2015. Backscatter analysis using multi-temporal and multi-frequency SAR data in the context of flood mapping at River Saale, Germany. Remote Sens. 7(6):7732–7752.
- Martinis S, Twele A, Voigt S. 2009. Towards operational near real-time flood detection using a split-based automatic thresholding procedure on high resolution TerraSAR-X data. Nat Hazards Earth Syst Sci. 9(2):303–314.
- Mason DC, Dance SL, Cloke HL. 2021. Floodwater detection in urban areas using Sentinel-1 and WorldDEM data. J Appl Remote Sens. 15(3):32003.
- Mason DC, Giustarini L, Garcia-Pintado J, Cloke HL. 2014. Detection of flooded urban areas in high resolution Synthetic Aperture Radar images using double scattering. Int J Appl Earth Obs Geoinf. 28:150–159.
- Matgen P, Hostache R, Schumann G, Pfister L, Hoffmann L, Savenije HHG. 2011. Towards an automated SAR-based flood monitoring system: lessons learned from two case studies. Phys Chem Earth, Parts A/B/C. 36(7–8):241–252.
- Meyer F. 2019. Spaceborne Synthetic Aperture Radar: principles, data access, and basic processing techniques. In: SAR handbook: comprehensive methodologies for forest monitoring and biomass estimation. Huntsville: SERVIR Global Science Coordination Office National Space Science and Technology Center. p. 21–64.
- Mguni P, Herslund L, Jensen MB. 2016. Sustainable urban drainage systems: examining the potential for green infrastructure-based stormwater management for Sub-Saharan cities. Nat Hazards. 82(S2):241–257.
- Mitchell SA. 2013. The status of wetlands, threats and the predicted effect of global climate change: the situation in Sub-Saharan Africa. Aquat Sci. 75(1):95–112.
- Montalti R, Solari L, Bianchini S, Del Soldato M, Raspini F, Casagli N. 2019. A Sentinel-1-based clustering analysis for geo-hazards mitigation at regional scale: a case study in Central Italy. Geomatics, Nat Hazards Risk. 10(1):2257–2275.
- Moser G, Angiati E, Serpico SB. 2007. Multiscale unsupervised change detection by Markov random fields and wavelet transforms. In: Image and signal processing for remote sensing XIII. Vol. 6748. Florence, Italy: SPIE; p. 31–39.
- Mullissa A, Vollrath A, Odongo-Braun C, Slagter B, Balling J, Gou Y, Gorelick N, Reiche J. 2021. Sentinel-1 sar backscatter analysis ready data preparation in google earth engine. Remote Sens. 13(10):1954.
- Munawar HS, Hammad AWA, Waller ST. 2022. Remote sensing methods for flood prediction: a review. Sensors. 22(3):960.
- Myint SW, Gober P, Brazel A, Grossman-Clarke S, Weng Q. 2011. Per-pixel vs. object-based classification of urban land cover extraction using high spatial resolution imagery. Remote Sens Environ. 115(5):1145–1161.
- Nikaein T, Iannini L, Molijn RA, Lopez-Dekker P. 2021. On the value of sentinel-1 insar coherence time-series for vegetation classification. Remote Sens. 13(16):3300.
- Notti D, Giordan D, Caló F, Pepe A, Zucca F, Galve JP. 2018. Potential and limitations of open satellite data for flood mapping. Remote Sens. 10(11):1673.
- O’Donnell EC, Thorne CR, Yeakley JA, Chan FKS. 2020. Sustainable flood risk and stormwater management in blue‐green cities; an interdisciplinary case study in Portland, Oregon. J Am Water Resour Assoc. 56(5):757–775.
- Otsu N. 1979. A threshold selection method from gray-level histograms. IEEE Trans Syst Man Cybern. 9(1):62–66.
- Pelich R, Chini M, Hostache R, Matgen P, Pulvirenti L, Pierdicca N. 2022. Mapping floods in urban areas from dual-polarization InSAR coherence data. IEEE Geosci Remote Sens Lett. 19:1–5.
- Petersson L, Ten Veldhuis M-C, Verhoeven G, Kapelan Z, Maholi I, Winsemius HC. 2020. Community mapping supports comprehensive urban flood modeling for flood risk management in a data-scarce environment. Front Earth Sci. 8:304.
- Pradhan B, Moneir AAA, Jena R. 2018. Sand dune risk assessment in Sabha region, Libya using Landsat 8, MODIS, and Google Earth Engine images. Geomatics, Nat Hazards Risk. 9(1):1280–1305.
- Psomiadis E. 2016. Flash flood area mapping utilising SENTINEL-1 radar data. In: Earth resources and environmental remote sensing/GIS applications VII. Vol. 10005. Edinburgh: SPIE; p. 100051G.
- Pulvirenti L, Pierdicca N, Chini M, Guerriero L. 2011. An algorithm for operational flood mapping from Synthetic Aperture Radar (SAR) data using fuzzy logic. Nat Hazards Earth Syst Sci. 11(2):529–540.
- Ramiaramanana FN, Teller J. 2021. Urbanization and floods in sub-Saharan Africa: spatiotemporal study and analysis of vulnerability factors—case of antananarivo agglomeration (Madagascar). Water. 13(2):149.
- Refice A, Zingaro M, D’Addabbo A, Chini M. 2020. Integrating C-and L-band SAR imagery for detailed flood monitoring of remote vegetated areas. Water. 12(10):2745.
- Rentschler J, Braese J, Jones N, Avner P. 2019. Three feet under: the impact of floods on urban jobs, connectivity, and infrastructure.
- Sadek M, Li X. 2019. Low-cost solution for assessment of urban flash flood impacts using sentinel-2 satellite images and fuzzy analytic hierarchy process: a case study of ras ghareb city, Egypt. Adv Civ Eng. 2019:1–15.
- Sakijege T, Lupala J, Sheuya S. 2012. Flooding, flood risks and coping strategies in urban informal residential areas: the case of Keko Machungwa, Dar es Salaam, Tanzania. Jàmbá J Disaster Risk Stud. 4(1):1–10.
- Sarnacchiaro P, D’ambra A. 2007. Explorative data analysis and Catanova for ordinal variables: an integrated approach. J Appl Stat. 34(9):1035–1050.
- Schmidt K, Schwerdt M, Miranda N, Reimann J. 2020. Radiometric comparison within the Sentinel-1 SAR constellation over a wide backscatter range. Remote Sens. 12(5):854.
- Senthilnath J, Shenoy HV, Rajendra R, Omkar SN, Mani V, Diwakar PG. 2013. Integration of speckle de-noising and image segmentation using Synthetic Aperture Radar image for flood extent extraction. J Earth Syst Sci. 122(3):559–572.
- Series T, Bangira T, Iannini L, Menenti M, van Niekerk A, Vekerdy Z. 2021. Flood extent mapping in the Caprivi floodplain using Sentinel-1 time series.
- Shen X, Wang D, Mao K, Anagnostou E, Hong Y. 2019. Inundation extent mapping by synthetic aperture radar: a review. Remote Sens. 11(7):879.
- Tanguy M, Chokmani K, Bernier M, Poulin J, Raymond S. 2017. River flood mapping in urban areas combining Radarsat-2 data and flood return period data. Remote Sens Environ. 198:442–459.
- Tobias OJ, Seara R. 2002. Image segmentation by histogram thresholding using fuzzy sets. IEEE Trans Image Process. 11(12):1457–1465.
- Torres R, Snoeij P, Geudtner D, Bibby D, Davidson M, Attema E, Potin P, Rommen B, Floury N, Brown M, et al. 2012. GMES Sentinel-1 mission. Remote Sens Environ. 120:9–24.
- Twele A, Cao W, Plank S, Martinis S. 2016. Sentinel-1-based flood mapping: a fully automated processing chain. Int J Remote Sens. 37(13):2990–3004.
- Veloso A, Mermoz S, Bouvet A, Le Toan T, Planells M, Dejoux J-F, Ceschia E. 2017. Understanding the temporal behavior of crops using Sentinel-1 and Sentinel-2-like data for agricultural applications. Remote Sens Environ. 199:415–426.
- Vollrath A, Mullissa A, Reiche J. 2020. Angular-based radiometric slope correction for Sentinel-1 on google earth engine. Remote Sens. 12(11):1867.
- Watkiss P, Downing T, Dyszynski J, Pye S, Savage M, Goodwin J, Longanecker M, Lynn S. 2011. The economics of climate change in the United Republic of Tanzania. Global Climate Adaptation Partnership (GCAP).
- Woldai T. 2020. The status of Earth Observation (EO) & Geo-Information Sciences in Africa–trends and challenges. Geo Spatial Inf Sci. 23(1):107–123.
- Zhang H, Qi Z, Li X, Chen Y, Wang X, He Y. 2021. An urban flooding index for unsupervised inundated urban area detection using Sentinel-1 polarimetric SAR images. Remote Sens. 13(22):4511.
- Zhou S, Kan P, Silbernagel J, Jin J. 2020. Application of image segmentation in surface water extraction of freshwater lakes using radar data. IJGI. 9(7):424.