
 ?Mathematical formulae have been encoded as MathML and are displayed in this HTML version using MathJax in order to improve their display. Uncheck the box to turn MathJax off. This feature requires Javascript. Click on a formula to zoom.
Abstract
Landslide susceptibility analysis is an essential tool for landslide hazard management. Correlation analysis of the driving factors before landslide susceptibility analysis is crucial to obtain more accurate results and higher computational efficiency. This article presents an FR-weighted GeoDetector, which can, at different gridding scales, stably screen out the driving factors most relevant to historical landslides in the study area compared to the performance of the original GeoDetector. The correlation analysis result shows that the most relevant seven conditioning factors to historical landslides in the study area are: lithology, distance to road, elevation, slope, STI, SPI, and distance to faults. Four machine learning models (logistic regression [LR], random forest [RF], artificial neural network [ANN], and Xgboost) are implemented for landslide susceptibility analysis, demonstrating that such models can achieve higher accuracy with features filtered by the FR-weighted GeoDetector than with all features. The Xgboost models trained on seven and 12 features were used to generate landslide susceptibility maps. The overlay with historical landslides showed that the models trained on seven features generated a more reasonable landslide susceptibility map, proving that selecting crucial landslide conditioning factors is a better solution than using a full range of landslide conditioning factors.
1. Introduction
Landslides are among the most frequent geological disasters, greatly threatening people’s lives. Therefore, there is an urgent need to create an accurate landslide catalogue and thereby better enable a practical assessment of landslide risk.
Landslides are caused by the complex interaction of driving factors which can be divided into conditioning and triggering factors (Zêzere et al. Citation1999). Conditioning factors include slope, aspect, elevation, fault, lithology, drainage density, land use, soil, etc. Triggering factors include rainfall, earthquakes, and human intervention. Landslide susceptibility is the probability of spatial occurrence of known slope failures, given a set of geo-environmental conditions, assuming landslides will occur in the future because of the same conditions that produced them in the past (Younes Cárdenas and Erazo Mera Citation2016; Pourghasemi and Rahmati Citation2018).
Landslide susceptibility analysis, by the modelling methods, can be divided into heuristic, statistical, and deterministic models (Pourghasemi and Rahmati Citation2018). Among them, the heuristic model is highly subjective, and the expert experience presented brings strong uncertainty to the driving factor of the landslide (Reichenbach et al. Citation2018; Shano et al. Citation2020); the deterministic model aims to establish the physical relationship between the driving force and the resistance of the landslide (Liu YC and Chen Citation2007; Karaman et al. Citation2013; ZainAlabideen and Helal Citation2016; Raghuvanshi Citation2019), the latter requiring detailed information about lithological units, soil characteristics, slope geometry, and slope hydrological conditions. Hence, this model type only applies to small-scale study areas and cannot be generalized to a larger scale (Fall et al. Citation2006; Ghosh et al. Citation2009); statistical models are data-driven methods and require a complete historical landslide catalogue for modelling and evaluation.
Statistical models have recently become the ‘hotspot’ of landslide susceptibility analysis. The mostly used algorithms include, such as logistic regression (LR) (Ayalew and Yamagishi Citation2005; Bui et al. Citation2011; Lombardo and Mai Citation2018), frequency ratio (FR) (Yilmaz Citation2009; Youssef et al. Citation2016), artificial neural network (ANN) (Lee S et al. Citation2003; Poudyal et al. Citation2010; Shahri et al. Citation2019), and support vector machine (Yao et al. Citation2008; Lee S et al. Citation2017). However, before applying these statistical models, existing studies often selected conditioning factors based on researchers’ experience. Identifying the conditioning factors is one of the most critical and challenging tasks in landslide susceptibility analysis, for which there are no universal guidelines for selecting landslide conditioning factors (Kavzoglu et al. Citation2015). The different study area, not unexpectedly, has different geological backgrounds and climatic conditions. Any redundant and correlated driving factors not only affect the algorithm’s efficiency but also cause overfitting and a decrease in the accuracy of landslide susceptibility analysis which can be explained by the curse of the dimensionality or Hughes effect (Kavzoglu et al. Citation2015).
Many methods have been used to carry out the selection of landslide conditioning factors. Some studies tested several subsets of features in the same model to select the one providing the maximum accuracy (Guyon and Elisseeff Citation2003, Citation2006). Information gain ratio (IGR) quantifying feature importance based on information theory is a widely used factor selection technique (Tien Bui et al. Citation2016; Lee D-H et al. Citation2020). Genetic algorithm has also been employed for feature selection and optimization (Nourani et al. Citation2014; Kavzoglu et al. Citation2015; Li L et al. Citation2017). GeoDetector is used as a common method for feature selection in landslide susceptibility analysis because of its ability to detect both quantitative and categorical data (Yang et al. Citation2019; Xie et al. Citation2021; Zhou X et al. Citation2021; Cheng et al. Citation2022), demonstrating that feature selection can improve the accuracy of landslide susceptibility analysis. This article proposes a FR weighted (FR-weighted) GeoDetector to analyse the correlation between historical landslides and their driving factors. The main contributions are mainly threefold:
The proposed FR-weighted GeoDetector addresses two limitations of the original GeoDetector: a) the relative size of the q values, depending on the gridding scale for a group of conditioning factors in the study area, and b) the discretization of continuous conditioning factors, causing errors by affecting the description of the aggregation of historical landslide points under a specific gridding scale.
Correlation analysis of historical landslides in Hong Kong with their conditioning and triggering factors (rainfall) was carried out using the FR-weighted GeoDetector.
Four machine learning models for landslide susceptibility can achieve higher accuracy with features filtered by the FR-weighted GeoDetector than all features, demonstrating the necessity of feature screening in landslide susceptibility analysis.
2. Data and methodology
2.1. Study area
The study area, Hong Kong, China, located in the north of the tropics, has a climate mainly affected by monsoons, resulting in a distinct rainy summer season (May to mid-September) and a dry season in winter (November to February). Consequently, this area suffers landslide disasters, with an average of about 300 natural landslides annually. Due to the large seasonal rainfall and heavy soil weathering, rain-induced shallow landslides are the majority (Ko and Lo Citation2018).
On the other hand, population and the related new urban development have occurred on many of the territory’s slopes in recent years. Once a landslide occurs, life and property in these areas will likely be seriously affected, as the frequent occurrence of extreme weather and slope degradation are inevitable. In light of the above, Hong Kong is selected as the study area to analyse landslide susceptibility, which has great potential to be further applied to protect Hong Kong citizens’ life and property safety and ensure the city’s sustainable development.
Many relevant studies on landslide susceptibility analysis have taken Hong Kong as the study area. Early studies focused on assessing landslide susceptibility and slope instability using historical landslide inventories and conditioning factors based on simple statistical models and GIS. Dai and Lee (Citation2002) identified the physical parameters contributing to the initiation of landslides and incorporated them in a GIS-based logistic multiple regression model to obtain slope instability on Lantau Island. Chau et al. (Citation2004) presented a GIS-based framework for systematic landslide hazard analysis by employing historical landslide data in Hong Kong, coupling with geological, geomorphological, population, climatic, and rainfall data. As most landslides in Hong Kong were rainfall-induced, studies have been conducted to analyse and regress the relationship between rainfall and landslide events. Gao et al. (Citation2018) studied the relationship between terrain landslide magnitudes and triggering rainfall using landslide inventories and rainfall records from 1984 to 2013. More and more studies on landslide susceptibility analysis in Hong Kong have incorporated AI in recent years as data accessibility and computing power improve. Liu R et al. (Citation2022) introduced a CNN-based model, performing a landslide susceptibility analysis for Lantau Island. Wang H et al. (Citation2021) proposed an AI and object-based landslide susceptibility model and obtained a territory-wide landslide susceptibility map for Hong Kong.
2.2. Data
2.2.1. Landslide inventory maps
Almost all landslides in Hong Kong are associated with periods of high rainfall which is highly seasonal (Hencher and Lee Citation2010). Intense storms are to be anticipated from about April through to September, although storms sometimes occur outside that period and similarly cause extensive failures (Zhou C et al. Citation2002). Therefore, shallow landslides caused by erosion or shallow processes, such as cleft water pressures behind loose rock blocks are the most typical types of failure in Hong Kong and probably the most significant in terms of risk. They typically occur during or very shortly after severe rain storms (Hencher and Lee Citation2010).
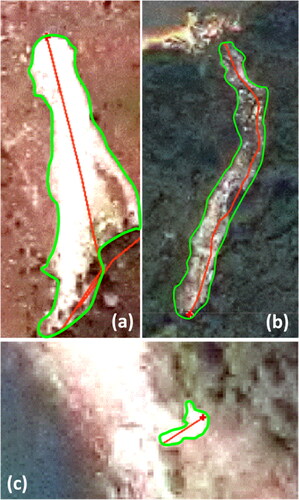
The landslide inventory data used in this study are from the Enhanced Natural Terrain Landslide Inventory, provided by the Hong Kong Civil Engineering and Development Department (https://data.gov.hk/sc-data/dataset/hk-cedd-csu-cedd-entli). The dataset records landslides as a point layer in Hong Kong from 1942 to 2019. The location, type, and year of the aerial photograph on which the landside was first observed are recorded in the attribute table. Landslides are classified into channelized debris flow, open hillslope landslides, and coastal landslides, as shown in .
Figure 1. Field photographs of different types of landslides: (a) open hillslope landslides; (b) channelized debris flow; (c) coastal landslides.
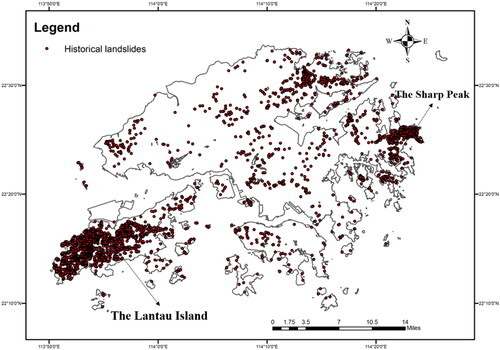
Historical landslides in Hong Kong are documented as a point layer, which recorded the apex of the landslide trajectory from 2006 to 2016, as shown in . The areas severely affected by the landslide are Lantau Island and Sharp Peak, with severe landslides in 2008, 2014, and 2016 respectively.
Figure 2. Historical landslides in Hong Kong from 2006 to 2016.
2.2.2. Landslide conditioning factors
The review (Reichenbach et al. Citation2018) summarized the landslide conditioning factors used in existing studies. They are grouped into five broad categories: Geological, Hydrological, Land cover, Morphological, and Others. Various factors such as geology, topography, and hydrology may influence rain-induced shallow landslides. Based on the literature review (Wang Q et al. Citation2015; Persichillo et al. Citation2017; Turconi et al. Citation2019; Lee D-H et al. Citation2020; Conforti and Ietto Citation2021), background knowledge on the study area and data availability, the 12 most common landslide conditioning factors were selected for this study. As shown in , landslide conditioning factors include i) continuous numeric variables, as listed in , and ii) categorical variables, such as land use and land cover (LULC) and lithology.
Figure 3. Landslide conditioning factors: (a) Aspect, (b) Curvature, (c) Distance to faults, (d) Distance to roads, (e) Elevation, (f) Lithology, (g) LULC, (h) NDVI, (i) Slope, (j) SPI, (k) STI, (l) TWI.
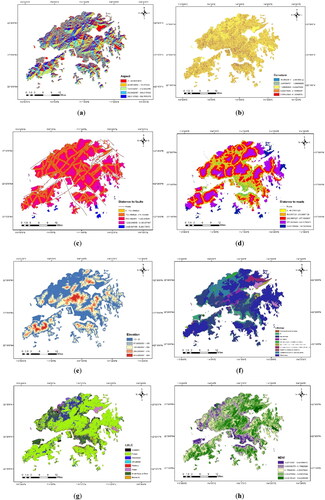
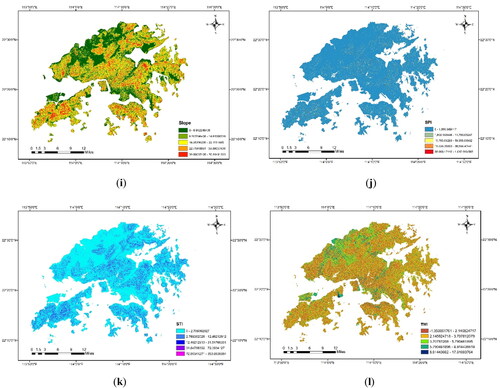
Table 1. Quantization level of conditioning factors.
Terrain factors
The terrain factors include elevation (), slope (), aspect (), and curvature (), all of which are generated from SRTM DEM data (https://dwtkns.com/srtm30m/) with a resolution of 30m. Among them, elevation and slope are important components of slope stability analysis. The aspect indirectly reflects the sunlight and weathering conditions of the slope and thus controls the soil moisture, a noted determinant of landslide occurrence (Bui et al. Citation2011). Curvature directly influences the speed of water flow, which controls erosion, affecting the occurrence of landslides (Duman et al. Citation2006). All terrain factors are classified using the Natural Breaks (Jenks) method.
Hydrological factors
Hydrological factors include Topographic Wetness Index (TWI), Stream Power Index (SPI), and Sediment Transport Index (STI). TWI () reflects the influence of spatial scale on hydrological processes. Water infiltration into slope soil increases pore water pressure and decreases soil strength. Therefore, the larger the TWI value, the greater the possibility of landslides in this area; SPI () measures the effect of confluence on the soil. The stronger the erosive force, the weaker the soil strength in the area and the more prone it is to landslide disasters; STI () describes the erosion and deposition process in the study area. The above three hydrological factors are all calculated from DEM data with a resolution of 30 m. All hydrological factors are classified using the Natural Breaks (Jenks) method.
Geological factor
The geology of Hong Kong is dominated by igneous rocks (including granite and volcanic rocks) formed during a major volcanic eruption in the Mesozoic, which accounts for 85% of the land area. The remaining 15% is composed of mainly sedimentary rocks located in the northeastern part of the New Territories, while a small number of metamorphic rocks are found in the New Territories, less than 1% (Sewell et al. Citation2000).
This article uses lithology and distance to faults to reflect the geological setting of the study area, as shown in . Because fracturing and shear levels are essential in determining slope failure (Varnes Citation1984). The lithology is directly extracted from the geological map of Hong Kong (downloaded from DATA.GOV.HK), and the distance to the fault is obtained by Euclidean distance analysis of the primary fault data in Hong Kong. The distance to fault is classified using the Natural Breaks (Jenks) method.
LULC
LULC is a dynamic factor associated with human activities. Deforestation, agricultural activities, and urban and rural construction increase weathering and erosion processes that ultimately increase the landslide susceptibility of the study area (Rabby et al. Citation2022). LULC data with 30 m resolution has been achieved by Tsinghua University (http://data.ess.tsinghua.edu.cn/), as shown in . The land cover data was generated in a machine-learning manner using Landsat Thematic Mapper (TM) and Enhanced Thematic Mapper Plus (ETM+) data (Gong et al. Citation2013). The study area contains eight land cover types: cropland, forest, grassland, shrub, water, impervious, bare land, and snow/ice.
NDVI
The Normalized Difference Vegetation Index (NDVI) reflects the vegetation density in the study area, as shown in . Vegetation roots significantly affect soil reinforcement, restraining surface soil erosion and shallow landslides (Huang R et al. Citation2005). The vegetation in the study area is mainly low shrubs, destroyed when rainfall-induced shallow landslides occur but can be restored quickly. Based on this fact, the NDVI was calculated using Landsat 7 images acquired in November 2006 and November 2011 and Landsat 8 images acquired in January 2016. the NDVI for the three years was averaged and used as a conditioning factor. All Landsat images are Level 2 data. The NDVI data is classified using the Natural Breaks (Jenks) method.
Distance to the road
The roadside section formed during road construction is usually prone to landslides (Ayalew and Yamagishi Citation2005). The distance to the road to the input model presented in this article is derived from the road network data (downloaded from DATA.GOV.HK) through Euclidean distance analysis, as shown in . The distance to the road is classified using the Natural Breaks (Jenks) method.
2.2.3. Landslide triggering factor
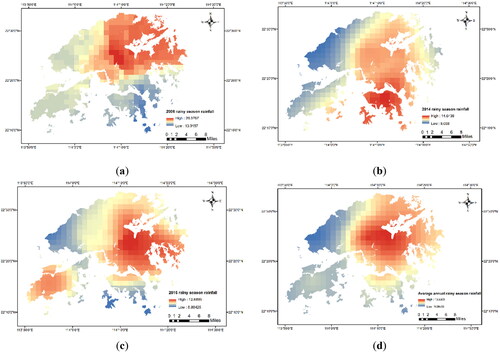
Landslides in Hong Kong are usually triggered by heavy rainfall, which is concentrated in the rainy season. Thus, showery season precipitation is selected as the triggering factor for this study. Annual rainfall data are collected for the three years (2008, 2014, and 2016) when significant landslides occurred. The rainfall raster data is interpolated using the Kriging method from GEO monthly rain gauge data provided by 86 rain gauge stations in the study area, as shown in . The selected three years of rainfall data is divided into five categories on a 2 km gridding scale, as shown in . In addition, annual mean precipitation for the rainy season 2006–2016 is calculated to examine its correlation with historical landslides in this decade.
Figure 4. Rain gauge station locations.
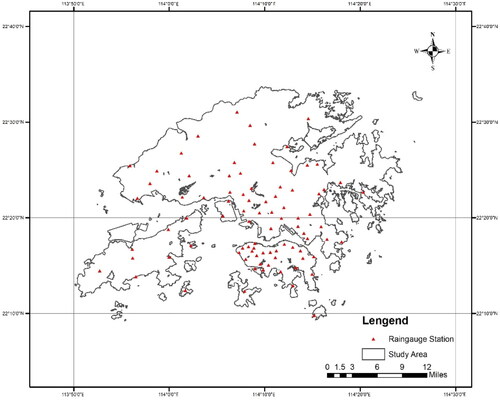
Table 2. Quantization level of rainy season rainfall.
2.2.4. Non-landslide point samples
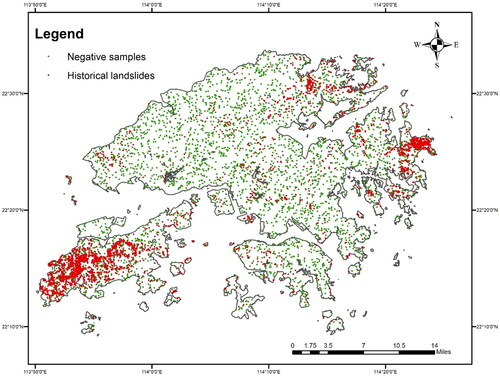
A sample selection strategy is proposed to collect non-landslide points, implemented by following steps: i) establishing a 100 m buffer zone for historical landslide points; ii) removing the buffer zone from the study area; and iii) generating the sample points within the scope of the excluded buffer zone randomly as non-landslide points, as shown in . The random non-landslide points and historical landslide points are first clustered. The random points falling into the same category as the historical landslide points are considered false negatives for rejection.
Figure 5. Historical landslides and negative samples.
2.3. Methodology
The landslide susceptibility analysis workflow proposed in this article is divided into three steps: (i) calculating q values for all 12 conditioning factors using FR-weighted GeoDetector; (ii) selecting seven conditioning factors with the highest q values (i.e. the strongest correlation with historical landslides) for analysis; and (iii) evaluating the accuracy of the landslide susceptibility analysis results.
2.3.1. GeoDetector
Selecting the driving factors with a high correlation with the historical landslides in the study area for landslide susceptibility analysis is crucial to the performance of the data-driven model (Huang F et al. Citation2021). Commonly used correlation analysis methods include the weight of evidence (WOE) (Chen L et al. Citation2019), information value (IV) (Achour et al. Citation2017), and probability statistics (PS) (Chen C-Y and Chang Citation2016), index of entropy (IOE) (Xu et al. Citation2020), and FR (Huang F et al. Citation2020). Compared to these methods, GeoDetector has a clear physical meaning and has fewer assumptions about the data, which can quantitatively describe the correlation between latent factors and geographic phenomena (Wang J et al. Citation2010). The core idea of GeoDetector can be stated as follows: if an independent variable has an important influence on a dependent variable, it should have a similar spatial distribution to the dependent variable. The study area regarding the landslide problem is divided into grid cells; the number of historical landslide points in each cell is the dependent variable, and the landslide driving factors corresponding to the cell are independent variables. This spatial distribution similarity can be measured by the ratio of the local variance to the global variance, the q value:
#(1)
#(1)
where
is the number of categories of a driving factor after discretization,
is the total number of grid cells in the study area,
is the intra-class variance of the
driving factor, and
is the overall variance of the driving factor in the entire study area. The larger the q value, the greater the number of landslides the factor can explain and, thus, the stronger the correlation with the historical landslides.
2.3.2. Frequency ratio weighted GeoDetector
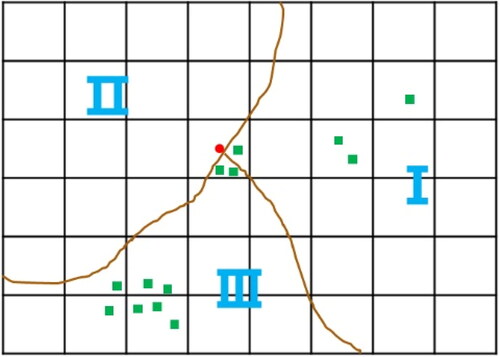
The GeoDetector has the advantage of fewer assumptions about the data and clear physical meaning. However, it is still limited by: (i) the relative size of the q values, depending on the gridding scale for a group of conditioning factors in the study area, and (ii) the discretization of continuous conditioning factors, causing errors by affecting the description of the aggregation of historical landslide points under a specific gridding scale. As shown in , Category I, II, and III represent the discretization of a conditioning factor. Subsequently, the central grid belongs to Category II, and the corresponding number of landslide points in the grid is 3. However, and importantly, there are no landslide points in Category II.
Figure 6. Schematic of discretization of continuous driving factors.
To solve this problem, this article weights the FR of traditional geographic detectors:
#(2)
#(2)
where is the number of categories of a driving factor after discretization,
is the total number of grid cells in the study area,
is the intra-class variance of the
driving factor,
is the FR of the
class,
is the weighted variance of the driving factor in the entire study area. If the
class has no spatial heterogeneity at all, then:
#(3)
#(3)
That is, for Category II without historical landslide points, the FR which means that regardless of whether any landslide points fall into this category due to the gridding process, Category II will not explain any landslides. Thus, the error caused by the gridding scale can be eliminated.
2.3.3. Multicollinearity test
A multicollinearity problem means that a change in one explanatory variable causes another change. When severe multicollinearity occurs, it can lead to unstable analysis results, with the sign of the regression coefficients being exactly opposite to reality (Liu Q et al. Citation2021). Therefore, it is essential to carry out a multicollinearity test before landslide susceptibility analysis (Li Y et al. Citation2020). There are several methods to detect multicollinearity. One commonly used method is the variance inflation factor (VIF) value, which is expressed as:
where is the correlation coefficient with the other landslide conditioning factors. Tolerance which is the reciprocal of VIF, is also often used as an indicator to detect multicollinearity. The larger the VIF value, the more severe the multicollinearity.
2.3.4. Statistical model for landslide susceptibility mapping
Four machine learning models are implemented in this study to conduct landslide susceptibility analysis demonstrating the effectiveness of feature screening. Their principles are briefly described below.
Logistic regression (LR)
LR is the most common technique for predicting landslide susceptibility (Goetz et al. Citation2015), used to establish the relationship between the target variable and multiple predictors, to obtain the probability of an event occurring. The formula is as follows:
where is a constant,
is the coefficient, and
is the number of predictors (in this study it represents the number of conditioning factors).
Random forest (RF)
RF is an ensemble classifier widely used in landslide susceptibility, which has the advantage of being non-parametric and flexible (Chang et al. Citation2019). RF consists of many unrelated decision trees. Each time a new sample is presented as input, each decision tree is judged separately, and the final classification result is determined by voting. In regression problems, RF outputs the average of all decision tree outputs.
Artificial neural network (ANN)
The ANN aims to build a model of the data-generating process so that the network can generalize and predict outputs from inputs it has not previously seen (Lee S et al. Citation2003). In the application of landslide susceptibility analysis, the input layer of ANN is the landslide conditioning factor, the output layer is the landslide susceptibility result, and feature transformation is realized by adding hidden layers.
Xgboost
Xgboost is a boosting algorithm. Its idea is to continuously add trees and perform feature splitting to grow a tree to fit the residual of the last prediction. In the prediction stage, according to the characteristics of the sample, each tree will fall to a corresponding leaf node, each leaf node corresponds to a score, and finally add up the scores corresponding to each tree to obtain the predicted value of the sample (Chen T et al. Citation2015).
3. Result and discussion
3.1. Correlation analysis of landslide conditioning factors and landslides
This study proposes a solution to the problem that the original GeoDetector is sensitive to the gridding scale. Thus, the q value results obtained from GeoDetector and FR-weighted GeoDetector at 1, 2, and 5 km scales are used for comparison experiments to demonstrate the stability of the screening of features by FR-weighted GeoDetector.
As shown in and , the relative sizes of q values obtained by GeoDetector fluctuate at different grid scales. For example, the q value of STI is the maximum at 1 and 2 km scales, but the elevation has the strongest correlation with historical landslides at the 5 km scale. Similarly, the q value for the distance to faults is the minimum at the 1 km scale, but the aspect is the least correlated with historical landslides at the 2 and 5 km scales. Furthermore, the q value for the aspect is larger than that for distance to faults at the 1 km scale, but the conclusion is the opposite at the 2 km scale. However, as shown in , the results of the FR-weighted GeoDetector are much more stable, with the lithology having the most significant q values at each of the three scales and the minimum q values for LULC.
Figure 7. Comparison of the relative size of the q value, (a) for the GeoDetector, (b) for the FR-weighted GeoDetector.
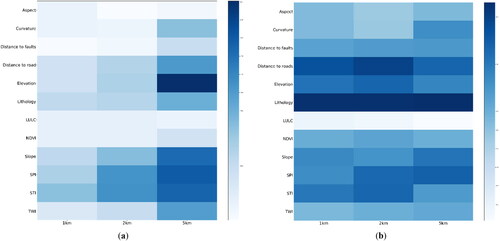
Table 3. The q value of FR-weighted GeoDetector (FRWGD) and GeoDetector (GD) at different scales.
3.2. Correlation analysis of rainfall and landslides
Rainfall is the most common cause of landslides, directly or indirectly (Brand et al. Citation1984). Over 74% of landslides occurred during the rainy season on average (2006–2016) in Hong Kong, which concentrates 80% of the annual rainfall. That means the rainfall intensity during the rainy season can be an important predictor of landslide risk. However, the spatial distribution of heavy rainfall varies during the annual rainy season, as shown in . Therefore, the analysis should be carried out by year to obtain a more accurate correlation between rainfall and landslides.
Figure 8. Rainfall intensity in the rainy seasons of 2008 (a), 2014 (b), and 2016 (c), respectively; (d) the annual average rainfall intensity in the rainy season from 2006 to 2016.
Correlation analysis requires the support of a large number of samples. Hence the four years with the most frequent landslides are selected. The q values of the 12 conditioning factors and one triggering factor (i.e. rainfall) are calculated using FR-weighted GeoDetector, respectively. In addition, as a comparative test, the average rainy season rainfall from 2006 to 2016 is used as a conditioning factor.
From the results in , it can be concluded that the q value for rainfall in each rainy season is significantly greater than the q value for the 10-year average annual rainfall, which indicates that the timeliness of the data needs to be fully considered if trigger factors are used as features in landslide susceptibility analysis.
Table 4. q Value of rainfall obtained by FR-weighted GeoDetector.
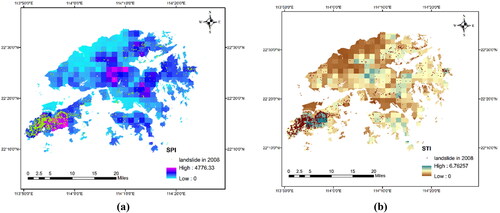
It should also be noted that hydrological factors can explain more landslides than rainfall. As shown in , SPI and STI strongly correlate with historical landslides in the corresponding years. For example, as shown in , the rainfall on Lantau Island is not the heaviest in the territory during the rainy season. Yet, a considerable number of landslides occurred here in 2008 (as shown in ). As shown in , Lantau Island has high STI and SPI values, which means that the area is more susceptible to erosion and sedimentation by runoff and more prone to landslides driven by rainfall.
Figure 9. SPI (a) and STI (b) after 2 km scale gridding.
3.3. Landslide susceptibility analysis
An additional comparative experiment demonstrates whether features screened by the FR-weighted GeoDetector can correctly distinguish landslide and non-landslide points. The selected sample points (4665 historical landslide points and 3961 non-landslide points) are classified at two scales (1 and 2 km) by using (i) all 12 landslide conditioning factors and (ii) the screened seven landslide conditioning factors, respectively.
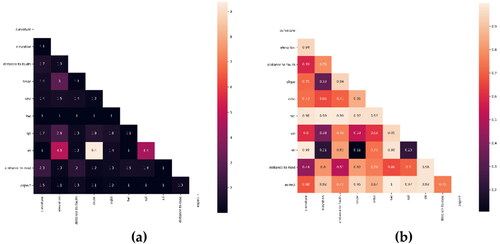
As shown in , the results of the multiple covariance test show that the minimum Tolerance is 0.11 and the maximum VIF is 9.4, both satisfying the critical values (Tolerance > 0.1, VIF < 10).
Figure 10. Multicollinearity test results, (a) for VIF, (b) for Tolerance.
Their performance is compared using the accuracy, F1 score, and area under curve (AUC). As shown in and , the 5 km gridding scale is too coarse, resulting in a decreased heterogeneity of the grids, leading to a more significant difference in the relative magnitude of q values for each conditioning factor at this scale compared to the other two scales. Therefore, the landslide susceptibility analysis experiments are only conducted at the 1 and 2 km scales. Four classifiers are implemented in this article: LR, RF, Xgboost, and ANN, to demonstrate the necessity of conditioning factor screening by FR-weighted GeoDetector. For each model, the training set is 80% of the sample, and the test set is 20% of the sample.
It can be seen from that the landslide susceptibility analysis using the seven features selected by the FR-weighted Detector is not any less accurate than using all 12 features, but the accuracy has improved. This shows that the original 12 features are redundant for the study area. In experiments using the screened features for landslide susceptibility analysis, the four classifiers show a 3–7% improvement in accuracy, a 2–5% improvement in F1 score, and a 2–7% improvement in AUC at the 2 km gridding scale compared to the 1 km gridding scale. In addition, by analysing the feature importance of the four machine learning algorithms, it can be found in that among all 12 features, lithology, SPI, and distance to roads contribute more to the classification process, which is consistent with the results of the FR-weighted GeoDetector in .
Figure 11. Feature importance at different gridding scales. (a), (b), (c) for 1, 2, and 5 km, respectively.
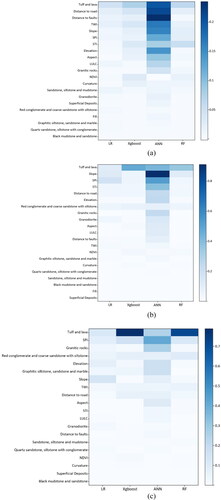
Table 5. Evaluation of the four statistical models.
Among the four models, the best-performing model is Xgboost, whose prediction results are used to generate the landslide susceptibility analysis map, as shown in . The landslide susceptibility is divided into five levels: very low, low, moderate, high, and very high. Where (a) is a landslide susceptibility map generated using 12 unscreened features and (b) is a landslide susceptibility map generated using seven features from the FR-weighted GeoDetector. In the Lantau and Sharp Peak areas, where landslides are more severe, both methods classify these two areas as high risk. The proportions of each susceptibility level zone differed under the two methods, as shown in . Combined with , it can be seen that the differences in susceptibility levels using different numbers of features are mainly concentrated on very low, low, and moderate. As can be seen in the detailed view, using the screened features allows some areas with relatively high concentrations of landslides to be classified as moderate. In contrast, when all features are used, these are classified as low risk demonstrating that feature filtering can improve landslide susceptibility mapping results.
Figure 12. Landslide susceptibility mapping result. (a) is generated using 12 features, (b) is generated using screened seven features.
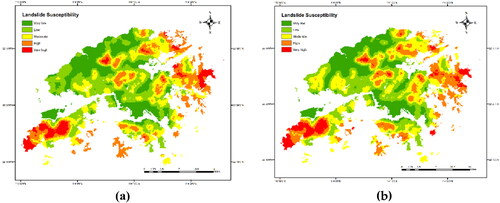
Table 6. Proportion of each susceptibility level zone.
We also tested the trained Xgboost model using an independent test sample of 603 landslides from 2018 to 2020, and 705 randomly generated negative sample points (generated in the same way as in Section 2.2). The accuracy assessment results are shown in , where the use of screened features improved in all three metrics compared to the use of all features. In addition, as shown in , the results of the landslide susceptibility maps generated using the screened seven features were more reasonable when historical landslides were overlaid with the landslide susceptibility maps in some areas where landslides were relatively clustered.
Figure 13. Detailed views of landslide susceptibility maps overlaid with historical landslides (2018–2020). (a) And (c) are generated using screened seven features, and (b) (d) are generated using unscreened 12 features.
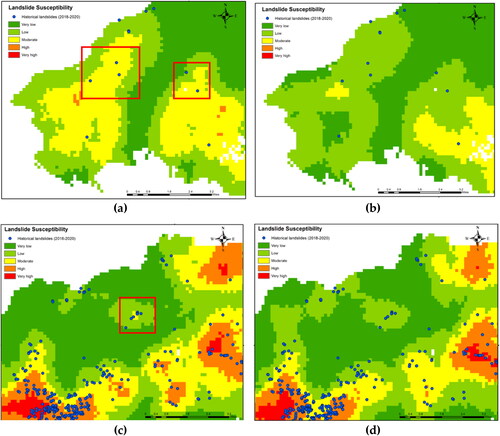
Table 7. Evaluation of Xgboost using test data (2018–2020 historical landslides).
Limitations of this study should be noted. First, not all historical landslides were involved in the feature screening and susceptibility analysis at the regional scale. Second, for feature screening, limited by the landslide inventory and conditioning factor data sources, we only used 12 conditioning factors that were appropriate for the study area; in other areas, more conditioning factors may need to be considered. Finally, the landslide susceptibility analysis presents only the spatial probability of landslides. Temporal probabilities have to be analysed to achieve more effective landslide hazard control. The assessment of the spatial and temporal probability of landslides (landslide hazard analysis) in combination with triggering factors will be a future research direction for this study.
4. Conclusions
Landslides in Hong Kong have had a significant impact on human lives and infrastructures and also have affected society and the economy. There are many driving factors, and existing studies on the landslide susceptibility analysis process usually use all commonly used driving factors. But too many features employed in classification may affect the efficiency and the accuracy of landslide susceptibility analysis. This is because different study areas have various geological profiles, hydrological conditions, and topographical features, and identifying critical features for analysis is the best solution.
This article proposes an FR-weighted GeoDetector to solve the problem that the existing GeoDetector is sensitive to the gridding scale. The FR-weighted GeoDetector can stably quantify the correlation between historical landslides and their conditioning factors in the study area at different gridding scales. The most relevant seven conditioning factors are identified to historical landslides in the study area. They are lithology, distance to road, elevation, slope, STI, SPI, and distance to faults. The article also analyses the correlation between historical landslides and rainfall using the proposed FR-weighted GeoDetector. Monthly rain gauge data and historical landslide catalogues are selected for 3 years (2008, 2014, and 2016) when landslides occurred frequently. The results show that the q values for the rainy season precipitation are higher than those for the average annual rainfall and some commonly used static topographic features (e.g. elevation and slope) but lower than those for SPI and STI. This indicates that heavy rain can only trigger landslides under specific topographic and hydrological conditions. Finally, to demonstrate the necessity of feature selection, four machine learning models are implemented for landslide susceptibility analysis at two scales with all features and filtered features as input, respectively. Higher accuracy is achieved using seven conditioning factors than all 12 conditioning factors, suggesting that 12 conditioning factors for landslide susceptibility analysis in the study area may lead to feature redundancy. Among the four machine learning models, the best-performing classifier is Xgboost using screened factors. Its Accuracy, F1 score, and AUC reach 0.8491, 0.8594, and 0.9168 at the 1 km scale. They are 0.8785, 0.8836, and 0.9474 on the 2 km scale.
This study’s results suggest that using the proposed FR-weighted GeoDetector for feature screening is beneficial in obtaining higher accuracy landslide susceptibility analysis results, which will help in more targeted landslide hazard control.
Acknowledgements
The authors would like to thank the fund providers, the anonymous reviewers, and the editors of the journal for constructive comments and suggestions.
Disclosure statement
The authors report no conflict of interest.
Data availability statement
Datasets used in this study are available from the corresponding author on reasonable request.
Additional information
Funding
References
- Achour Y, Boumezbeur A, Hadji R, Chouabbi A, Cavaleiro V, Bendaoud EA. 2017. Landslide susceptibility mapping using analytic hierarchy process and information value methods along a highway road section in Constantine, Algeria. Arab J Geosci. 10(8):1–16.
- Ayalew L, Yamagishi H. 2005. The application of GIS-based logistic regression for landslide susceptibility mapping in the Kakuda-Yahiko Mountains, Central Japan. Geomorphology. 65(1–2):15–31.
- Brand EW. 1984. Relationship between rainfall and landslides in Hong Kong. Proceedings of the 4th International Symposium on Landslides; Sep 16-21; Toronto. Toronto (ON): Canadian Geotechnical Society Toronto.
- Bui DT, Lofman O, Revhaug I, Dick O. 2011. Landslide susceptibility analysis in the Hoa Binh province of Vietnam using statistical index and logistic regression. Nat Hazards. 59(3):1413–1444.
- Chang KT, Merghadi A, Yunus AP, Pham BT, Dou J. 2019. Evaluating scale effects of topographic variables in landslide susceptibility models using GIS-based machine learning techniques. Sci Rep. 9(1):1–21.
- Chau KT, Sze Y, Fung M, Wong W, Fong E, Chan L. 2004. Landslide hazard analysis for Hong Kong using landslide inventory and GIS. Comput Geosci. 30(4):429–443.
- Chen CY, Chang JM. 2016. Landslide dam formation susceptibility analysis based on geomorphic features. Landslides. 13(5):1019–1033.
- Chen L, Guo Z, Yin K, Shrestha DP, Jin S. 2019. The influence of land use and land cover change on landslide susceptibility: a case study in Zhushan Town, Xuan’en County (Hubei, China). Nat Hazards Earth Syst Sci. 19(10):2207–2228.
- Chen T, He T, Benesty M, Khotilovich V, Tang Y, Cho H, Chen K. 2015. Xgboost: extreme gradient boosting. R Package Version 04-2. 1(4):1–4.
- Cheng C, Yang Y, Zhong F, Song C, Zhen Y. 2022. An optimization of statistical index method based on Gaussian process regression and geodetector, for higher accurate landslide susceptibility modeling. Appl Sci. 12(20):10196.
- Conforti M, Ietto F. 2021. Modeling shallow landslide susceptibility and assessment of the relative importance of predisposing factors, through a GIS-based statistical analysis. Geosciences. 11(8):333.
- Dai F, Lee C. 2002. Landslide characteristics and slope instability modeling using GIS, Lantau Island, Hong Kong. Geomorphology. 42(3–4):213–228.
- Duman T, Can T, Gokceoglu C, Nefeslioglu H, Sonmez H. 2006. Application of logistic regression for landslide susceptibility zoning of Cekmece Area, Istanbul, Turkey. Environ Geol. 51(2):241–256.
- Fall M, Azzam R, Noubactep C. 2006. A multi-method approach to study the stability of natural slopes and landslide susceptibility mapping. Eng Geol. 82(4):241–263.
- Gao L, Zhang LM, Cheung R. 2018. Relationships between natural terrain landslide magnitudes and triggering rainfall based on a large landslide inventory in Hong Kong. Landslides. 15(4):727–740.
- Ghosh, A. 2009. Slope instability and risk assessment of an unstable slope at Agrakhal, Uttarakhand. Proceedings of the India Geotechnical Conference; Dec 17–19; Guntur, India. Allied Publishers Pvt. Ltd.
- Goetz J, Brenning A, Petschko H, Leopold P. 2015. Evaluating machine learning and statistical prediction techniques for landslide susceptibility modeling. Comput Geosci. 81:1–11.
- Gong P, Wang J, Yu L, Zhao Y, Zhao Y, Liang L, Niu Z, Huang X, Fu H, Liu S, et al. 2013. Finer resolution observation and monitoring of global land cover: first mapping results with Landsat TM and ETM + data. Int J Remote Sens. 34(7):2607–2654.
- Guyon I, Elisseeff A. 2003. An introduction to variable and feature selection. J Mach Learn Res. 3:1157–1182.
- Guyon I, Elisseeff A. 2006. An introduction to feature extraction. Feature extraction: foundations and applications. Berlin, Germany: Springer Science & Business Media; p. 1–25.
- Hencher S, Lee S. 2010. Landslide mechanisms in Hong Kong. EGSP. 23(1):77–103.
- Huang F, Cao Z, Jiang S-H, Zhou C, Huang J, Guo Z. 2020. Landslide susceptibility prediction based on a semi-supervised multiple-layer perceptron model. Landslides. 17(12):2919–2930.
- Huang F, Tao S, Chang Z, Huang J, Fan X, Jiang S-H, Li W. 2021. Efficient and automatic extraction of slope units based on multi-scale segmentation method for landslide assessments. Landslides. 18(11):3715–3731.
- Huang R, Xu Z, Xu Q, Zhao J, Wu L. 2005. Characteristics of the foundation soil at Kangding airport and its genesis. Gongcheng Dizhi Xuebao. (J Eng Geol). 13(1):1–11.
- Karaman K, Ercikdi B, Kesimal A. 2013. The assessment of slope stability and rock excavatability in a limestone quarry. Earth Sci Res J. 17(2):169–181.
- Kavzoglu T, Sahin EK, Colkesen I. 2015. Selecting optimal conditioning factors in shallow translational landslide susceptibility mapping using genetic algorithm. Eng Geol. 192:101–112.
- Ko FW, Lo FL. 2018. From landslide susceptibility to landslide frequency: a territory-wide study in Hong Kong. Eng Geol. 242:12–22.
- Lee DH, Kim YT, Lee SR. 2020. Shallow landslide susceptibility models based on artificial neural networks considering the factor selection method and various non-linear activation functions. Remote Sens. 12(7):1194.
- Lee S, Hong SM, Jung HS. 2017. A support vector machine for landslide susceptibility mapping in Gangwon Province, Korea. Sustainability. 9(1):48.
- Lee S, Ryu JH, Min K, Won JS. 2003. Landslide susceptibility analysis using GIS and artificial neural network. Earth Surf Process Landforms. 28(12):1361–1376.
- Li L, Liu R, Pirasteh S, Chen X, He L, Li J. 2017. A novel genetic algorithm for optimization of conditioning factors in shallow translational landslides and susceptibility mapping. Arab J Geosci. 10(9):1–12.
- Li Y, Liu X, Han Z, Dou J. 2020. Spatial proximity-based geographically weighted regression model for landslide susceptibility assessment: a case study of Qingchuan area, China. Appl Sci. 10(3):1107.
- Liu Q, Huang D, Tang A, Han X. 2021. Model performance analysis for landslide susceptibility in cold regions using accuracy rate and fluctuation characteristics. Nat Hazards. 108(1):1047–1067.
- Liu R, Yang X, Xu C, Wei L, Zeng X. 2022. Comparative study of convolutional neural network and conventional machine learning methods for landslide susceptibility mapping. Remote Sens. 14(2):321.
- Liu YC, Chen CS. 2007. A new approach for application of rock mass classification on rock slope stability assessment. Eng Geol. 89(1–2):129–143.
- Lombardo L, Mai PM. 2018. Presenting logistic regression-based landslide susceptibility results. Eng Geol. 244:14–24.
- Nourani V, Pradhan B, Ghaffari H, Sharifi SS. 2014. Landslide susceptibility mapping at Zonouz Plain, Iran using genetic programming and comparison with frequency ratio, logistic regression, and artificial neural network models. Nat Hazards. 71(1):523–547.
- Persichillo MG, Bordoni M, Meisina C, Bartelletti C, Barsanti M, Giannecchini R, D'Amato Avanzi G, Galanti Y, Cevasco A, Brandolini P, et al. 2017. Shallow landslides susceptibility assessment in different environments. Geomatics Nat Hazards Risk. 8(2):748–771.
- Poudyal CP, Chang C, Oh H-J, Lee S. 2010. Landslide susceptibility maps comparing frequency ratio and artificial neural networks: a case study from the Nepal Himalaya. Environ Earth Sci. 61(5):1049–1064.
- Pourghasemi HR, Rahmati O. 2018. Prediction of the landslide susceptibility: which algorithm, which precision? Catena. 162:177–192.
- Rabby YW, Hossain MB, Abedin J. 2022. Landslide susceptibility mapping in three Upazilas of Rangamati hill district Bangladesh: application and comparison of GIS-based machine learning methods. Geocarto Int. 37(12):3371–3396.
- Raghuvanshi TK. 2019. Plane failure in rock slopes–A review on stability analysis techniques. J King Saud Univ Sci. 31(1):101–109.
- Reichenbach P, Rossi M, Malamud BD, Mihir M, Guzzetti F. 2018. A review of statistically-based landslide susceptibility models. Earth Sci Rev. 180:60–91.
- Sewell R, Campbell S, Fletcher C, Lai K, Kirk P. 2000. The pre-quaternary geology of Hong Kong. Hong Kong: geotechnical engineering office. Hong Kong: Civil Engineering Department, Hong Kong SAR Government, Hong Kong Geological Survey Memoir; p. 181.
- Shahri AA, Spross J, Johansson F, Larsson S. 2019. Landslide susceptibility hazard map in southwest Sweden using artificial neural network. Catena. 183:104225.
- Shano L, Raghuvanshi TK, Meten M. 2020. Landslide susceptibility evaluation and hazard zonation techniques–a review. Geoenviron Dis. 7(1):1–19.
- Tien Bui D, Tuan TA, Klempe H, Pradhan B, Revhaug I. 2016. Spatial prediction models for shallow landslide hazards: a comparative assessment of the efficacy of support vector machines, artificial neural networks, kernel logistic regression, and logistic model tree. Landslides. 13(2):361–378.
- Turconi L, Luino F, Gussoni M, Faccini F, Giardino M, Casazza M. 2019. Intrinsic environmental vulnerability as shallow landslide susceptibility in environmental impact assessment. Sustainability. 11(22):6285.
- Varnes DJ. 1984. Landslide hazard zonation: a review of principles and practice natural hazards. Vol. 3. Paris: UNESCO.
- Wang H, Zhang L, Luo H, He J, Cheung RWM. 2021. AI-powered landslide susceptibility assessment in Hong Kong. Eng Geol. 288:106103.
- Wang J, Haining R, Cao Z. 2010. Sample surveying to estimate the mean of a heterogeneous surface: reducing the error variance through zoning. Int J Geograph Inform Sci. 24(4):523–543.
- Wang Q, Wang D, Huang Y, Wang Z, Zhang L, Guo Q, Chen W, Chen W, Sang M. 2015. Landslide susceptibility mapping based on selected optimal combination of landslide predisposing factors in a large catchment. Sustainability. 7(12):16653–16669.
- Xie W, Li X, Jian W, Yang Y, Liu H, Robledo LF, Nie W. 2021. A novel hybrid method for landslide susceptibility mapping-based geodetector and machine learning cluster: a case of Xiaojin county, China. IJGI. 10(2):93.
- Xu S, Liu J, Wang X, Zhang Y, Lin R, Zhang M Liu M, Jiang T. 2020. Landslide susceptibility assessment method incorporating index of entropy based on support vector machine: a case study of Shaanxi Province. Geomat Inform Sci Wuhan Univ. 45(8):1214–1222.
- Yang J, Song C, Yang Y, Xu C, Guo F, Xie L. 2019. New method for landslide susceptibility mapping supported by spatial logistic regression and GeoDetector: a case study of Duwen Highway Basin, Sichuan Province, China. Geomorphology. 324:62–71.
- Yao X, Tham L, Dai F. 2008. Landslide susceptibility mapping based on support vector machine: a case study on natural slopes of Hong Kong, China. Geomorphology. 101(4):572–582.
- Yilmaz I. 2009. Landslide susceptibility mapping using frequency ratio, logistic regression, artificial neural networks and their comparison: a case study from Kat landslides (Tokat—Turkey). Comput Geosci. 35(6):1125–1138.
- Younes Cárdenas N, Erazo Mera E. 2016. Landslide susceptibility analysis using remote sensing and GIS in the western Ecuadorian Andes. Nat Hazards. 81(3):1829–1859.
- Youssef AM, Pourghasemi HR, Pourtaghi ZS, Al-Katheeri MM. 2016. Landslide susceptibility mapping using random forest, boosted regression tree, classification and regression tree, and general linear models and comparison of their performance at Wadi Tayyah Basin, Asir Region, Saudi Arabia. Landslides. 13(5):839–856.
- ZainAlabideen K, Helal M. 2016. Determination of the safe orientation and dip of a rock slope in an open pit mine in Syria using kinematic analysis. Al-Nahrain J Eng Sci. 19(1):33–45.
- Zêzere JL, de Brum Ferreira A, Rodrigues ML. 1999. The role of conditioning and triggering factors in the occurrence of landslides: a case study in the area north of Lisbon (Portugal). Geomorphology. 30(1–2):133–146.
- Zhou C, Lee C, Li J, Xu Z. 2002. On the spatial relationship between landslides and causative factors on Lantau Island, Hong Kong. Geomorphology. 43(3–4):197–207.
- Zhou X, Wen H, Zhang Y, Xu J, Zhang W. 2021. Landslide susceptibility mapping using hybrid random forest with GeoDetector and RFE for factor optimization. Geosci Front. 12(5):101211.