
Abstract
The study analyzed hourly extreme precipitation events in Chongqing and its six sub-regions from 2011 to 2021 during the warm season. Results showed uneven distribution of the 99.7th percentile hourly extreme precipitation threshold, with lower thresholds along the Yangtze River valley and higher thresholds in the Daba Mountains and Wuling Mountains. Both hourly extreme precipitation amount (HEPA) and intensity (HEPI) exhibited higher values in surrounding areas and lower values in the center, with the western, northeast, and southeastern regions experiencing the highest values. Spatial distribution of hourly extreme precipitation frequency varied, with higher frequencies in the northwestern and southern parts of Chongqing. Interannually, hourly extreme precipitation amount slightly increased, while intensity fluctuated. Monthly peak values for amount, frequency, and intensity occurred in July or August, and on a daily scale, the periods from 03:00 to 07:00 and 17:00 to 21: 00 exhibited higher values for amount and frequency, while the period from 11 :00 to 16:00 showed lower values. In summary, the study provided insights into the spatial and temporal patterns of hourly extreme precipitation events in Chongqing and its sub-regions during the warm season, highlighting variations in thresholds, distribution, and trends over the studied period.
1. Introduction
The escalating frequency and intensity of future extreme events are highlighted in the IPCC Sixth Assessment Report. Recent years have witnessed numerous extreme weather and climate events globally, including unprecedented occurrences like the Arctic heatwave and record high temperatures in Moscow in 2020, as well as devastating Australian wildfires. China has also faced a significant number of extreme weather events, such as the super-strong plum rains and widespread floods in the Yangtze River basin in 2020, exceptionally heavy rainfall and floods in Zhengzhou on July 20, 2021, and severe drought in the Yangtze River basin in 2022. These events have caused considerable natural disasters, particularly the short-duration heavy precipitation in Zhengzhou on July 20, 2021, resulting in substantial loss of life and property. The increasing occurrence and intensification of summer extreme climate events serve as indicators of the global warming trend, attracting significant attention from the international scientific community. Several studies have examined various regions using datasets such as UK hourly precipitation data (Darwish et al. Citation2021), revealing distinct extreme hourly precipitation patterns across five different regions. Investigation of annual trends in extreme hourly precipitation was conducted in the southeastern United States, utilizing data from 50 primary weather stations (Brown et al. Citation2020). Furthermore, an increasing trend in extremely heavy precipitation events was observed in the Indian subcontinent, primarily in high elevation areas of the northwestern Himalaya and along the foothills extending southward to the Indus-Ganges basin (Sen Roy and Balling Citation2009). In South Africa, positive summer trends were predominantly concentrated in the southeastern coastal areas, while winter trends exhibited spatial variation with negative trends in coastal areas and positive trends in inland areas (Sen Roy and Mathieu Citation2013).
Chinese scholars have conducted extensive research on hourly extreme precipitation in different regions of mainland China (Zhang and Zhai Citation2011; Chen et al. Citation2022; Zhang et al. Citation2021; Miao et al. Citation2021; Jiang et al. Citation2020; Liu et al. Citation2020; X. Yang et al. Citation2020; Z. Yang et al. Citation2020; Wu and Zhan Citation2020; Wu et al. Citation2021; Yang and Su Citation2021; Yang et al. Citation2017; Dong et al. Citation2017; Li et al. Citation2022). Their findings can be summarized as follows: In Yunnan, South China, North China, and Northeast China, the most frequent occurrence of extreme precipitation events is during the night. However, in the Guizhou Plateau and Sichuan Basin, the highest frequency occurs in the late night or early morning hours. The Southwest region (Sichuan, Chongqing, Yunnan, and Guizhou) exhibits similar trends in the frequency of hourly extreme precipitation, but Sichuan shows a unimodal distribution with distinct nocturnal rainfall characteristics, while Chongqing, Guizhou, and Yunnan exhibit bimodal distributions. In the Three Gorges Reservoir area, intense rainfall primarily increases near the eastern dam, necessitating attention to the impact of hourly extreme precipitation on the reservoir inflow, especially during the warm season. The spatial distribution of extreme precipitation in Shanxi indicates that it is greater in mountainous areas than in basins, more pronounced in the south than in the north, and exhibits transient temporal effects and localized extremes. The urban heat island effect leads to a higher frequency of hourly extreme precipitation events within cities. The frequency of extreme precipitation at different thresholds follows a unimodal pattern, with the peak occurring around 17:00. In Anhui Province, the frequency of extreme precipitation is highest in mountainous areas, lowest in plains and hilly regions, but the intensity of hourly extreme precipitation is highest in the plains and hilly regions, with significant diurnal variations. In Henan Province, hourly extreme precipitation events primarily occur in August, with higher intensity but lower frequency in urban areas, while mountainous areas have the highest frequency but lowest intensity. Beijing exhibits two high-value centers for annual precipitation (urban core area and downwind precipitation center), with the urban heat island effect potentially being an important factor influencing the formation of the high-value center in the urban core area. Hourly extreme precipitation and its frequency in Shandong Province exhibit a belt-like distribution, with two high-value centers in July. Hourly extreme precipitation and its frequency are higher in northern Xinjiang than in the south, although the southern region contributes more to total summer precipitation.
Chongqing, located in the southwestern region of China, is characterized by diverse climate and complex terrain. In recent years, due to global warming, extreme weather events have increased in frequency in the Chongqing area, significantly impacting residents’ lives and property. Therefore, it is crucial to study the characteristics, formation mechanisms, prediction techniques, and early warning methods of extreme precipitation events in Chongqing (C. Yang et al. Citation2020; Guo et al. Citation2018; Chen et al. Citation2021; Wang et al. Citation2020). Research on extreme precipitation in Chongqing reveals a bimodal pattern in monthly variations, with the last three peaks showing unimodal characteristics. Regarding daily variations, high-frequency short-duration heavy rainfall mainly occurs between 03:00-05:00, while low-frequency short-duration heavy rainfall primarily appears between 13:00-15:00. Spatially, three high-value regions have been identified in Chongqing center, namely Shapingba, Kaizhou, and Xiushan, dividing the area into three short-duration heavy rain zones: western, southeastern, and northeastern. The frequency distribution of short-duration high-intensity rainfall at different elevations is closely related to the number of observation stations. Within the range of 200-800 meters above sea level, short-duration high-intensity rainfall accounts for 83% of the total frequency, followed by a significant decrease in both frequency and intensity. Utilizing the method of optimal linear estimation, the spatial distribution of maximum precipitation values for different return periods in Chongqing changes from point-like distribution for short-duration rainfall to regional distribution for long-duration rainfall. The high-value center in the northeast of Chongqing continuously shifts northward, possibly influenced by topography. Understanding the characteristics and patterns of extreme precipitation events in Chongqing is essential for developing effective strategies to mitigate their impacts. Further research in this area can contribute to enhancing prediction accuracy, improving early warning systems, and facilitating disaster management in the region.
Short-term heavy precipitation events occur frequently in Chongqing, which often cause geological disasters. Previous studies on precipitation in Chongqing mainly focused on daily precipitation and annual precipitation (Fang et al. Citation2020), while few studies on hourly precipitation, especially hourly extreme precipitation, were conducted. Therefore, it is of great practical significance to study the characteristics of hourly extreme precipitation in this region. Based on the hourly precipitation data of 34 national meteorological stations in Chongqing, the temporal and spatial characteristics of extreme precipitation in Chongqing were analyzed comprehensively, including the total precipitation, frequency and intensity of hourly extreme precipitation. The conclusion of the analysis provides a valuable reference for improving the rainstorm forecast in Chongqing.
2. Study area
illustrates the geographical location of Chongqing, China and the distribution of 34 national meteorological stations(the red solid box represents the central urban area, the blue hollow box represents the western, the black hollow circle represents the southwest, the black solid circle represents the central, the black solid triangle represents the northeast, and the blue hollow triangle represents the southeast). Chongqing lies in the transitional zone between the first and second levels of Chinese terrain, specifically in the eastern region of the Sichuan Basin (28°N∼32.5°N, 105°E∼110.5°E). The western region is characterized by a basin terrain, while the southern area is marked by the Wuling and Wu Mountains, running in a southwest to northeast direction. The northern portion of Chongqing is located adjacent to the Qinling-Daba Mountains. The Yangtze River flows through Chongqing from southwest to northeast, which is the transition zone between the Tibetan Plateau and the middle-lower reaches of the Yangtze River plain (Bao et al. Citation2011). Due to its unique topography, Chongqing is undoubtedly one of the most distinctive areas in terms of rainfall spatial and temporal distributions, and is classified as having subtropical wet monsoon climate. The annual average precipitation is about 1200 mm, and the precipitation concentration period is mainly from night to early morning, spreading from west to east (Tang et al. Citation2011; Li et al. Citation2017; Su et al. Citation2021). The frequency and intensity of rainfall are high during the warm season, contributing to secondary disasters (such as flash floods, landslides, and debris flows), which have a severe impact on economic, social, and safety issues in Chongqing (Wang et al. Citation2008; Tang et al. Citation2008; Jing et al. Citation2011). To account for the differences in topography and climate, Chongqing is divided into six sub-regions based on multi-year climate characteristics, terrain, and administrative management, including the western region, southwestern region, central urban area, central region, southeastern region, and northeastern region (). The central urban area represents the city and population concentration region, while the western region represents the Chengdu-Chongqing economic circle, and is primarily composed of plains and hills. The southwestern area represents the mountainous areas of the southern part of western China, mainly influenced by weather systems in northern Guizhou Province. The central region represents the transitional area between the basin and the mountainous regions, while the northeastern and southeastern regions represent mountainous areas. This regional classification has been widely applied in Chongqing daily weather services. This study will investigate the precipitation features and regional differences across the various areas of Chongqing, taking into consideration their corresponding topographical characteristics. The overall flowchart depicting the methodology of this study is illustrated in .
Figure 1. Geographical location, elevation (color shaded area) and 6 climatic zones of Chongqing, D and W representing Daba Mountain and Wuling Mountain respectively.
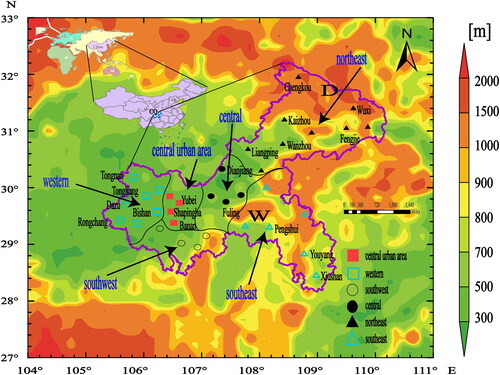
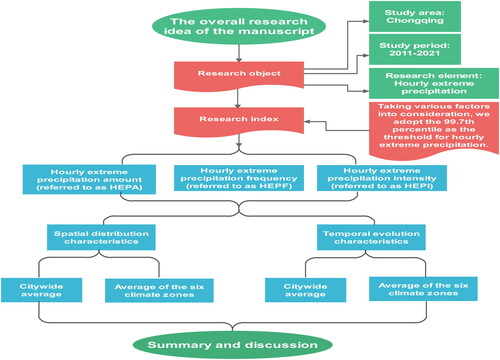
Figure 2. Overall flowchart of the manuscript.
The remainder of this study is organized as follows: Section 2 details the data and methods employed in this study. In Section 3, we present the primary results, which include an examination of the varying thresholds for hourly extreme precipitation amount in the Chongqing region, as well as an analysis of the fundamental characteristics and temporal evolution of such precipitation in the area. Finally, Section 4 concludes with a discussion of our findings.
3. Data and method
3.1. Data
In this study, a dataset of hourly precipitation from 34 national-level surface observation stations () in Chongqing, China, covering the warm seasons (May to September) of the years 2011-2021, was utilized. The dataset was obtained from the National Meteorological Information Center of the China Meteorological Administration (http://data.cma.cn/data/online.html?t=1). The temporal resolution of the data was one hour, and the spatial coverage included the 34 national-level meteorological stations in the Chongqing region. The data were initially processed using Excel and subsequently visualized using GrADS and Origin 2021 software.
3.2. Methods
3.2.1. Definition of hourly extreme precipitation thresholds
Previous studies have employed various definitions for hourly extreme precipitation thresholds based on different research objectives. One approach is to use fixed thresholds for extreme precipitation amount. For example, Yao et al. (Citation2009) analyzed the spatial and temporal distribution characteristics of rainfall intensities below and above 8 mm/h based on hourly precipitation data in China, while Chen et al. (Citation2013) examined the spatial and temporal distribution of short-duration heavy rainfall at five levels: 10, 20, 30, 40, and 50 mm/h. However, using fixed precipitation thresholds can render inter-regional comparisons meaningless when studying large geographic areas. What may be considered extreme precipitation in relatively dry regions might be regarded as normal precipitation in areas with abundant rainfall, thus not truly representing extreme events. On the other hand, if the defined threshold is too high, it may overlook certain extreme precipitation events in arid regions, whereas a lower threshold may not be representative for regions with abundant rainfall. Therefore, when dealing with a wide range of study areas, an approach that accounts for regional differences in precipitation is more scientifically sound. Given the vast and diverse geographical features of the Chongqing region, we adopted the percentile-based method (Dong et al. 2017) to define the thresholds for hourly extreme precipitation based on the specific rainfall characteristics at each station. The percentile method is a non-parametric method suitable for various types of distributional data and represents an empirical distribution relationship. Different percentiles correspond to different levels of heavy rainfall, with higher percentiles indicating greater extremity of the corresponding precipitation. Specifically, we first arranged the hourly precipitation values at a given station in ascending order, X1, X2, X3,…, Xm,…, Xn, representing the hourly precipitation series from May to September between 2011 and 2021. Using the Excel PERCENTILE function, we calculated the multi-year average of the 99.7th percentile value, which is defined as the threshold for extreme precipitation events. When the hourly precipitation exceeds this threshold, an hourly extreme precipitation event is considered to have occurred. In this study, we calculated the 97th, 99th, 99.5th, 99.7th and 99.9th percentile thresholds, respectively.
3.2.2. Definition of hourly extreme precipitation amount (HEPA), frequency (HEPF), intensity (HEPI) and contribution ratio
This study examines indicators that characterize the features of hourly extreme precipitation, which include Hourly Extreme Precipitation Amount (HEPA), Hourly Extreme Precipitation Frequency (HEPF), Hourly Extreme Precipitation Intensity (HEPI), and Contribution Ratio to Hourly Extreme Precipitation. HEPA represents the cumulative rainfall exceeding the threshold for hourly extreme precipitation within a specific time period. HEPF refers to the frequencies in the designated period that exceed the threshold for hourly extreme precipitation. HEPI is calculated as the sum of precipitation exceeding the threshold within a certain time period divided by the corresponding precipitation frequency. The Contribution Ratio to HEPA is determined by dividing the sum of precipitation exceeding the threshold within a specific time period by the total precipitation amount (Dong et al. 2017). Furthermore, we conducted distinct tests for statistical significance on the annual (2011-2021), monthly (May-September), and intraday (0-23 h) hourly extreme precipitation amounts (HEPA). The results consistently demonstrate p-values that significantly exceed the threshold of 0.05, indicating the absence of significant differences in HEPA, whether analyzed on an annual, monthly, or hourly basis (table omitted).
4 Results
4.1. Hourly extreme precipitation thresholds of different intensities
presents the threshold characteristics of percentiles of hourly extreme precipitation for various stations in Chongqing, including the 97th, 99th, 99.5th, 99.7th, and 99.9th percentiles. As shown in , the mean values of hourly extreme precipitation for the 97th, 99th, and 99.5th percentiles are all below 10.0 mm, with frequency percentage of 3.1%、1.0% and 0.5% respectively, and the corresponding Rainfall amount percentage of 78.0%、50.3% and 35.6%. The frequency percentage and precipitation amount percentage are relatively high respectively. The mean value of the 99.9th percentile hourly precipitation is 19.7 mm.h−1, with a relatively low frequency of occurrence (3.1%) and a precipitation percentage contribution of 13.4%. According to the scale analysis and the relationship between precipitation amounts and vertical velocities, precipitation of > =10.0 mm.h−1 is generally caused by medium-scale to small-scale weather systems, whereas precipitation of > =50.0 mm.h−1 is mainly caused by small-scale weather systems. Therefore, the 97th, 99th, and 99.5th percentile hourly precipitation do not have typical characteristics of hourly extreme precipitation, and the threshold value of the 99.9th percentile hourly precipitation is too strict. The mean threshold value of the 99.7th percentile hourly precipitation is 11.2 mm.h−1, with a range of 8.9 to 13.6 mm.h−1 and a frequency of occurrence of 0.3%, and the corresponding precipitation percentage contribution of 26.9%. Combining the criteria provided by Zhang and Zhai of > =20.0 mm.h−1 as the extreme hourly precipitation standard for central and eastern China, consistent with the distribution of heavy rainfall, this study analyzes the spatiotemporal characteristics of hourly extreme precipitation in the Chongqing region using the 99.7th percentile hourly precipitation as a benchmark.
Table 1. The threshold of hourly extreme precipitation in different percentile in Chongqing
4.2. Basic characteristics of hourly extreme precipitation
4.2.1. Hourly extreme precipitation intensity threshold
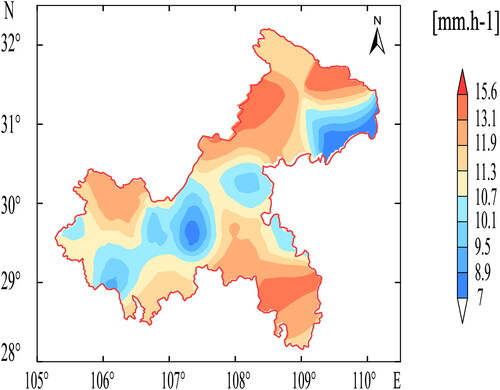
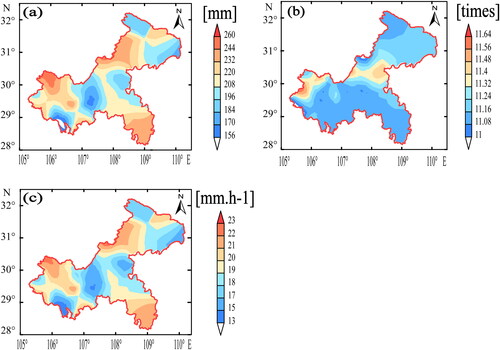
The spatial distribution of the hourly extreme precipitation threshold at the 99.7th percentile in Chongqing City is shown in , while the threshold spatial distribution at other percentiles is similar to that at the 99.7th percentile (Figure not shown). The thresholds in the northern part of the central urban area, southern part of the southwestern area, northern part of the southeastern area, and southern part of the northeastern area are relatively small, below 10 mm.h−1, while the thresholds in the northwestern, central, northern part of the northeastern area, and southern part of the southeastern area are relatively large, exceeding 10 mm.h−1, with some areas exceeding 13 mm.h−1. In conclusion, the hourly precipitation threshold at the 99.7th percentile is distributed unevenly in Chongqing, with lower thresholds along the Yangtze River valley and higher thresholds in the Daba Mountains (e.g. Kaizhou) and the Wuling Mountains (e.g. Youyang), reflecting the local and complex characteristics of precipitation in Chongqing unique terrain.
Figure 3. Spatial distribution of hourly extreme precipitation thresholds at the 99.7th percentile in Chongqing.
4.2.2. Contribution ratio
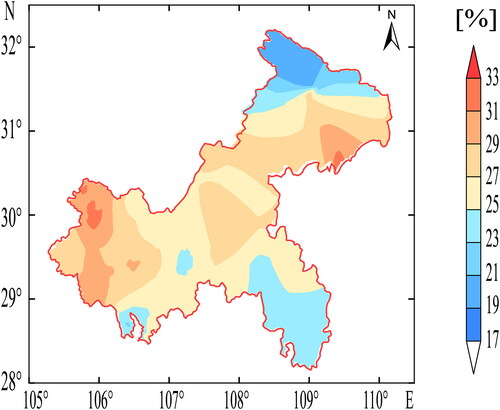
During the warm season (May to September) in Chongqing City, there is a significant difference in the contribution ratio of hourly extreme precipitation to the total precipitation among different regions, as shown in . The contribution ratio is comparatively high in most areas of Northwest and most of Southwest Chongqing, as well as in large parts of the central urban area, central and Southeast Chongqing, generally exceeding 25%, with some areas reaching over 31%. Conversely, the contribution ratio is relatively low in some areas of northern part of Northeast Chongqing, most of Southeast Chongqing, and a few locations in Southwest Chongqing, generally below 25%, with some areas being less than 19%. Over all, the contribution ratio is higher in the central regions、 western regions 、 southern regions of Northeast Chongqing and the northern regions of Southeast Chongqing, whereas the contribution ratio is relatively low in higher altitude areas such as Daba and Wuling Mountains.
Figure 4. Contribution ratio of hourly extreme precipitation amount to total precipitation amount of summer in Chongqing from 2011 to 2021.
4.2.3. Spatial distribution
The spatial distribution of the 99.7th percentile HEPA, HEPF, and HEPI in Chongqing are shown in . The spatial distribution of HEPA and HEPI is generally identical. HEPA exhibits a distribution pattern of high values around the periphery and low values in the center. The greatest precipitation amounts are found in the northwestern and most of southeastern parts, as well as in the majority of the northeastern part of Chongqing, with values exceeding 244.9 mm. Along the Yangtze River from the southwest to the northeast, the precipitation amounts are the lowest, below 176.7 mm. The spatial distribution of HEPI is similar to that of HEPA. The highest values are found in the northern area of west and southern parts of southeast of Chongqing, as well as in the western part of northeastern region of Chongqing. The multi-year average of HEPI in these regions is higher than 20 mm.h−1. Among them, Tongnan, Tongliang, Wanzhou, Kaizhou, Youyang, and Xiushan have a precipitation intensity exceeding 21 mm.h−1, making them the counties with the highest HEPI in Chongqing. The areas with the highest HEPI values are mainly located on the windward slopes of mountains and hills, and are lowest in the southwest to the northeast, below 18 mm.h−1. Fuling and Changshou in the central part of Chongqing have the lowest HEPI values, with values below 17 mm.h−1. The areas of low HEPI are mainly located along the Yangtze River. The spatial distribution of HEPF is different from that of HEPA and HEPI, with larger values of HEPF found in the northwestern and southern parts of the northeastern region of Chongqing, exceeding 11.4 times. Owing to its unique geographical location and terrain, the southeastern part of Chongqing and the western part of the northeastern region have significantly higher HEPA and HEPI compared to other areas. During the warm season (May to September), warm and humid air from southwest and southeast China is blocked and lifted by the Daba and Wuling Mountains, resulting in higher HEPA and HEPI in these regions, which are therefore the most frequently affected areas by extreme hourly precipitation in Chongqing.
Figure 5. Spatial distribution of HEPA, HEPF and HEPI in Chongqing
4.2.4. Spatial distribution of HEPA, HEPF and HEPI in different months
From , which illustrates the spatial distribution of monthly 99.7th percentile HEPA, HEPF, and HEPI throughout the Chongqing warm season (May-September), it becomes evident that the southeast of Chongqing experienced the highest hourly extreme precipitation amount in May (24.1-66.9 mm), with Youyang recording the highest amount of 66.9 mm (). Conversely, Chengkou and Rongchang had the least amount at 11.2 and 11.3 mm, respectively, while the remaining regions fell within the range of 20-45 mm. Compared to May, there was a slight increase in hourly extreme precipitation amount in June (), with Banan recording the highest value at 69.5 mm and Dianjiang and Wuxi recording the least at 27.7 and 28.0 mm, respectively. The remaining regions recorded values within the range of 27.7-69.5 mm. In July, however, there was a significant increase in the hourly extreme precipitation amount (), with Wanzhou recording the highest value of 99.4 mm and Tongnan recording the second-highest value at 97.0 mm. The central area was in a relatively low-value region, for instance, Fuling had the lowest value at 27.1 mm, while the remaining regions recorded values within the range of 30-80 mm. Regarding August (), there was a slight decrease in the hourly extreme precipitation amount in comparison to July. Dazu recorded the highest value at 69.8 mm, whereas Fengjie recorded the lowest value at 21.7 mm. Four relatively high-value centers were identified in Dazu (69.8 mm), Liangping (67.5 mm), Wuxi (43.8 mm), and Shizhu (40.0 mm), respectively. On the other hand, the hourly extreme precipitation amount reduced further in September than in August (), with high-value centers existing in Liangping (56.0 mm) and Yubei (42.2 mm) and the least value recorded in Pengshui (8.1 mm).
Figure 6. Spatial distribution of HEPA, HEPF and HEPI from May to September in Chongqing during 2011-2021.
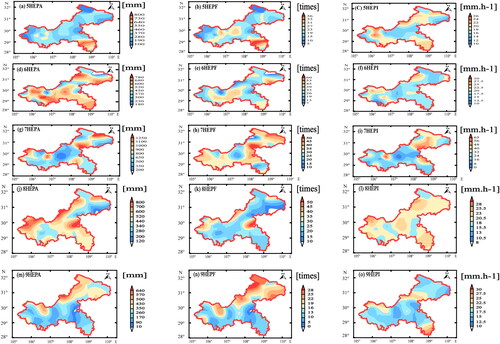
The spatial distribution characteristics of monthly HEPF exhibit remarkable similarities to those of precipitation amount. It is noteworthy that HEPF attains its peak value in July, as shown in , ranging from 1.5 to 4.5 times. Conversely, in May, the range is from 0.6 to 3.3 times (), while in June, it is from 1.6 to 3.5 times (). In August, the range is from 1.1 to 3.7 times (). Finally, in September, it is from 0.5 to 2.5 times ().
Throughout the Chongqing warm season from May to September, HEPI demonstrated varying spatial distribution characteristics compared to HEPA and HEPF. For instance, in May (), HEPI in Chongqing ranged from 13.8 to 24.1 mm.h−1, with the highest and lowest values identified in Bishan in western Chongqing and Rongchang in southwestern Chongqing, respectively. Similarly, in June (), HEPI in Chongqing ranged from 15.0 to 24.3 mm.h−1, with the highest value in Tongliang in northwestern Chongqing and the lowest value in Fuling in central Chongqing. In July (), the range of HEPI in Chongqing was between 14.9 to 24.5 mm.h−1, with the highest value in Shapingba in central Chongqing and the lowest value in Fuling in central Chongqing. In comparison to July, August reported a slight increase in the range of HEPI from 16.3 to 24.0 mm.h−1 in Chongqing (), with the highest value in Tongnan in northwestern Chongqing and the lowest value in Chengkou in northeastern Chongqing. Finally, in September (), the range of HEPI in Chongqing was from 13.8 to 26.0 mm.h−1, with the highest value in Xiushan in southeastern Chongqing and the lowest value in Fuling in central Chongqing.
Based on the above analysis, it can be concluded that the highest hourly extreme precipitation amounts and frequencies are observed in July, followed by June and August, while the lowest values are generally observed in May and September. The intensity of hourly extreme precipitation is relatively stronger in the northeast, southeast, and western regions, whereas it is somewhat weaker in the central regions.
4.3. Temporal evolution characteristics of hourly extreme precipitation
4.3.1. Annual variation characteristics of hourly extreme precipitation
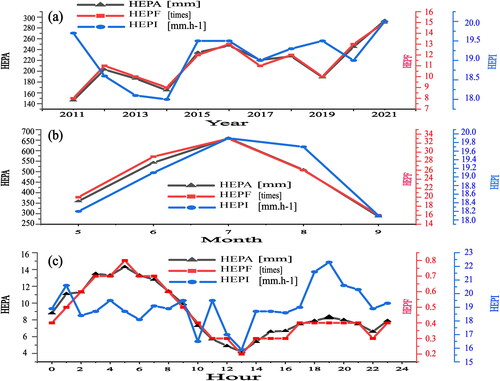
presents the temporal evolution of HEPA, HEPF, and HEPI during the warm season (May-September) in Chongqing. As can be observed from the figure, the overall trends of HEPA and HEPF in Chongqing during the warm season are basically consistent, showing a gradual increase, with HEPA distributed between 13.3-26.7 mm. The minimum value of HEPF occurred in 2011 at 0.7%, reaching the highest in 2021 at 1.3%. The distribution of HEPI was between 18-20 mm.h−1, with two high points (19.7 mm.h−1 and 20 mm.h−1) in 2011 and 2021 and two low points (18.1 mm.h−1 and 18 mm.h−1) in 2013 and 2014. Overall, the HEPA and HEPF in Chongqing have slightly increased in recent years, while the HEPI shows a fluctuating trend.
Figure 7. Interannual variation characteristics (a), intermonthly variation characteristics (b), diurnal variation characteristics (c) of HEPA, HEPF and HEPI in Chongqing.
4.3.2. Monthly variation characteristics of hourly extreme precipitation
As illustrated in , the Chongqing region displays pronounced inter-monthly distribution patterns, characterized by the unimodal curve of the HEPA, HEPF, and HEPI during the warm season (May-September), culminating in July, with respective values of 59.9 mm, 3%, and 19.9 mm·h−1. This phenomenon arises from the primary flood season in the Chongqing region, which spans July and August, as it is influenced by the warm, moist southwest airstream on the northwest periphery of the subtropical high. Consequently, precipitation significantly increases and is predominantly convective, resulting in the aggregation of peak values for hourly extreme precipitation amount, frequency, and intensity during July or August.
4.3.3. Diurnal variation characteristics of hourly extreme precipitation
shows the daily variation curve of hourly extreme precipitation during the warm season (May-September) in Chongqing based on multi-year average data. As can be seen from , the high value periods of HEPA and HEPF are from 03:00-07:00 and 17:00-21:00, respectively, while the low value period is from 11:00-16:00. Among them, the maximum values are 14.3 mm and 0.8 times at 05:00, while the minimum values are 4.2 mm and 0.2 times at 13:00. The high value period of HEPI mainly occurs in the dusk (18:00-21:00), while the low value period mainly occurs at noon (12:00-13:00). Among them, the maximum value is 22.3 mm.h−1 at 19:00, while the minimum value is 15.9 mm.h−1 at 13:00. The dusk (18:00-21:00) is the main period of hourly extreme precipitation in Chongqing, followed by 00:00-09:00, while noon (12:00-13:00) is the period with less hourly extreme precipitation in Chongqing. The HEPF is relatively high from midnight (00:00) to morning (09:00), but the HEPI is relatively low. The period from 18:00-21:00 has the highest HEPI, but the HEPF is relatively low, which may be related to the strong convective rainfall before and after dusk in Chongqing.
4.3.4. Diurnal variation characteristics of hourly extreme precipitation in different regions of Chongqing
From the daily variation curves of HEPA, HEPF and HEPI averaged over six sub-regions of Chongqing (), it can be observed that the HEPA of the six sub-regions exhibits a bimodal daily variation curve (), with peaks mainly occurring from 01:00-06:00 (Beijing time, same below), among which the southwest region reaches its maximum at 03:00 with a HEPA of 19.5 mm, and 11:00-14:00 is the period of low values for HEPA, with the minimum occurring in the southwest region at 12:00 with a HEPA of 1.8 mm. In addition, there is also a secondary peak from 16:00-23:00, with the maximum occurring in the western region at 23:00 with a HEPA of 13.4 mm. The daily variation curve of HEPA of the six sub-regions is similar to that of HEPF (), with the distribution of high and low value periods being basically consistent with that of HEPA. The daily variation curve of HEPI of the six sub-regions is not clear (), with the period from 17:00 to the next day 04:00 being a relative peak, and 10:00-13:00 being a low value period, among which the maximum occurs in the western region at 19:00 with a HEPI of 2.43 mm.h−1, while the minimum occurs in the southwest region at 12:00 with a HEPI of 0.94 mm.h−1.
Figure 8. Hourly variation of multi-year average HEPA, HEPF and HEPI in six sub-regions of Chongqing from 2011 to 2021.
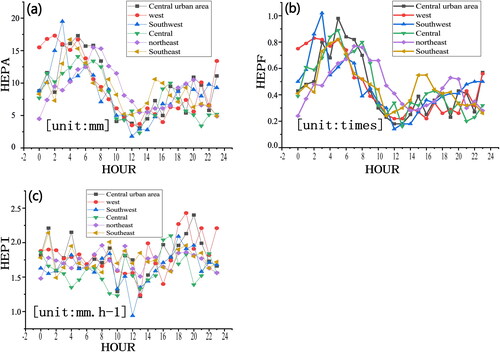
It can be seen that 01:00-06:00 is the period of high values for HEPA and HEPF of the six sub-regions in Chongqing, while the low value period mainly occurs from 10:00-14:00. The occurrence time of the maximum value of extreme hourly precipitation amount and precipitation frequency in the southwest region is 2-3 h earlier than that in other regions. The hourly extreme precipitation intensity is relatively high in the six sub-regions of Chongqing from 18:00-21:00, while it is relatively low from 11:00-13:00.
5 Conclusions and discussion
5.1. Conclusions
Using hourly precipitation data from the warm season (May to September) between 2011 and 2021, this study provides the threshold for hourly extreme precipitation in Chongqing, and analyzes the basic characteristics of extreme hourly precipitation events in Chongqing and its six sub-regions. The findings are summarized as follows:
5.1.1 The hourly precipitation threshold at the 99.7 percentile in Chongqing exhibits an uneven distribution across the region. The threshold is lower along the Yangtze River valley, and higher in areas with high-altitude mountains such as Daba Mountains (e.g. Kaizhou) and Wuling Mountains (e.g. Youyang).
5.1.2 The spatial distribution of hourly extreme precipitation amount and intensity is similar. The hourly extreme precipitation amount mainly shows a pattern of higher values on the periphery and lower values in the center, with the highest precipitation occurring in the northwest and southeast regions, as well as in the northeast region. The spatial distribution of intensity is similar, with the highest intensity occurring in the northwest region, the southern part of the southeast region, and the western part of the northeast region. However, the spatial distribution of the average frequency of precipitation is notably different from that of precipitation and intensity, with larger frequency occurring in the southwestern part of the northwest region and the southern part of the northeastern region of Chongqing.
5.1.3 Overall, the contribution of hourly extreme precipitation is high in the central and western regions, the southern part of the northeast region, and the northern part of the southeast region of Chongqing. In contrast, the contribution is relatively low in areas with high-altitude mountains such as Daba Mountains and Wuling Mountains.
5.1.4 In terms of annual distribution, hourly extreme precipitation amount and frequency have slightly increased in recent years in Chongqing, and intensity shows a fluctuating trend. In terms of monthly distribution, the peaks of hourly extreme precipitation amount, frequency, and intensity are mostly concentrated in July or August. In terms of daily variation, precipitation and frequency are highest between the hours of 03:00-07:00 and 17:00-21:00, and lowest between the hours of 11:00-16:00. The highest intensity occurs in the dusk (18:00-21:00), and the lowest intensity occurs at noon (12:00-13:00).
5.2. Discussion
Chongqing, located in an inland region, exhibits different precipitation characteristics compared to the eastern monsoon region of China. Previous studies have indicated an increasing trend in both the amount and frequency of hourly extreme precipitation in the eastern region of China, while the intensity of hourly extreme precipitation during the morning hours has decreased (Dong et al. 2017). The occurrence mechanism of hourly extreme precipitation in the Chongqing region is complex and influenced by various factors. These include the plateau climate, subtropical monsoon climate, topography, land use changes induced by rapid urban development, and the surrounding complex terrain (Li et al. Citation2017; Zheng et al. Citation2017; Wu et al. Citation2006). Additionally, large-scale factors like Indian Ocean sea surface temperatures, the Northwestern Pacific Subtropical High, and the Southwest Vortex may contribute to excessive extreme precipitation in the reservoir area (Li et al. Citation2020 Fang et al. Citation2020; Cui et al. Citation2022). The expansion of the Three Gorges Reservoir area, along with its climate effects superimposed on large-scale climate systems, has resulted in frequent local extreme precipitation in Chongqing (Zhang et al. Citation2004).
Over the past two decades, Chongqing has experienced a rise in surface temperature due to increases in population, urbanization, gross domestic product, energy consumption, and urban built-up area. The most significant increase is observed in minimum nighttime temperatures, highlighting the urban heat island effect. Within the main urban area of Chongqing, the surface urban heat island area has fluctuated and expanded over time. Conversely, temperatures in the upper levels of the troposphere have decreased, intensifying the vertical thermal contrast. This phenomenon may contribute to the high occurrence of extreme hourly precipitation during the 03-07 and 17-21 h in the Chongqing region (Zhang et al. Citation2023). Understanding the causal mechanisms behind hourly extreme precipitation in the Chongqing region requires further exploration from various perspectives. This study investigates certain patterns of hourly extreme precipitation based on 11 years of data from national meteorological observation stations. However, limitations such as relatively limited data sources and low spatial resolution still exist. Future research will utilize multiple data sources, including regional automatic stations data, to enhance the study of hourly extreme precipitation and sustained precipitation in the Chongqing region.
Acknowledgements
The authors appreciate anonymous reviewers who provided insightful comments that helped to improve the manuscript. In addition, special thanks to Guo Qu, a research-level senior engineer at the Chongqing Municipal Climate Center, for his selfless help.
Disclosure statement
No potential conflict of interest was reported by the authors.
Data availability statement
All data used during the study were provided by the China Meteorological Administration(http://data.cma.cn/). Direct requests for these materials may be made to the provider.
Additional information
Funding
References
- Bao X, Zhang F, Sun J. 2011. Diurnal variations of warm-season precipitation east of the Tibetan plateau over China. Mon Wea Rev. 139(9):2790–2810. doi: 10.1175/MWR-D-11-00006.1.
- Brown VM, Keim BD, Black AW. 2020. Trend analysis of multiple extreme hourly precipitation time series in the Southeastern United States. J Appl Meteorl Climatol. 59(3):427–442. doi: 10.1175/JAMC-D-19-0119.1.
- Chen J, Zheng Y, Zhang X, et al. 2013. Analysis of the climatological distribution and diurnal variations of the short-duration heavy rain and its relation with diurnal variations of the MCSs over China during the warm season. Acta Meteorol Sin. 71(3):367–382. (in Chinese).
- Chen M-L, Mao W, Shi C-X, et al. 2022. Characteristics and regional differences of hourly extreme precipitation in the wet season of southwest China from 1991 to 2020. J Chengdu Univ Inf Eng. 37(4):435–441. (in Chinese).
- Chen P, Zhou YY, Feng P, et al. 2021. Spatial and temporal characteristics analysis of short-duration intense precipitation in Chongqing. Prog Meteorol Sci Technol. 36(6):944–953. in Chinese.
- Cui T, Chen X, Zou X, et al. 2022. State of the climate in the Three Gorges Region of the Yangtze River basin in 2020. Atmos Oceanic Sci Lett. 15(2):100112. doi: 10.1016/j.aosl.2021.100112.
- Darwish MM, Tye MR, Prein AF, et al. 2021. New hourly extreme precipitation regions and regional annual probability estimates for the UK. Int J Climatol. 41(1):582–600. doi: 10.1002/joc.6639.
- Dong X, Gu W, Cao J, et al. 2017. Distribution and variation characteristics of hourly extremely heavy precipitation in flood season in Shandong Province. Meteorol Month. 43(8):953–961. (in Chinese).
- Fang D, Dong X, Deng C, et al. 2020. Spatiotemporal distribution characteristics of precipitation in the Chongqing region during 2008-2016. Atmos Sci. 44(2):327–340. doi: 10.3878/j.issn.1006-9895.1907.18256. in Chinese.
- Guo Q, Chen J, Li R, et al. 2018. Climatic characteristics of short duration heavy precipitation in Chongqing. J Arid Meteorol. 36(6):944–953. doi: 10.11755/j.issn.1006-7639-06-0944.(in Chinese).
- Jiang X, Luo Y, Zhang D-L, et al. 2020. Urbanization enhanced summertime extreme hourly precipitation over the Yangtze River Delta. J Climate. 33(13):5809–5826. doi: 10.1175/JCLI-D-19-0884.1.
- Jing X, Tu N, Zeng P, Li M, Ye C, Du X, Jing Y, Li D. 2011. Cause analysis and characteristies of a nainstorm in the southwest area of China. J Atmos Sci. 34(6):725–736. (in Chinese).
- Liu P, Liu M, Shen W, et al. 2020. Spatio-temporal distribution characteristics of annual extreme hourly rainfall over central China. Torrential Rain Disasters. 39(5):508–515. (in Chinese).
- Li Q, Deng C, Zhang Y, et al., 2017. Study on the characteristics of hourly heavy precipitation in Sichuan-Chongqing Basin from May to September during 1980-2012. Meteorology. 43(9):1073–1083. doi: 10.7519/j.issn.1000-0526.2017.09.005. in Chinese.
- Li Q, Wang X, Zhou G, et al. 2020. Study on the temporal and spatial distribution characteristics of short-term heavy precipitation in the southwest vortex rainstorm process in Sichuan Basin. Plateau Meteorol. 39(5):960–972. doi: 10.7522/j.issn.1000-0534.2019.00096. in Chinese.
- Li X, Zhang K, Bao H, et al. 2022. Climatology and changes in hourly precipitation extremes over China during 1970-2018. Sci Total Environ. 839(2022):156297. doi: 10.1016/j.scitotenv.2022.156297.
- Miao A, Wang H, Dong C, Qin A. 2021. Statistical characteristics and risk zoning of different duration heavy rainfall in Shanxi. Nat Hazards. 106(3):2407–2436. doi: 10.1007/s11069-021-04548-5.
- Sen Roy S, Balling RC. 2009. A spatial analysis of extreme hourly precipitation patterns in India. Int J Climatol. 29(3):345–355. doi: 10.1002/joc.1763.
- Sen Roy S, Mathieu R. 2013. Spatial patterns of seasonal scale trends in extreme hourly precipitation in South Africa. Appl Geogr. 39:151–157. doi: 10.1016/j.apgeog.2012.11.022.
- Su JL, Zhang WC, Song JM, et al. 2021. Study on spatio-temporal distribution of hourly precipitation in Yunnan Province. Meteorol Month. 47:133–142. in Chinese.
- Tang H, Gu J, Zhang H, et al. 2011. Analysis of the characteristics of daily variation of precipitation in Southwest China. Plateau Meteorol. 30(2):376–384. (in Chinese).
- Tang Q, Zhu K, Zhang J, et al. 2008. Mesoscale numerical simulation and diagnostic analysis of a heavy rainfall in Chongqing. J Yunnan Univ. 30(S2):302–310. (in Chinese).
- Wang Y, Liu X, Cheng B, et al. 2020. Probability distribution model optimization and application of multiple duration extreme precipitation in Chongqing. J Meteorol Sci. 40(4):560–568. (in Chinese).
- Wang Z, Bai Y, Du Q, et al. 2008. Analysis of a torrential rainstorm triggered by the southwest vortex without surface cold air. Meteorol Month. 34(12):63–71. (in Chinese).
- Wu LG, Zhang Q, Jiang Z. 2006. Three Gorges Dam affects regional precipitation. Geophys Res Lett. 33(13). doi: 10.1029/2006GL026780.
- Wu Q, Xu B, Wang Y, Zhan M. 2021. Intraseasonal evolution and climatic characteristics of hourly precipitation during the rainy season in the Poyang Lake Basin, China. Geomat Nat Hazards Risk. 12(1):1931–1947. doi: 10.1080/19475705.2021.1953619.
- Wu Q, Zhan M. 2020. Climatic characteristics of hourly precipitation(1978-2019) in the Poyang Lake Basin, China. Geomat Nat Hazards Risk. 11(1):1679–1696. doi: 10.1080/19475705.2020.1809535.
- Yang C, Zhang Y, Zhang Y-p, et al. 2020. Analysis on the characteristics of temporal and spatial distribution of hourly precipitation in Chongqing during recent 25 years. Torrential Rain Disasters. 39(1):71–80. (in Chinese).
- Yang J, Su A. 2021. Spatial and temporal distribution characteristics of hourly extreme rainfall in warm season in Henan. Torrential Rain Disasters. 40(2):153–159. (in Chinese).
- Yang P, Xiao Z, Shi W. 2017. Fine-scale characteristics of rainfall in Beijing urban area based on a high-density autonomous weather stations (AWS) dataset. Chin. J. Atmos. Sci. 41(3):475–489. doi: 10.3878/j.issn.1006-9895.1606.16134.(in Chinese).
- Yang X, Zhou H, Zhao K, et al. 2020. Variation features of hourly precipitation in Xinjiang province during 1991-2018. Plateau Meteorol. 39(4):762–773. doi: 10.7522/j.issn.1000-0534.2019.00114.(in Chinese).
- Yang Z, Li M, Qian L, et al. 2020. Different climatic distribution characteristics of hourly extreme precipitation by topography in Anhui Province. J Yunnan Univ (Natl Sci Ed). 42(3):525–533. (in Chinese).
- Yao L, Li X, Zhang L. 2009. Spatial-temporal distribution characteristics of hourly rainintensity in China. Meteorol Month. 35(2):80–87. (in Chinese). doi: 10.7519/j.issn.1000-0526.2009.2.012.
- Zhang D, Yang S, Zhu H, et al. 2023. Quantitative evaluation of heat island effect in Chongqing metropolitan area. J Appl Meteorol. 34(1):91–103. doi: 10.11898/1001-7313/20230108. in Chinese.
- Zhang H, Zhai PM. 2011. Temporal and spatial characteristics of extreme hourly precipitation over eastern China in the warm season. Adv Atmos Sci. 28(5):1177–1183. doi: 10.1007/s00376-011-0020-0.
- Zhang Q, Wang Y, Zhu C. 2004. Study on local climate monitoring system and design of the three Gorges of the Yangtze River. Meteorology. 30(9):31–35. doi: 10.7519/j.issn.1000-0526.2004.9.007. in Chinese.
- Zhang T, Wang Y, Liu B, Sun Y, Chen X. 2021. Variation of hourly extreme precipitation in the three gorges reservoir region, China, from the observation record. Water. 13(20):2855. doi: 10.3390/w13202855.
- Zheng T, Liu X, Wan Q, et al. 2017. Research on the spatial-temporal distribution characteristics and changing trends of graded precipitation in Guangdong Province over the past 50 years. J Trop Meteorol. 33(2):212–220. doi: 10.16032/j.issn.1004-4965.2017.02.007. in Chinese.