
 ?Mathematical formulae have been encoded as MathML and are displayed in this HTML version using MathJax in order to improve their display. Uncheck the box to turn MathJax off. This feature requires Javascript. Click on a formula to zoom.
Abstract
Based on the preliminary reference Earth model, we calculated the temporal variation of tidal shear and normal stresses on the focal fault plane of the Mw7.8 Kahramanmaras, Türkiye earthquake. For earthquakes (M ≥ 4.0) occurring along and around the East Anatolian fault zone (EAFZ) and the Dead Sea fault zone (DSFZ) between January 2002 and December 2022, we analysed tidal stress-related seismicity from two viewpoints: occurrence time and seismic strain. Seismicity was found to be significantly correlated with semi-diurnal tidal shear stress (TSS) prior to the Kahramanmaras Mw7.8 main shock. An area with significant correlation was ∼140 km northeast of the epicentre. For three and more years prior to the Kahramanmaras event, the temporal rate of seismic strain increased during periods of increasing TSS and did not change much during periods of decreasing TSS. From the above results, the increase in TSS may have facilitated the occurrence of earthquakes in the years preceding the Kahramanmaras earthquake. The reason for these tide-triggered earthquakes may be that the seismic region is loaded to a critical state. This observation may shed light on the seismogenic processes that led to the Kahramanmaras earthquake and its precursors.
1. Introduction
It is well-known that a loading cycle usually occurs before great earthquakes (e.g. Barbot et al. Citation2012). When a stressed medium is at a critical stage, a weak increment in stress could trigger some small to moderate-sized earthquakes, even mainshocks. Earth’s tides are known to be a significant source of stress with periods ranging from hours to weeks in their largest harmonics. Tidal triggering of earthquakes is an evergreen topic, and although scientists have done a great deal of work on the correlation between Earth’s tides and earthquakes, the topic remains controversial. Some positive results have been obtained for aftershocks, volcanic earthquakes, and small to large earthquakes (Wilcock Citation2001; Stroup et al. Citation2007; Zhang et al. Citation2007; Li and Jiang Citation2011; Tanaka Citation2012; Vergos et al. Citation2015; Ide et al. Citation2016; Bucholc and Steacy Citation2016; Wang et al. Citation2022; Zaccagnino et al. Citation2022a), but there have been some negative results (Schuster Citation1897; Knopoff Citation1964; Heaton, Citation1982; Rydelek et al. Citation1992; Tanaka et al. Citation2006). It appears that Earth tides are more likely to trigger earthquakes with oblique-slip or dip-slip focal mechanisms (Heaton Citation1975; Tsuruoka et al. Citation1995; Tanaka et al. Citation2002a; Cochran et al. Citation2004; Bucholc and Steacy Citation2016). Tidal stresses have triggered shallow strike-slip earthquakes, but not oblique-slip or dip-slip earthquakes on the Chinese mainland, and not strike-slip earthquakes in California in California, USA (Ding et al. Citation1983; Vidale et al. Citation1998). A focal mechanism dependence on earthquake tidal triggering is not significant for earthquakes in the National Earthquake Information Center (NEIC) catalog (Métivier et al. Citation2009). Earth’s tides also trigger low frequency earthquakes or tremors (Thomas et al. Citation2012; Houston Citation2015; Zaccagnino et al. Citation2022b). In analysis of the earthquake tidal triggering, the researchers considered not only the correlation between Earth’s tides and the occurrence of earthquakes, but also the difference in seismic strain release between earthquakes that occur when tidal stress increases and those that occur when tidal stress decreases (Chen et al. Citation2022).
In the last two decades, a statistically significant correlation between the Earth’s tides and the occurrence of earthquakes has been found to exist in and around the epicentre of some moderate to large earthquakes in the pre-mainshocks. (Tanaka et al. Citation2002b; Tanaka Citation2010, Citation2012; Li and Chen Citation2018; Chen et al. Citation2022). The earthquake tidal triggering in the preseismic stage could be considered as one of the seismic precursors.
On 6 February 2023, an Mw 7.8 earthquake occurred in Kahramanmaras, Türkiye, with its epicentre located at 37.1662° N, 37.0421° E by the USGS Network. It ruptured ∼300 km along the East Anatolian Fault Zone (EAFZ) from the Mediterranean coast in the southwest Türkiye to Malatya in the northeast (Chadha, Citation2023; He et al. Citation2023), its aftershocks are located along the NE-SW direction in a linear belt (Jia et al. Citation2023). The co-seismic deformation and co-seismic faulting model have been obtained for the Mw 7.8 Kahramanmaras earthquake (An et al. Citation2023; Zhao et al. Citation2023). Anomalies in surface, atmosphere and ionosphere occurred about 10 d prior to the 2023 Türkiye Mw 7.8 earthquake (Akhoondzadeh Citation2023; Akhoondzadeh and Marchetti Citation2023). The co-seismic ionospheric disturbances associated with the main event and its strong aftershocks have also been observed (Maletckii et al. Citation2023; Vesnin et al. Citation2023). A model of multi-geosphere co-seismic response associated with the 2023 Turkey events is proposed (Jing et al. Citation2023).
In this study, we examine the correlation between the Earth tide and the occurrence of earthquakes in and around the focal region of the Mw 7.8 earthquake that occurred in Kahramanmaras, southeastern Türkiye on 6 February 2023. We focus on the spatio-temporal variability of the earthquake-tide correlation to detect a possible premonitory tidal triggering prior to this large earthquake. We also examine whether there might be any difference in seismic strain prior to the Mw 7.8 Kahramanmaras earthquake between when tidal stress increases and when it decreases, to further demonstrate the effect of tidal stress.
2. Tectonic setting
The 2023 Kahramanmaras Mw 7.8 earthquake hit the southeastern part of Türkiye. Türkiye lies in the Eastern Mediterranean region of the western section of the Eurasian seismic belt and is one of the most seismically active regions in the world. The tectonic evolution of the Eastern Mediterranean is dominated by the subduction of the Aegean arc and the collision of continents between the Anatolian block and the Caucasus Mountains. The African plate is subducting to the north under the western Türkiye and Aegean Sea regions, causing the continental crust to extend in the Aegean Sea region. Eastern Türkiye, in contrast, is experiencing a shortening and thickening of the crust due to a northward shift of the Arabian plate relative to Eurasia (). The resulting forces caused by pushing by the west subduction zone and converging from the east, cause the Anatolian block to move westward at a rate of 25–30 mma−1 (Bohnhoff et al. Citation2013). The Anatolian block is bound by strike-slip fault zones to the north and east: the North Anatolian Fault Zone (NAFZ) and the EAFZ. The former is located between the Anatolian block and Eurasian plates, and the latter is between the Anatolian and the Arabian plate. The right-lateral-slip NAFZ and left-lateral-slip EAFZ accommodate the westward extrusion of the Anatolian block with respect to the Eurasian and Arabian plates (Jackson and McKenzie Citation1984; McKenzie Citation1972; McKenzie Citation1976). The EAFZ runs southward to meet the Dead Sea Fault Zone (DSFZ). As the African plate and the Arabian plate are moving northward, the discrete boundary between them is formed due to the differential movement. The DSFZ is associated with this process.
Figure 1. Tectonic setting in and around Türkiye. Green stars show the 2023 Mw 7.8 and 7.5 mainshocks occurring at the intersection of the East Anatolian Fault Zone (EAFZ) with the Dead Sea Fault Zone (DSF. cyan bold lines show active fault traces. Circles show epicentres of Ms ≥ 7.0 events from 1900 to 2022; these event data were acquired from the China Earthquake Network Center (CENC). The number beside each circle shows the year in which each earthquake occurred. The blue bold arrow shows the direction in which the Anatolian block moves. The black arrows beside the active fault traces show the directions in which the faults move. The capital letters beside the cyan lines show the names of the active faults. The region enclosed by the yellow box is considered in the present study. The beach ball shows the focal mechanism solution data that were acquired from the USGS earthquake catalogue [https://earthquake.usgs.gov/earthquakes/search/] (NP1: 318°, 89°, −179°; NP2: 228°, 89°, −1°).
![Figure 1. Tectonic setting in and around Türkiye. Green stars show the 2023 Mw 7.8 and 7.5 mainshocks occurring at the intersection of the East Anatolian Fault Zone (EAFZ) with the Dead Sea Fault Zone (DSF. cyan bold lines show active fault traces. Circles show epicentres of Ms ≥ 7.0 events from 1900 to 2022; these event data were acquired from the China Earthquake Network Center (CENC). The number beside each circle shows the year in which each earthquake occurred. The blue bold arrow shows the direction in which the Anatolian block moves. The black arrows beside the active fault traces show the directions in which the faults move. The capital letters beside the cyan lines show the names of the active faults. The region enclosed by the yellow box is considered in the present study. The beach ball shows the focal mechanism solution data that were acquired from the USGS earthquake catalogue [https://earthquake.usgs.gov/earthquakes/search/] (NP1: 318°, 89°, −179°; NP2: 228°, 89°, −1°).](/cms/asset/20f3af51-b540-433c-bf09-b9187a8cbc00/tgnh_a_2284118_f0001_c.jpg)
3. Study region and data used
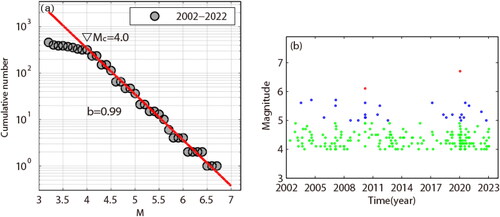
An M w7.8 earthquake occurred in Kahramanmaras, southern Türkiye on 6 February 2023, with an epicentre at 37.22°N, 37.02°E. Based on the focal mechanism solution and aftershock distribution, the rupture occurred on a SW-striking, steeply dipping fault plane with a left-lateral slip (), resulting from the relative motion between the Arabia plate and the Anatolia-Aegean Sea plate. Earthquakes used in this study are from the USGS earthquake catalogue (https://earthquake.usgs.gov/earthquakes/search/). In the experiment, we take earthquakes that occurred in a considerably large region around the epicentre from January 2002 to January 2023, their epicentres were plotted in . We considered an area of 550 km × 330 km larger than the aftershock zone of the Mw 7.8 Kahramanmaras earthquake as the study region. shows the G-R relation for all earthquakes plotted in , it can be considered that earthquakes of M ≥ 4.0 should be complete. In total, 221 earthquakes occurred in the study region. Thereinto, 192 events are in the range of 4.0 ≤ M ≤ 4.9, taking a proportion of ∼87%. The magnitudes versus time for these selected earthquakes are shown in .
Figure 2. (a) The epicentres of aftershocks of the Mw 7.8 Kahramanmaras earthquake. Grey circles show the epicentres of earthquakes of M ≥ 4.0, from 6 to 8 February, 2023. (b) Epicentres of earthquakes (M ≥ 4.0) that occurred from January 2002 to January 2023. The cyan star represents the epicentre of the Mw 7.8 mainshock. The red lines show the active fault traces, and the blue boxed region shows the study region for calculation of the P-value as a function of time.
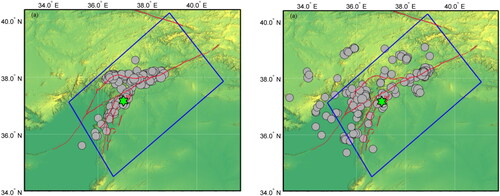
Figure 3. (a) Cumulative distribution of number of earthquakes versus magnitude. (b) Map showing the chronological orders of earthquakes of M ≥ 4.0 in the study region.
4. Analytical method
4.1. The tidal stresses on the focal fault plane of the Mw 7.8 Kahramanmaras earthquake
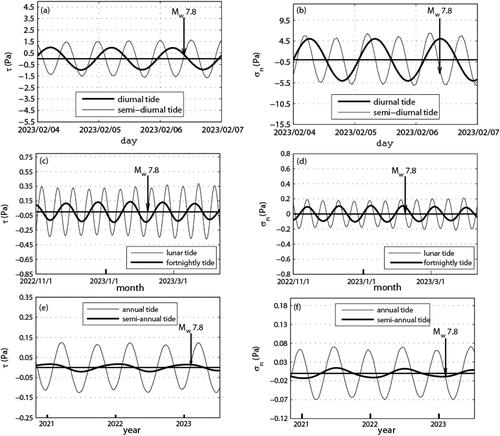
Based on the Preliminary Reference Earth Model (Dziewonski and Anderson Citation1981), we computed the tidal stress components in the Earth’s interior. According to the USGS catalogue, the geometrical parameters of focal fault plane of the Kahramanmaras earthquake are strike 228°, dip 89°. The rake is −1° and the focal depth is 10 km. shows the temporal change series of shear stress τ and normal stress σn caused by the Earth tides on the focal fault plane of the Kahramanmaras earthquake at a depth of 10 km. Since the effective shear stress (or the Coulomb failure stress) τc = τ + μσn is affected by the friction coefficient μ, which cannot be obtained accurately, we only analysed the triggering effect of the shear and normal stresses caused by the Earth tides. The tidal signal composes of several tidal constituents with various periodicities (1 year, half a year, month, half a month, day, half a day, etc.). shows temporal variations of these periodic components caused on the focal fault plane of the Kahramanmaras earthquake at depth of 10 km. At the time of the Mw 7.8 Kahramanmaras earthquake, tidal shear stresses (TSS) with half-year, half-month, and half-day periods increased.
Figure 4. Temporal variations in the stresses caused by the earth tides on the focal fault plane of the Kahramanmaras earthquake at depth of 10 km. (a) The shear stress τ. (b) The normal stress σn. The date is given in the format year/month/day.
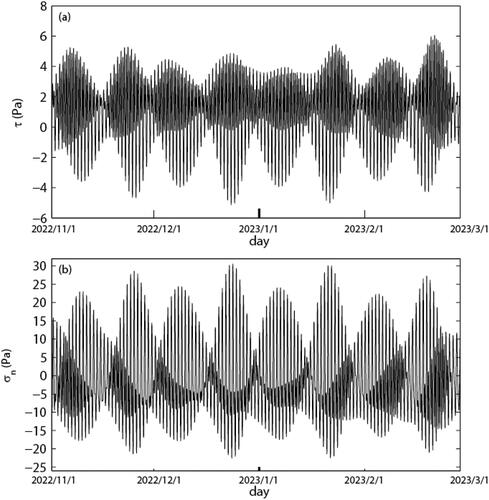
Figure 5. Temporal variations of the stresses caused by the earth tides with different cycles on the focal fault plane of the Kahramanmaras earthquake at depth of 10 km. The left column shows the shear stress τ and the right the normal stress σn. (a) and (b) diurnal and semi-diurnal tides, the date is given in the format year/month/day. (c) and (d) lunar and fortnightly tides, the date is given in the format year/month/day. (e) and (f) annual and semi-annual tides, the date is given in the format year. The downward arrow ‘↓’ shows the occurrence time for the Kahramanmaras earthquake.
4.2. Tidal correlation analysis
We investigated the correlation between the Earth tides and the earthquake occurrence using the Schuster’s test. This method has been applied to investigate tidal triggering of earthquakes (Heaton Citation1975; Tsuruoka et al. Citation1995; Tanaka Citation2010, Citation2012). Based on a temporal change series of the TSS, the phase angle at the occurring time of each earthquake can be calculated. The phase angle is defined as 0° at each maximum of the tidal stress, −180° at the first minimum on the left of the maximum, and 180° at the first minimum on the right one. The phase angle θ at the occurring time of an earthquake is calculated according to the following formula.
(1)
(1)
where te is the occurring time of an earthquake and t0 the time at the maximum of the tidal stress immediately before or after te. t-180 and t180 are the times at the minimum of the tidal stress immediately before and after te, respectively. With the phase angles of all earthquakes, we can statistically judge whether there is a significant correlation between those earthquakes and the tidal stress. The results are valued by p value which is between 0 and 1. In general, if p ≤ 5%, the earthquakes could be non-random. The p value of N earthquakes can be obtained by the following formulas (Heaton Citation1975; Tsuruoka et al. Citation1995).
(2)
(2)
where, θi is the phase angle of the ith earthquake. N > 10 (Heaton Citation1975; Tsuruoka et al. Citation1995).
4.3. Seismic strain analysis
As described above, in analysis of the tide-triggered earthquakes, the occurrence time is usually used to examine the tidal correlations. In the following, we will focus on the effect of the Earth tides on the seismic strain, to examine whether there could be any difference in seismic strain between when tidal stress increases and when it decreases for earthquakes that occurred before the Kahramanmaras earthquake. According to the time series of the TSS caused by the semi-diurnal tide, we computed the temporal rate of TSS, ΔTSS, at the occurring time of each earthquake. When the TSS increases, ΔTSS > 0, the focal region is loaded by the Earth tides and vice versa. Earthquakes were divided into two varieties according to the signs of ΔTSS: positive earthquakes (PEQs) and negative earthquakes (NEQs). The former occurred when ΔTSS > 0 or TSS increases and the latter when ΔTSS > 0 or TSS decreases. Using the above information, we can analyse the characteristics of the seismic strain released by earthquakes occurring at times when the TSS increases and at times when it decreases.
We analysed the proportion of seismic strain for PEQs, Rp, defined as
(3)
(3)
where ε denotes the total seismic strain and εp is the seismic strain of PEQs. As the difference in the length of time between when the rate of the TSS >0 and when the rate <0 can be ignored, if the TSS does not influence the seismic strain for earthquakes, the value of Rp is near 0.5. If increasing TSS does affect seismic strain, Rp should be significantly larger than 0.5, as measured by its z values (Ge and Wang Citation2006). The z value can be calculated as follows:
(4)
(4)
where N is the total number of earthquakes when calculating the corresponding Rp. Let zα denote the critical z value and the values of zα at different significance levels are listed in .
Table 1. The values of zα at different significance levels.
The cumulative seismic strain (CSS) curve over a longer time may be thought of as consisting of a certain number of straight lines with various slopes. As the seismic strain accelerates, the slope of the straight lines will increase and vice versa. Let kp denotes the slope for PEQs and kn that for NEQs, we determine the difference between kp and kn by means of their ratio Rk defined as
(5)
(5)
5. Results
By use of earthquakes (M ≥ 4.4) occurring in the study region, the p value versus time, P(t) curve, was obtained via considering a time window of 7 years moved by 6 months. The p value of each window was calculated according to formula (2), the time of the last earthquake within each window is taken as the time of the p value. The minimum event number in the time windows is 23, the maximum one 45 and the mean 35. The requirement for the analysis can be met (Heaton Citation1975; Tsuruoka et al. Citation1995). We analysed the correlation between the occurrence of earthquakes and the TSS based on the semi-diurnal, diurnal, fortnightly, lunar, semi-annual, and annual tides, respectively, and found that the occurrence of earthquakes significantly correlated with the semi-diurnal TSS in the years leading up to the Mw 7.8 Kahramanmaras earthquake. shows the P (t) curve, the p value started to decrease in early 2016 and has been below 1.0% since December 2020, reached the lowest value (∼0.18%) in December 2022. Earthquakes highly correlated with the Earth’s tides were observed in the 7 years prior to the Kahramanmaras earthquake. For these earthquakes, the distribution of phase angle is shown in . We found that ∼67.4% of them occur at the negative phase angles, corresponding to the increasing stage of the semi-diurnal TSS. The spatial distribution of the p values for earthquakes (M ≥ 4.3) from February 2014 to January 2023 is acquired (). A time interval of 9 years was used to obtain the spatial distribution of the p values. A rectangle region with latitude range from 34°N to 40.5°N and longitude range from 33°E to 42°E was considered. A circular spatial window of a radius of 120 km was used and moved by 0.1° in latitudinal and longitudinal directions. When the number of samples in a window exceeds 10, the p value can be computed. The spatial distribution of p values below 1% was plotted in . It can be seen that the lower p values were concentrated in the northeast of the study region, where earthquakes correlated highly with the Earth tides.
Figure 6. (a) p Value as a function of time (the downward arrow '↓' shows the occurrence time of the Mw 7.8 Kahramanmaras event). (b) Histogram showing the frequency of the phase angle of earthquakes occurring from February 2016 to January. 2023. Thick solid curve denotes sinusoidal function fitted to the frequency distribution. (c) and (d) Spatial distribution of p value within 9 years prior to the Mw 7.8 Kahramanmaras earthquake, the star shows its epicentre. Grey circles show the epicentres of aftershocks.
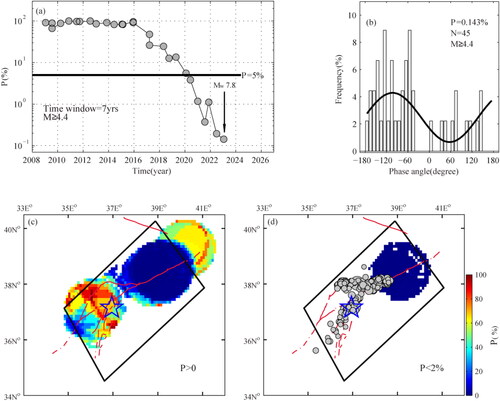
In this study, the positive tidal normal stress denotes that the focal fault plane is stretched by the tides. Since the TSS and normal stress are out phase, when the shear stress increases the normal stress decreases. The decreasing normal stress will weaken the traction acting on the focal fault plane, meanwhile intensify the compression, and consequently increase the friction on the fault. Using the tidal normal stress, similar results to can be obtained with the exception of . Due to the 180° difference of the phase angle between the TSS and normal stress, ∼67% of earthquakes occurred when the phase angle was positive in the normal stress case, corresponding to the decreasing stage of the semi-diurnal tidal normal stress. When the normal stress decreases, the focal fault was pressurized and the friction increases. The increasing friction does not aid the earthquake occurrence.
For earthquakes with a magnitude range of 4.0 ≤ M ≤ 5.5 of the study region, we sorted the earthquakes in chronological ascending order and then accumulated the seismic strain to obtain the CSS versus time by accumulating their seismic strain values. shows the CSS curves of PEQs and NEQs. The CSS curve for PEQs is showed by grey circles; cyan squares indicate the CSS curve for NEQs. The two curves almost covered each other before September 2020. However, they started to deviate rapidly with time, revealing that the seismic strain of PEQs is larger than that of NEQs.
Figure 7. (a) Cumulative seismic strain release ∑ε versus time. The line with ; symbols is for PEQs, and the line with ☐ symbols is for NEQs. (b) Rp versus time, with a moving 9-year time window moved by 6 months. (c) The time rate k of CSSR versus time for both PEQs and NEQs. The orange circles show the time rate k for PEQs, and the cyan squares are for NEQs, with a moving 10-year time window moved by 6 months. (d) Rk as a function of time. The downward arrow shows the occurrence of the Kahramanmaras earthquake.
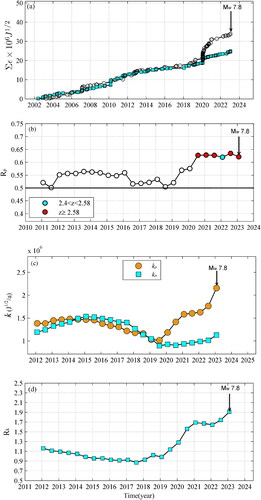
Rp versus time was obtained applying a 9-year time window with a 6-month slip and depicted in . It changed from 0.5 to 0.56 prior to 2019, then started to increase, exceeded 0.6. The z values corresponding to the last six Rp values in are over 2.4, wherein five z values larger than 2.58 are displayed by the red circles, indicating a significant difference between the last six Rp values and 0.5 at least at a 98% confidence level. Thus, the seismic strain was significantly related to the increasing TSS.
Taking a 10-year time window moving in 6-month steps, the observed slope versus time was obtained by fitting the data with straight lines. Both kp and kn are shown in using the orange circles ‘●’ for kp and the cyan squares ‘■’ for kn. If the seismic strain is accelerated for PEQs or NEQs, kp or kn will increase. Up to the middle of 2019 kp and kn were in phase, but no significant difference between them could be found. After that, they were parted, and kp increased vastly with time, whereas kn only increased a little. Thus, in more than 3 years before the Kahramanmaras event, the time rate of seismic strain increased signally when the TSS enhanced, but did not change much when the TSS weakened.
Rk versus time was shown in . It can be seen that Rk was stable near 1.0 before 2019, and then began to ascend rapidly in early 2019, reaching its peak value just preceding the Kahramanmaras earthquake. That means, compared to NEQs, the time rate of seismic strain increased signally for PEQs before the Kahramanmaras earthquake. Just before the Kahramanmaras event, kp increased to ∼1.9 times larger than kn.
6. Discussions
In this article, first, we analysed the correlation between the Earth’s tides and the occurrence of earthquakes prior to the 2023 M w7.8 Kahramanmaras earthquake, then the difference in seismic strain between earthquakes that occur when tidal stress increases and those that occur when it decreases. The obtained results are as follows:
A significant correlation area was found in the northeast of the study region, about 140 km northeast of the epicentre. This region of significant correlation is located in the EAFZ, reflecting the fact that the tectonic stress in the EAFZ has been enhanced to a critical value and that a large earthquake can occur anywhere along the EAFZ, but the initial rupture can occur anywhere in the EAFZ.
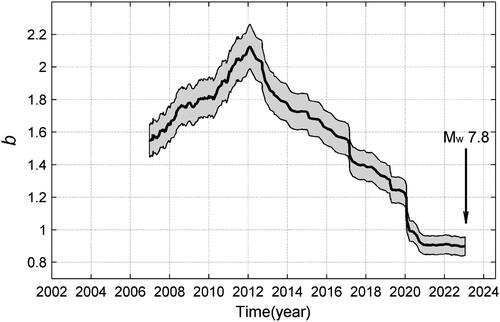
The constant b in the Gutenberg–Richter law log N = a-bM is able to reflect the stress state in the Earth’s crust. When the b-value decreases, the tectonic stress increases (Wyss Citation1973; Smith Citation1981; Narteau et al. Citation2009). We calculated the b-value as a function of time based on the earthquakes that occurred in the study region. shows the curve of the b-value (black thick line) over time. Since the early 2020, the b-value had been remaining low until the occurrence of the Mw 7.8 Kahramanmaras mainshock, reflecting that the EAFZ was under high stress for several years in the pre-quake period.
In the study region, four correlations between the earthquake occurrence and the semi-diurnal TSS, with confidence level greater than 98%, were found in ∼2 years before the occurrence of the Mw7.8 Kahramanmaras event. Among the earthquakes with lowest p values, a majority of these earthquakes occurred in the northeast of the study region at times when the TSS increased.
The proportion of seismic strain released during the increasing periods of the TSS is significantly larger than 0.5 at least at the 98% confidence level from mid-2020 onwards, indicating a significant correlation between the earthquake occurrence and increasing TSS.
For more than 3 years prior to the Kahramanmaras event, the temporal rate of seismic strain increased during periods of increasing TSS and did not change much during periods of decreasing TSS.
As the Kahramanmaras earthquake approached, the ratio of the temporal rate of seismic strain during periods of increasing TSS to that during periods of decreasing TSS increased rapidly, eventually reaching 1.9 ().
We found that the occurrence of earthquakes significantly correlated with the semi-diurnal TSS preceding the Mw7.8 Kahramanmaras earthquake, but the TSS with other periodicities did not correlated with the occurrence of earthquakes. This may be related to the critical stiffness of the focal fault. Slip response amplifies significantly for a narrow range of periods near the critical period Tc when stiffness k is equal to the critical stiffness kc, and at shorter periods when k is greater than kc (Lowry Citation2006).
Earthquakes can be thought of as being caused by mechanical processes. Based on the results of biaxial compression experiments for rocks, a fault will experience two stages before its destabilization: a stage with increasing stress and a sub-instability stage (or critical state), corresponding to two segments of the differential stress-time curve (), divided by the point of the peak stress point (point C), and the destabilization point (B). From point O to point C is the increasing stress stage. From point C to point B is the sub-instability stage, during which the fault, already in a state of deformation dominated by energy release, becomes so unstable that even a weak fluctuation in stress has a distinctive modulating effect on earthquake occurrence. As the degree of fault deformation increases, the quasi-static energy release transforms into irreversible quasi dynamic energy release, finally causing fault destabilization (Ma and Guo Citation2014; Ma Citation2016).
Figure 8. Schematic diagram of differential stress as a function of time (based on rock test results).
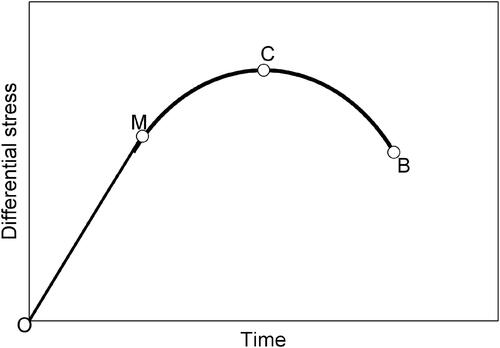
Figure 9. The curve of b-values over time for the study region the thick black line shows the b-values. The light grey area indicates the 95% confidence limit. The vertical arrow ‘↓’ indicates the Mw 7.8 Kahramanmaras mainshock.
7. Conclusions
It can be concluded that the increase in TSS may have facilitated the occurrence of earthquakes in more than 3 years prior to the Kahramanmaras earthquake, whereas its decrease had little effect. This observation could shed light on the processes. Therefore, we suggest that the Earth tide-related seismicity prior to the Mw 7.8 Kahramanmaras, Türkiye earthquake could be considered as one of its precursors.
Acknowledgements
The authors express sincerely thanks to the journal editors and anonymous reviewers for their help and beneficial comments to the manuscript. This study was supported by the China National Key Research and Development Program (2022YFF0800601) and the Special fund of the Institute of Geophysics, China Earthquake Administration (DQJB23Z09) and Beijing Baijiatuan Earth Science National Observation and Research Station..
Disclosure statement
The authors declare that there are no conflicts of interest.
Data availability statement
The data used to support the findings of this study are available from the corresponding author upon request.
References
- Akhoondzadeh M. 2023. Kalman Filter, ANN-MLP, LSTM and ACO methods showing anomalous GPS-TEC variations concerning Turkey’s powerful earthquake (6 February 2023). Remote Sens (Basel). 15(12):3061. doi: 10.3390/rs15123061.
- Akhoondzadeh M, Marchetti D. 2023. Study of the preparation phase of Turkey’s powerful earthquake (6 February 2023) by a geophysical multi-parametric fuzzy inference system. Remote Sens (Basel). 15(9):2224. doi: 10.3390/rs15092224.
- An Q, Feng G, He L, Xiong Z, Lu H, Wang X, Wei J. 2023. Three-dimensional deformation of the 2023 Turkey mw 7.8 and mw 7.7 earthquake sequence obtained by fusing optical and SAR images. Remote Sens (Basel). 15(10):2656. doi: 10.3390/rs15102656.
- Barbot S, Lapusta N, Avouac J-P. 2012. Under the hood of the earthquake machine: toward predictive modeling of the seismic cycle. Science. 336(6082):707–710. doi: 10.1126/science.1218796.
- Bohnhoff M, Fatih B, Georg D, Peter EM, Tuna E, Mustafa A. 2013. An earthquake gap south of Istanbul. Nat Commun. 4(1):1999. doi: 10.1038/ncomms2999.
- Bucholc M, Steacy S. 2016. Tidal stress triggering of earthquakes in Southern California. Geophys J Int. 205(2):681–693. doi: 10.1093/gji/ggw045.
- Chadha R. 2023. An Mw 7.8 earthquake on 6 February 2023 on the East Anatolian Fault, Turkey. J Geol Soc India. 99(4):449–453. doi: 10.1007/s12594-023-2331-z.
- Chen X, Li Y, Chen L. 2022. Analysis of seismic strain release related to the tidal stress preceding the 2008 Wenchuan earthquake. Nat Hazards Earth Syst Sci. 22(8):2543–2551. doi: 10.5194/nhess-22-2543-2022.
- Cochran ES, Vidale JE, Tanaka S. 2004. Earth tides can trigger shallow thrust fault earthquakes. Science. 306(5699):1164–1166. doi: 10.1126/science.1103961.
- Ding Z, Jia J, Wang R. 1983. Seismic triggering effect of tidal stress. Acta Seismol Sin. 5:172–184. https://www.dzxb.org/cn/article/id/0777c193-201e-449c-b735-616b594a2a4a.
- Dziewonski AM, Anderson DL. 1981. Preliminary reference earth model. Phys Planet Iner. 25(4):297–356. doi: 10.1016/0031-9201(81)90046-7.
- Ge XQ, Wang B. 2006. Applied statistics. Beijing China: Social Sciences Academic Press; p. 75–76. in Chinese).
- He L, Feng G, Xu W, Wang Y, Xiong Z, Gao H, Liu X. 2023. Coseismic kinematics of the 2023 Kahramanmaras, Turkey earthquake sequence from InSAR and optical data. Geophys Res Lett. 50(17):e2023GL104693. doi: 10.1029/2023GL104693.
- Heaton TH. 1975. Tidal triggering of earthquakes. Geophys J R Astr Soc. 43(2):307–326. doi: 10.1111/j.1365-246X.1975.tb00637.
- Heaton TH. 1982. Tidal triggering of earthquakes. Bull Seismol Soc Am. 72(6A):2181–2200. doi: 10.1785/BSSA07206A2181.
- Houston H. 2015. Low friction and fault weakening revealed by rising sensitivity of tremor to tidal stress. Nat Geosci. 8(5):409–415. doi: 10.1038/ngeo2419.
- Ide S, Yabe S, Tanaka Y. 2016. Earthquake potential revealed by tidal influence on earthquake size–frequency statistics. Nat Geosci. 9(11):834–837. doi: 10.1038/ngeo2796.
- Jackson J, McKenzie D. 1984. Active tectonics of the alpine-Himalayan belt between Western Türkiye and Pakistan. Geophys J R Astron Soc. 77(1):185–264. doi: 10.1111/j.1365-246X.1984.tb01931.x.
- Jia Z, Jin Z, Marchandon M, Ulrich T, Gabriel A-A, Fan W, Shearer P, Zou X, Rekoske J, Bulut F, et al. 2023. The complex dynamics of the 2023 Kahramanmaras, Turkey. Mw 7.8-7.7 earthquake doublet. Science. 381(6661):985–990. doi: 10.1126/science.adi0685.
- Jing F, Zhang L, Singh RP, Chauhan A, Jiang M. 2023. Quasi-coseismic variations and geosphere coupling associated with the strong 2023 Turkey earthquakes. Sci Total Environ. 907(2024):167963. doi: 10.1016/j.scitotenv.2023.167963.
- Knopoff J. 1964. Earth tides as a triggering mechanism for earthquakes. Bull Seismol Soc Am. 54(6A):1865–1870. doi: 10.1785/BSSA05406A1865.
- Li Y, Chen X. 2018. Earth tidal stress as an earthquake trigger prior to the Wenchuan earthquake, Sichuan, China. Chin Sci Bull. 63(19):1962–1970. in Chinese with English abstract). doi: 10.1360/N972018-00259.
- Li J, Jiang HK. 2011. A statistical analysis on Wenchuan aftershock activity triggered by earth tide. Earthquake Res Chin. 27:363–375. in Chinese with English abstract). http://zgdz.eq-j.cn/zgdz/article/abstract/20110403?st=article_issue.
- Lowry AR. 2006. Resonant slow fault slip in subduction zones forced by climatic load stress. Nature. 442(7104):802–805. doi: 10.1038/nature05055.
- Ma J. 2016. On “whether earthquake precursors help for prediction do exist. Chin Sci Bull. 61(4–5):409–414. doi: 10.1360/N972015-01239.
- Ma J, Guo YS. 2014. Accelerated synergism prior to fault instability evidence from laboratory experiments and an earthquake case. Seismol Geol. 36(3):547–561. doi: 10.3969/j.issn.0253-4967.2014.03.001.
- Maletckii B, Astafyeva E, Sanchez SA, Kherani EA, de Paula ER. 2023. The 6 February 2023 Türkiye earthquake sequence as detected in the ionosphere. J Geophys Res (Space Phys). 128:e2023JA031663. doi: 10.1029/2023JA031663.
- McKenzie DP. 1972. Active tectonics of the mediterranean region. Geophys J R Astron Soc. 30(2):109–185. doi: 10.1111/j.1365-246x.1972.tb02351.x.
- McKenzie DP. 1976. The east anatolian fault: a major structure in Eastern Türkiye. Earth Planet Sci Lett. 29(1):189–193. doi: 10.1016/0012-821x(76)90038-8.
- Métivier L, de Viron O, Conrad CP, Renault S, Diament M, Patau G. 2009. Evidence of earthquake triggering by the solid earth tides. Earth Planet Sci Lett. 278(3–4):370–375. doi: 10.1016/j.epsl.2008.12.024.
- Narteau C, Byrdina S, Shebalin P, Schorlemmer D. 2009. Common dependence on stress for the two fundamental laws of statistical seismology. Nature. 462(7273):642–645. doi: 10.1038/nature08553.
- Rydelek PA, Sacks IS, Scarpa R. 1992. On tidal triggering of earthquakes at CampiFlegrei, Italy. Geophys J Int. 109(1):125–135. doi: 10.1111/j.1365-246X.1992.tb00083.
- Schuster A. 1897. On lunar and solar periodicities of earthquakes. Pro R Soc London. 61:455–465. doi: 10.1038/056321a0.
- Smith WD. 1981. The b-value as an earthquake precursor. Nature. 289(5794):136–139. doi: 10.1038/289136a0.
- Stroup DF, Bohnenstieh DR, Tolstoy M, Waldhauser F, Weekly RT. 2007. Pulse of the seafloor: tidal triggering of microearthquakes at 9°50'NEast Pacific Rise. Geophysical Res Lett. 34:L15301. doi: 10.1029/2007GL030088.
- Tanaka S. 2010. Tidal triggering of earthquakes precursory to the recent Sumatra megathrust earthquakes of 26 December 2004 (Mw 9.0), 28 March2005 (Mw 8.6), and 12 September 2007 (Mw 8.5). Geophys Res Lett. 37(2): L 02301. doi: 10.1029/2009GL041581.
- Tanaka S. 2012. Tidal triggering of earthquakes prior to the 2011 Tohoku-Oki earthquake (Mw 9.1). Geophys Res Lett. 39:L00G26. doi: 10.1029/2012gI051179.
- Tanaka S, Ohtake M, Sato H. 2002a. Evidence for tidal triggering of earthquakes as revealed from statistical analysis of global data. J Geophys Res. 107(B10):2211. doi: 10.1029/2001JB001577.
- Tanaka S, Ohtake M, Sato H. 2002b. Spatio-temporal variation of the tidal triggering effect on earthquake occurrence associated with the 1982 South Tonga earthquake of Mw 7.5. Geophys Res Lett. 29(16):3-1-3–4. doi: 10.1029/2002GL015386.
- Tanaka S, Sato H, Matsumura S, Ohtake M. 2006. Tidal triggering of earthquakes in the subducting Philippine Sea plate beneath the locked zone of the plate interface in the Tokai region, Japan. Tectonophysics. 417(1–2):69–80. doi: 10.1016/j.tecto.2005.09.013.
- Thomas AM, Bürgmann R, Shelly DR, Beeler NM, Rudolph ML. 2012. Tidal triggering of low frequency earthquakes near Parkfield, California: implications for fault mechanics within the brittle‐ductile transition. J Geophys Res. 117(B5):5301. doi: 10.1029/2011JB009036.
- Tsuruoka H, Ohtake M, Sato H. 1995. Statistical test of the tidal triggering of earthquakes: contribution of the ocean tide loading effect. Geophys J Int. 122(1):183–194. doi: 10.1111/j.1365-246X.1995.tb03546.
- Vergos G, Arabelos DN, Contadakis ME. 2015. Evidence for tidal triggering on the earthquakes of the Hellenic Arc, Greece. Phys Chem Earth A/B/C. 85–86:210–215. doi: 10.1016/j.pce.2015.02.004.
- Vesnin A, Yasyukevich Y, Perevalova N, Şentürk E. 2023. Ionospheric response to the 6 February 2023 Turkey–Syria earthquake. Remote Sens. (Basel). 15(9):2336. doi: 10.3390/rs15092336.
- Vidale JE, Agnew DC, Johnston MJS, Oppenheimer DH. 1998. Absence of earthquake correlation with Earth tides: an indication of high preseimic fault stress rate. J Geophys Res. 103(B10):24567–24572. doi: 10.1029/98JB00594.
- Wang W, Shearer PM, Vidale JE, Xu X, Trugman DT, Fialko Y. 2022. Tidal modulation of seismicity at the Coso geothermal field. Earth Planet Sci Lett. 579:117335. doi: 10.1016/j.epsl.2021.117335.
- Wilcock WSD. 2001. Tidal triggering of microearthquakes on the Juan de Fuca Ridge. Geophys Res Lett. 28(20):3999–4002. doi: 10.1029/2001gI013370.
- Wyss M. 1973. Towards a physical understanding of the earthquake frequency distribution. Geophys J R Astron Soc. 31(4):341–359. doi: 10.1111/j.1365-246X.1973.tb06506.x.
- Zaccagnino D, Telesca L, Doglioni C. 2022a. Correlation between seismic activity and tidal stress perturbations highlights growing instability within the brittle crust. Sci Rep. 12(1):7109. doi: 10.1038/s41598-022-11328-z.
- Zaccagnino D, Telesca L, Doglioni C. 2022b. Variable seismic responsiveness to stress perturbations along the shallow section of subduction zones: the role of different slip modes and implications for the stability of fault segments. Front Earth Sci. 10:989697. doi: 10.3389/feart.2022.989697.
- Zhang J, Qi QW, Yang LZ, Chen RH, Wang WX. 2007. A study on tidal force/stress triggering of strong earthquakes. Chin J Geophys. 50(2):448–454. in Chinese with English abstract). http://www.geophy.cn/article/id/cjg_664.
- Zhao JJ, Chen Q, Yang YH, Xu Q. 2023. Coseismic faulting model and postseismic surface motion of the 2023 Turkey–Syria earthquake doublet revealed by InSAR and GPS measurements. Remote Sens. (Basel). 15(13):3327. doi: 10.3390/rs15133327.