
Abstract
The inventory and categorization of an extensive coastal boulder assemblage originating from storm wave transport on the coastline of Fenoliga Island (Northern Adriatic Sea, southern Istria, Croatia) are presented and discussed herein. The study adopted the use of a commercial Uncrewed Aerial Vehicle (UAV) and Structure from Motion-MultiView Stereo (SfM-MVS) photogrammetry for the construction of a 3D model of the island. A Digital Elevation Model (DEM) and an orthomosaic were produced and employed for the mapping of the boulder assemblage in a GIS. In total, 592 boulders were identified and mapped. Using SfM-MVS-derived products allowed for the identified boulders to be categorized based on size classification. Amassed data relating to the boulder characteristics was inserted and stored in a GIS, including the results of a comparative assessment with historical Google Earth imagery which enabled the ‘quantification of boulder transport over a 9-year timeframe’. Field evidence indicates that boulders were created in-situ via the quarrying of bedrock strata by breaking waves causing increased water pressure within preexisting surfaces of weakness such as bedding planes and sub-vertical fractures. Once detached, the boulders were transported and deposited during storm wave events. Repeated storm events can further displace previously detached clasts.
1. Introduction
Rocky coasts are known to preserve signatures of historic and contemporary storm events in the form of boulder deposits (Bird Citation2011; Cox et al. Citation2019). Individual clasts are detached from bedrock, mobilized and subsequently deposited by storm waves (Bird Citation2011; Hastewell et al. Citation2020a). Buchanan et al. (Citation2020) studied the erosion of rocky shore platforms by block detachment from layered stratigraphy. Previous analysis of these deposits has addressed the complex geomorphic and hydrodynamic processes that play an important role in the evolution of rocky coasts and coastal hazard assessments (e.g.; Biolchi et al. Citation2019a; Scicchitano et al. Citation2020; Nandasena et al. Citation2022).
There is much conjecture within the discipline of coastal geomorphology regarding the agent of transport of these boulders which has created the ongoing ‘storm vs. tsunami’ debate (Lorang Citation2011). This is particularly significant in the Mediterranean region, which is considered to be more sheltered from open ocean dynamics yet is subject to seismic activity and associated wave processes. Many studies have attributed such boulder deposits as being tsunami derived (Kelletat and Schellmann Citation2002; Scheffers Citation2008; Mottershead et al. Citation2014). However, recent research has established that storm wave competence has previously been underestimated, in both semi-enclosed inland seas (Biolchi et al. Citation2019a) and open coasts, where Cox et al. (Citation2018) identified contemporary storm-induced boulder transport on the exposed cliffs of the Aran Islands (West Ireland). Most significantly, the latter study identified a clast in excess of 600 t, at an elevation of 2.5 meters above sea level (asl) which was reportedly transported as a result of storm wave exposure. Although smaller in scale, and storm wave competence, boulder transport processes and mechanisms have been recorded in semi-enclosed coastal basins, such as the Adriatic Sea in the Mediterranean (Biolchi et al. Citation2019a, Citation2019b; Korbar et al. Citation2022) and the Solent on the south coast of England (Hastewell et al. Citation2019, Citation2020a).
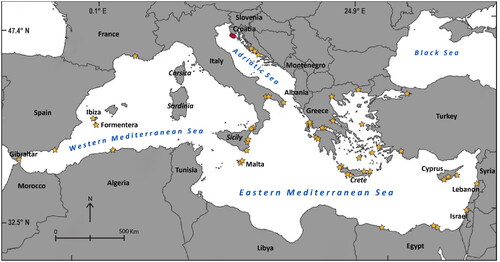
The central part of the Mediterranean Sea is often subject to strong winds and large waves related to dynamic marine storms which are common during autumn and winter months. In recent years an increase in the occurrence of violent tropical-like cyclonic events has facilitated the translocation of large boulders on rocky Mediterranean coasts (Biolchi et al. Citation2016). Subsequently, displaced boulders have been shown to be related to historic storm events in several studies in Mediterranean region (e.g. Barbano et al. Citation2010; Paris et al. Citation2011). Coastal boulder accumulations partially or totally related to dynamic storm waves have been found in Cyprus (Evelpidou et al. Citation2020), the Balearic Islands (Roig-Munar et al. Citation2019), Gibraltar (Mottershead et al. Citation2014), Provence (France) (Vella et al. Citation2011), Greece (Dominey‐Howes Citation1998; Scheffers and Scheffers Citation2007; Scheffers Citation2008), Turkey (Öğretmen et al. Citation2015), Israel, Algeria (Maouche et al. Citation2009), Lebanon (Mottershead et al. Citation2014), Egypt (Shah-Hosseini et al. Citation2016), Malta (Biolchi et al. Citation2016; Causon Deguara and Gauci Citation2017; Mottershead et al. Citation2020; Causon Deguara et al. Citation2022), Sicily (Barbano et al. Citation2010), and Apulia (Mastronuzzi and Sansò Citation2004) ().
Figure 1. Yellow stars show the spatial distribution of boulder deposits around the Mediterranean Sea (modified from Mottershead et al. Citation2018). most of these deposits are reportedly of mixed origin (i.e. storm and tsunami). the red dots indicate the boulder accumulations recently discovered in north Croatia (Biolchi et al. Citation2019a,Citationb).
The burgeoning interest in documenting coastal boulder deposits has, in recent years, been aided by the use of UAVs (Yao et al. Citation2019). Technological advances have increased the accessibility of relatively low-cost devices primarily via the manufacture of low-weight components, improved built-in camera quality, Global Navigation Satellite Systems (GNSSs), inertial sensors, and improved battery operating capacity. This has been further supplemented by the increasing availability of geospatial software (Giordan et al. Citation2018). As a consequence, UAV surveys are widely used in the study of different natural hazards such as deep-seated landslides, rockfalls, subsidence phenomena, floods, marine cliff retreat, and boulder transport studies (Fernández et al. Citation2016; Giordan et al. Citation2017; Izumida et al. Citation2017; Piras et al. Citation2017; Saroglou et al. Citation2018; Devoto et al. Citation2020; Cheng et al. Citation2021; Gaidi et al. Citation2021; Demurtas et al. Citation2022; Furlani et al. Citation2022; Causon Deguara et al. Citation2022; Marr et al. Citation2023). UAVs offer several advantages as a survey technique including (i) real-time applicability; (ii) flexible survey planning; (iii) low-cost field surveys when compared with other resource-intensive survey techniques and devices (Rossi et al. Citation2018); (iv) the ability to acquire geospatial data from unsafe and remote locations with limited risk; (v) the ability to acquire large datasets of High-Resolution (HR) images; (vi) the capacity to minimize mapping surveys reducing time-consuming field campaigns; and (vii) monitoring the erosion of shore platforms (Yuan et al. Citation2022; Knight et al. Citation2023).
The acquisition of UAV images for the generation of SfM-MVS photogrammetry products such as HR orthomosaics is vital for boulder mapping and monitoring which typically requires centimeter resolution (Biolchi et al. Citation2019b). The comparison of pre- and post-event images can help establish whether boulder transport has occurred following exposure to storm waves and/or identify newly detached boulders quarried from the sea floor and deposited upon rocky coastal exposures. The SfM-MVS photogrammetry technique (Snavely et al. Citation2006; Furukawa and Ponce Citation2009) supported by UAV Digital Photogrammetry (UAV DP) has been widely used in coastal boulder transport studies (Westoby et al. Citation2018). This study adopts UAV data to investigate an accumulation of coastal boulders located on Fenoliga Island, off the coast of the Premantura Peninsula, Croatia, and further documents their current location and displacement. Not far from Fenoliga Island, and precisely 1.7 km east from it along the coast of the Premantura Peninsula, Biolchi et al. (Citation2019a) documented an extensive accumulation of coastal boulders. Fourteen boulders from the Premantura assemblage were reportedly transported and/or rotated during a severe storm, named ‘Vaia’, which hit the northern Adriatic coast on October 29, 2018 (Biolchi et al. Citation2019b). The authors reported that the wave height at the breaking point for the Vaia storm was 13.6 m, therefore higher than the theoretical wave heights needed to move or transport the boulders at Premantura. We herein, further this work by using UAV SfM-MVS photogrammetry to map and characterize the coastal boulders that populate the coastal fringes of Fenoliga Island. A total of 592 boulders were mapped and stored in a GIS. The resulting digitized boulder polygons were analyzed to provide axial dimensions (‘a’ and ‘b’ axes) of the identified boulders. Additional 3D model-based geotechnical analysis was also undertaken by extracting bedding and fracture attitudes to determine the significance of geological discontinuities on boulder genesis. Finally, a comparative assessment was conducted between Google Earth (GE) imagery from 2013, and the UAV-derived orthophoto of Fenoliga Island from 2022. The intention is to use widely available, publicly accessible data as a tool for documenting and quantifying boulder transport. The amassed, multiple data sources will provide a clearer insight into rocky coast evolution and the associated processes and mechanisms that facilitate geomorphological change.
2. Study area
The Adriatic Sea is a partially enclosed basin located in the northern Mediterranean region (), which experiences three primary winds (). These are the sirocco (in Croatian ‘jugo’) blowing from the southeast; the bora (in Croatian ‘bura’) blowing from the northeast; and the libeccio, blowing from the southwest (Biolchi et al. Citation2019a, Citation2019b). The sirocco is known for generating the waves of greatest magnitude in the northern Adriatic Sea, due to the longer fetch distance exceeding 700 km (). The wave rose () indicates the frequency of the waves’ direction within the Adriatic basin which is predisposed by the surrounding orography (Katalinić and Parunov Citation2021).
Figure 2. (a) Location of the Istrian peninsula and Fenoliga Island; (b) the longest fetch distance associated with the sirocco; (c) wind frequency averaged over 30 years (www.meteoblue.com); (d) wave frequency for north Adriatic (Katalinić and Parunov Citation2021); and (e) geological map of the Istrian Peninsula (derived from geological map of Croatia in scale 1:300.000 produced by hrvatski geološki institut (Citation2009)).
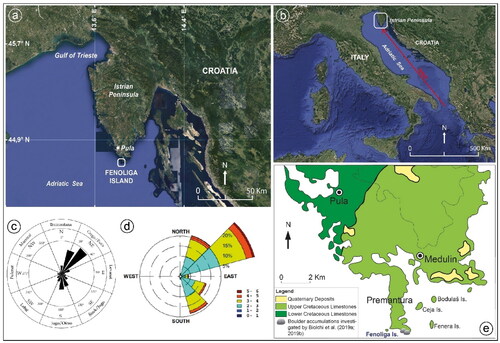
Studies conducted between 1978 and 1986 at a location within the Adriatic 50 km southwest of the Premantura Peninsula, recorded significant and maximum wave heights of 5.3 and 10.8 m, respectively (Biolchi et al. Citation2019b). In contrast, the other two winds (i.e. bora and libeccio) generate smaller waves in the same region (Smirčić et al. Citation1996). In addition to creating large waves, the sirocco is also reported to produce severe storm surges and an associated increase in sea levels in the northern Adriatic Sea, particularly between November and February (Biolchi et al. Citation2019b). Historically, this has resulted in incidents of coastal flooding in the region (Cerovečki et al. Citation1997). Extreme sea levels can reach up to 1.5 m above mean sea level, due to a combination of tides, storm surges, and the Adriatic seiche (Međugorac et al. Citation2015; Raicich Citation2015). Furthermore, meteotsunamis, tsunami-like waves of meteorological origin, reportedly elevated the sea level along the Istrian coast by a few tens of centimeters (Šepić et al. Citation2015; Vilibić and Šepić Citation2009).
Tides are of the semi-diurnal type, with mean spring-tide values of 0.86 m in Trieste, and mean neap-tide values of 0.22 m (Dorigo Citation1965; Polli Citation1970). The concurrence of southeasterly winds and low atmospheric pressure, seiches and spring tides can cause a sea-level rise up to 1.80 m (Stravisi Citation2003). Fenoliga Island is located 255 m west of the Premantura closest coastline. This low-lying, uninhabited island covers an area of approximately 0.025 km2, has a maximum elevation of 6.3 m asl, and a perimeter of 614 m. The coastline is characterized by exposed carbonate bedrock composed of Late Cretaceous peritidal limestones (Polšak Citation1965). The bedrock consists of concordant, well-bedded, white-grey limestone layers between 0.1 and 1.5 m in thickness. The beds are gently dipping towards the east and are characterized by the presence of sub-vertical fractures.
Two carbonate lithofacies can be discerned; white, massive, light-grey micritic limestones predominate on the western side of the island while the eastern side is characterized by rudist biostromes. Radiolitid rudists occur in dense agglomerations, lithified in vertical to sub-vertical (life) positions. Interstices between the encased shells are filled with fine skeletal detritus, while the upper bedding planes reveal evidence of one hundred and forty-six dinosaur footprints (Mezga and Bajraktarević Citation1999; Korbar et al. Citation2002). The bedding attitude is gently dipping toward the east, and boulders are accumulated predominantly within the washed zone.
identifies the geomorphic, and visual contrast between the exposed, shallow sloped rocky foreshore which encircles the island perimeter and the raised vegetated plateau built of superficial deposits, which sits at a maximum 6.3 m asl and dominates the inner island terrain. The number of detached boulders in this elevated zone is limited in comparison to the lower rocky foreshore ().
Figure 3. (a) Landsat image of Fenoliga Island (Google Earth, 2022); (b) oblique view of the sloping coastal profile taken in the southern part of the island where the boulders are most abundant.
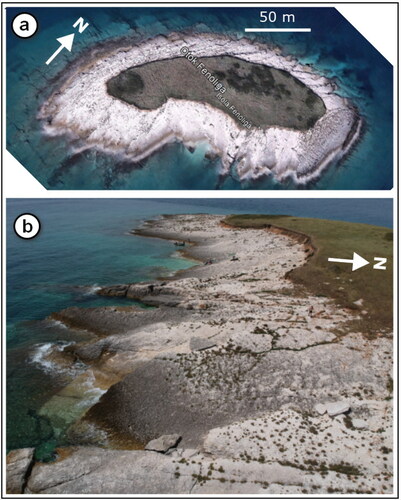
The sparse distribution of boulders located close to the inland fringes of the vegetated area suggests either a topographic constraint, and/or an upper threshold to storm wave competence and subsequently boulder transport.
This study area was selected as: (i) the island is located close to Premantura Peninsula, an area that has previously been studied for storm-induced boulder transport (Biolchi et al. Citation2019a, Citation2019b); (ii) the wave exposure to the south by the sirocco wind and long fetch (ca. 700 km), (iii) the islands low-dip angle of discontinuous limestone layers, and (iv), the low coastal elevation are predisposed for the accumulation of coastal boulders.
3. Methodology
3.1. Survey and SfM-MVS photogrammetry workflow
The inventory of storm wave boulders in the study area was completed by creating a DEM, and an orthomosaic of Fenoliga Island at a centimeter resolution. This level of detail was achieved by following a methodology that consists of the following steps: (i) aerial photo acquisition using a UAV device; (ii) collection of GNSS data for georeferencing; and, (iii) adopting the SfM-MVS photogrammetry workflow to generate outputs. Boulder distribution, mapping, and classification of SfM products were later provided through a GIS. The aforementioned steps are further described herein.
3.2. UAV survey
The UAV used was a DJI SparkTM (DJI, Nanshan District, Shenzen, China). This model is a Vertical Take-Off and Landing (VTOL) quadcopter which is capable of flying for up to 15 min in favorable conditions (e.g. no wind and an operating temperature between 0 °C − 40 °C). According to the UAV weight classification developed by Arjomandi et al. (Citation2006), the Spark is considered a micro drone, weighing less than 5 kg. The Spark is equipped with an 11.8-megapixel and 1/2.3″ CMOS camera sensor with an f/2.6 wide-angle lens (25 mm equivalent) mounted on a 2-axis gimbal stabilizer (pitch and roll) ().
Table 1. Main characteristics of the DJI SparkTM.
The acquisition of aerial imagery was planned using the DJI Flight Planner software (https://www.djiflightplanner.com/) and the Litchi software (https://flylitchi.com/). The field survey was carried out, under favorable flight conditions on June 27, 2022. The flight was pre-programmed to be flown at a constant speed of 11.5 km per hour, capturing images every 2 s at a fixed altitude of approximately 30.48 m (100 feet) above ground level. The camera was positioned in a fixed orientation to the ground (camera pitch of −85°). At these predetermined settings, each photo covered an area of approximately 34 m x 42 m (∼8270 pixels/m). Limited by battery capacity (∼15 min), three separate flights were completed to ensure comprehensive coverage of the island. A total of 990 aerial images were acquired.
3.3. GNSS survey
The coordinates of four Ground Control Points (GCPs) used to geocode the DP products were calculated using GNSS (). The measurements were performed with two double-frequency receivers capable of tracking both NAVSTAR and GLONASS constellations in a relative positioning mode (Hofmann-Wellenhof et al. Citation2001). The reference station was installed on Fenoliga Island to minimize the distances, and optimizing the real-time computation of the baseline vector. The sampling rate was set at 1 s, the time of acquisition at each GCP was 2 min and the cut-off angle was 15°. The precise coordinates of the reference station were calculated during post-processing of the phase measurements simultaneously observed at the station in Pula, Croatia (PULAH00HRV), part of the EUREF Permanent GNSS Network.
Table 2. Coordinates of GCPs (WGS 84/UTM zone 33 N (EPSG:32633).
3.4. Photogrammetric processing – generation of 3D model and orthomosaic
Agisoft Metashape software was used to process the UAV images. This software is robust and widely used in the 3D reconstruction of digital images (Verhoeven Citation2011). In total, 990 images were loaded in Metashape () where the alignment step was launched using high accuracy and no point limit settings. This first task involves the use of SfM algorithms (Ullman Citation1979) to determine the location of any point on the scene by matching and subsequently analyzing the 2D coordinates of pixels within the different images (Grün et al. Citation2004; Szeliski Citation2011). The matched tie points constitute a sparse point cloud of the reconstructed scene composed of ∼3.6 M points (). These points were later filtered via the gradual selection tool in Metashape to ∼1 M points while optimizing the camera alignment. From the 990 images captured, 909 were successfully aligned using this process. Non-aligned images were discarded as the photographs presented with a large proportion (>90%) of submerged ground. Before cloud filtering was applied, the position of the four GCPs (, ) was used to georeference the 3D model. Once GCPs were included, Metashape provided the error associated with these points compared with the value estimated through the SfM reconstruction. This error value ranged between 1.2 cm to 4.3 cm () and was considered by the scope of the work to be an acceptable margin of error.
Figure 4. Processing workflow using Metashape for the creation of the virtual study area model. (a) Photos were captured by three UAV flights and were later imported into Metashape for SfM-MVS processing. (b) The result of the photo alignment was a sparce point cloud that, (c) after the inclusion of the 4 GCPs was (d) densified. (e) The mesh was obtained from the filtered dense cloud and, (f) textured. A magnification of the textured mesh depicting a GCP is shown. (g) The DEM; and, (h) the orthomosaic used in GIS.
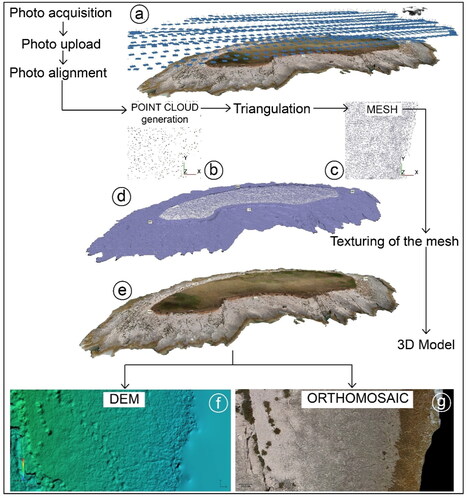
Table 3. Coordinate error of GCPs. In the last column in brackets are indicated the number of projections of the GCPs.
The second step in the Metashape process is the dense point cloud reconstruction, which involves the densification of the sparse cloud using MVS algorithms (e.g. Seitz et al. Citation2006), to complete the full SfM-MVS workflow (Carrivick et al. Citation2016). Following a filtering process, based on point confidence, the resulting dense point cloud (consisting of ∼66.5 M points and a point density of ∼2660 points/m2) was complete (). From this dense point cloud, a mesh consisting of ∼18.7 M irregular triangles was generated in Metashape (). This was subsequently cleaned and filtered before applying the mesh texture (). This was achieved using the texture map functionality with a resolution of 8192 × 8192. The final steps in Metashape were the generation of a DEM () and an orthomosaic (i.e. an orthophoto; ) of Fenoliga Island, at 2.15 cm/pixel and 1.07 cm/pixel resolutions, respectively.
The completion of the DEM and orthomosaic formed the basis for undertaking the boulder mapping process and subsequent analysis as detailed by Sedrati et al. (Citation2022).
3.5. GIS analysis for boulder inventory and size categorization
The orthomosaic with a resolution of 0.01 m was inserted in a GIS, and was used to generate an inventory of the limestone boulders that populate Fenoliga Island. The identification of boulders was also carried out by means of the DP-derived DEM. The boulders were digitized and stored in QGIS using an ESRI shapefile. The position relative to the centroid in decimal degrees in WGS84/UTM zone 33 N - EPSG:32633, was determined using the calculation function x($geometry) for longitude and y($geometry) for latitude. To help locate the boulders and improve their digitization, the DEM was used. The coastline was also digitized using a line shapefile by manually digitizing the contour of the coast from the orthophoto. This was undertaken in order to later calculate the distance between each boulder and the coastline (‘Distance_lenght’ attribute in ), with the aim of assessing the spatial distribution of boulders relative to the coastline, an approach adopted by Etienne and Paris (Citation2010). Prior to calculating the distance of each boulder from the coastline the vertices of each polygon corresponding to the boulder was extracted using the function ‘extract vertices’, and the ‘interpolated points’ tool that interpolate a point along lines at a set distance of 0.1 m. Using the ‘shorter line between features’ toolbox function the distance values were created, rounded and recorded as an attribute feature. The boulders were also categorized in accordance with the size classification proposed by Terry and Goff (Citation2014), which is based on the length of the intermediate axis referred to herein as the b-axis. By entering the ‘Minimum bounding boxes’ function in the toolboxes, it was possible to create rectangular boxes around the irregular polygons representing the boulders. This enabled the allocation of the correct axis values to the respective boulders. The longer side of the box corresponding with the major a-axis, while the shorter side of the box corresponds with the intermediate b-axis. Unfortunately, it was not possible to obtain an accurate value for the c-axis using the DEM obtained from the UAV-DP technique as many of the boulders were imbricated on top of each other, therefore, the elevation data and c-axis measurement did not accurately reflect the correct axial value (Causon Deguara et al. Citation2022). All observable and measurable boulders with major axis dimension greater than 0.4 m were digitized. This size threshold was arbitrarily defined and evaluated as necessary during digitization to reduce the potential for inadvertently recording boulder transport that may have been attributed to anthropogenic movement, e.g. tourists moving smaller, lighter boulders to secure tents and beach umbrellas. The grain size classification was assigned to each identified clast using the field calculator functionality in QGIS. Two queries were applied: (i) enabled the identification of the grain size classification based on the b-axis measurement; and, (ii) returned the grain size classification descriptor (e.g. Boulder-Very coarse). The boulder classification data was established via a query-based methodology.
Table 4. Attributes of the ESRI shapefile named ‘boulders_calc_b_axis’.
Using the ‘contour’ function, under ‘extraction’ from the ‘raster’ bar, contour lines were extracted from the DEM with a distance of 1.0 m and were saved as ‘contour_lines_1m’. Using the ‘sample raster value’ tool, the point elevations were extracted from the DEM. The elevation data was later applied to create the coastal terrain profiles using the ‘terrain profile’ plugin functionality enabling the spatial analysis of boulder distribution. For comparison, Google Earth (GE) images were also used for the detection of boulders and their size categorization using the same methodology as in QGIS. The imagery was also used for observing the configuration of boulders in the study area over a range of different time intervals. The GE imagery used in the temporal assessment was retrieved from satellite Landsat/Copernicus data, acquired on February 2, 2013. This specific date was selected as it provided the highest image quality data coverage of the study area. The accuracy of the Landsat image used was approximately 2 m, and the resolution of the GE image used for mapping the boulders was approximately 15 cm/pixel. The Landsat image (2013) was compared with the UAV-derived orthomosaic (2022) using QGIS. The distance (m) and direction of displacement (°) of the boulders in the orthophoto were measured relative to the baseline reference position from 2013. A measured displacement vector was obtained by calculating the distance of the same boulder in 2013 and 2022 with respect to the centroid of the reference boulder polygon. The resulting outputs were used to create a georeferenced layer consisting of the attributes which describe both the translocation distance and transport angle.
3.6. Structural discontinuities and boulder genesis
The 3D model was used for the digital data extraction of the penetrating geometry of the fracture features and bedding (e.g. Tavani et al. Citation2016; Seers et al. Citation2022). In this case, the 3D manual polyline interpretation of the textured mesh was conducted using the free software platform OpenPlot (Tavani et al. Citation2011; Tavani et al. Citation2014) and the methodology outlined in Corradetti et al. (Citation2018).
4. Results
4.1. UAV-derived inventory of coastal boulders
The UAV-derived SfM-MVS photogrammetry data products produced in this work enabled the realization of the following inventory. A total of 592 boulders were identified, digitized as polygons, and stored in the ESRI shapefile (, ). The resulting visual data highlights the greater concentration of boulders along the southern coast of Fenoliga. However, tens of clasts are also present in the eastern and northern sectors (). Each clast is attributed with a data number corresponding to IDs of the boulders () and classified as specified.
Figure 5. The spatial distribution of coastal boulders (white polygons), the red arrow indicates the largest boulder on the island (b-axis length is 4.81 m).
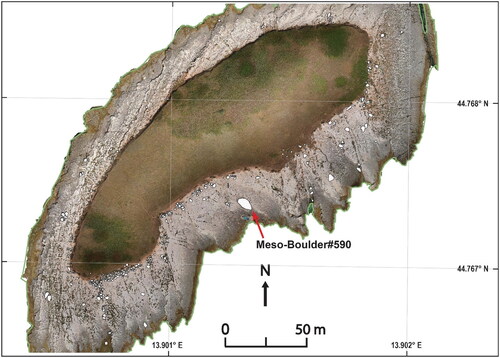
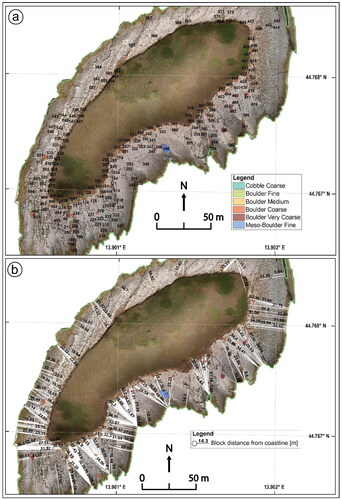
Figure 6. QGIS representation of boulder dataset analysis. (a) Spatial distribution of boulders according to size (Terry and Goff Citation2014); (b) minimum distance of the boulders from the coastline.
During the digitization of the boulders, the DEM highlighted the presence of dinosaur footprints, that were not noticed during the photo acquisition nor from the other SfM-MVS products.
4.2. Boulder size classification and coastline distance analysis
According to the classes defined in the sedimentary nomenclature developed by Terry and Goff (Citation2014), ‘boulders’ (n = 565, 0.25–8.2 m) dominate with respect to the other size classes (), representing 95.4% of the total population. shows the spatial distribution of clasts categorized by size (b-axis measurement) and indicate the minimum distance from the shoreline. For the purpose of spatial data representation, different color scales were selected to represent each boulder class as detailed in . The latter lists the boulder population for each size category. The majority of clasts recorded in the study area were classified as ‘Boulder-Medium’ (0.5 − 1.0 m), and ‘Boulder-Fine’ (0.25 − 0.5 m) representing 41.4% (n = 245) and 37.7% (n = 223) of the total number of documented boulders respectively. The ‘Boulder-Coarse’ (1.0 − 2.0 m) classification represents 15.0% (n = 89), ‘Cobble-Coarse’ (0.128 − 0.25 m), 4.6% (n = 27), ‘Boulder-very coarse’ (2.0 − 4.1 m), 1.2%, and ‘Meso-boulder-Fine’ (4.1 − 8.2 m) 0.1%.
Table 5. Boulder size analysis based on the nomenclature proposed by Terry and Goff (Citation2014).
4.3. Google Earth inventory of coastal boulders
The GE analysis used Landsat imagery obtained in 2013 and enabled the identification and categorization of 73 boulders scattered on the coastal fringes of Fenoliga Island ().
Figure 7. The image depicts the digitized, and numbered, detached boulders located on the rocky foreshore of Fenoliga Island using Google Earth, Landsat imagery from February 2, 2013.
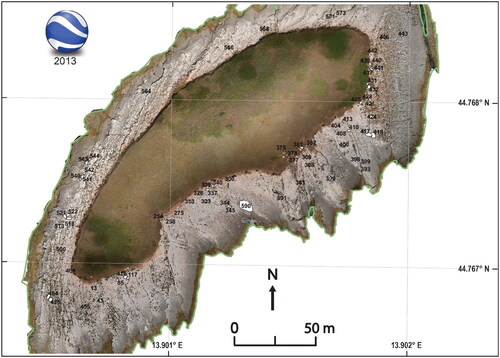
The digitization of the boulders observed on the GE imagery was achieved using the same method that was applied to the UAV-derived orthomosaic. A layer consisting of boulder polygons (n = 73) was created enabling the collation of positional coordinates with respect to the centroid of the polygon. The boulders mapped using the GE 2013 historic images () were concentrated on the S-SE side of the island. Many of the detached boulders that were readily identifiable in the 2022 UAV imagery were not detected using GE due to boulder size, image resolution and/or the light effects at the time of the satellite passing. Furthermore, it is anticipated that a proportion of the boulders identified in 2022 may not have been detached in 2013.
Figure 8. (a) map view of boulder movements for the period 2013-2022 comparing the position using Google Earth imagery (February 2, 2013), and the UAV-derived orthomosaic (June 27, 2022); (b) view of boulder displacement #344, #345, and #590; (c) view of boulder displacement #417, and #418.
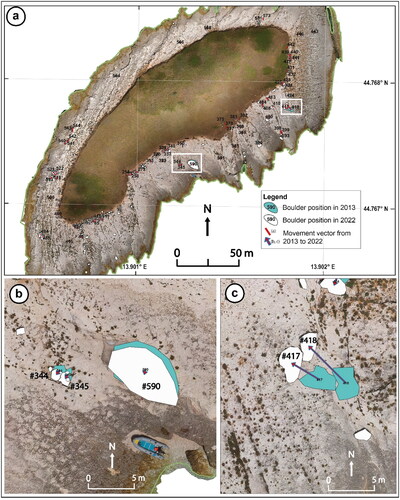
The result of the comparative analysis of the two databases that are the Landsat image (2013) and the UAV-derived orthomosaic (2022) () shows that some of the boulders were indeed displaced during this timeframe (). The maximum measured displacement vector was 4.98 m in a NW direction (Boulder #418) followed by Boulder #417 (). The largest clast measured within the coastal boulder accumulation (Meso-Boulder #590) was also identified as having been displaced ( and ). Some of the detected clasts showed minimal seaward displacement in a NE-SW direction, potentially as a result of the wave return backwash, and the constraining influence of other boulders and/or topography. This is most evidently displayed in , where the three depicted boulders (#344, #345 and #590) all appear to have been prevented from further seaward transport having come to rest against a raised scarp. Contrary to this is an observed SW-NE boulder transport pathway. This is aligned with the direction of wave approach from the southerly storm activity associated with the sirocco. lists the five boulders that were subject to the largest displacement between 2013-2022.
Table 6. List of the five boulders that have undergone the greatest displacement during the period February 2, 2013 to June 27, 2022.
4.4. 3D model-derived structural discontinuity orientations
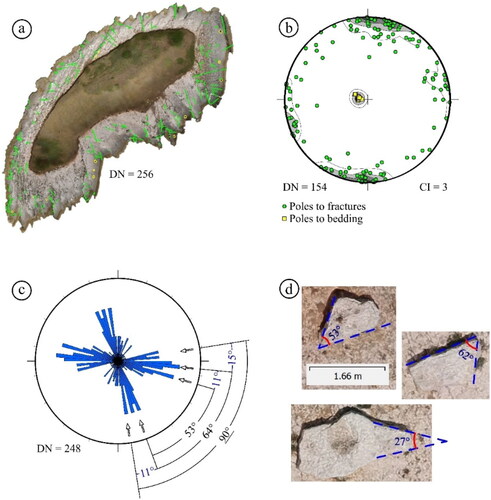
Attitudes of both fractures and bedding were extracted using OpenPlot software on the textured mesh (). Fractures show penetrating geometries that were extracted by the best-fit of points digitalized along their intersections with the topography. Bedding attitudes are well exposed in 3D and were obtained from the mesh orientation. Poles to bedding orientations are well-clustered () at 280°/81° showing that the bedding is constantly and gently dipping toward N100 of 9°. Poles to fractures () show the existence of at least three main clusters of fractures oriented approximately E-W, ESE-WNW, and NNW-SSE at a very high angle relative to the bedding (about 90°) (). The half-range rose diagram () shows the distribution of these fractures and the main dihedral angles that those orientations form between them. It is worth noting that the boulders accumulated along the coast of the island show dihedral angles () matching these fracture assemblages.
Figure 9. (a) Fractures and bedding mapped from the 3D model; (b) lower hemisphere, stereographic equal-area projections of poles to fractures (green dots) and to bedding (yellow squares) and associated contour plot after data filtering based on vertex collinearity (Woodcock Citation1977; Fernández Citation2005; Seers and Hodgetts Citation2016); (c) half-range rose diagram showing the distribution of the fracture strikes with the highlight of the main angles formed between the main fracture sets; and, (d) detail of selected boulders showing that angularity follows the dihedral angles of the fracture sets mapped in the 3D model of the island.
5. Discussion
Much of the existing research on storm-transported boulders has been based on time-consuming field-based data collection over large coastal areas. The use of UAVs permits the collection of vast quantities of geospatial data pertaining to coastal change over a greater spatial area than would otherwise be possible using traditional field methods (Gómez-Pazo et al. Citation2021).
Results from this study of Fenoliga Island highlighted evidence of storm derived boulder deposits along the island perimeter. The Northern Adriatic is characterized by a micro-tidal regime, yet the area is subject to sizeable storm waves, generated by the local sirocco wind and the long southeasterly fetch. The relatively low topographic profile of Fenoliga Island is characterized by a coastline that is a mere 0.5 m above mean sea level rising to a maximum elevation of 6.3 m inland. Considering the dipping of limestones outcropping on the island, the southern part is interested by limestone layers dipping southwards and forming a gentle sloping surface, while the northern sector of Fenoliga is made of support layers forming a steeper coastline. Storm-derived boulder transport was expected to be dominant on the southern coastline (Cavaleri and Sclavo Citation2006) as the coastal orientation aligns with the general direction of the sirocco wind, and the sizeable fetch distance (ca. 700 km). Moreover, the seabed is very shallow in the southern part of the island, therefore this enables large storm waves to detach blocks from both the seabed and the exposed intertidal bedrock transporting them across the rocky coast to a point of deposition. Conversely, the northern sector of the island is protected from waves. The results from the data collected regarding the boulders is discussed further in terms of boulder distribution, shape and arrangement in relation to the structural and morphological layout of the island. Finally, we discuss the comparative assessment between boulders mapped via UAV-derived imagery and GE. It should be noted that the SfM-MVS orthomosaic and the GE imagery have different resolutions (15 cm/pixel for GE and 1.07 cm/pixel for SfM-MVS orthomosaic). For this reason, even in an optimal scenario, the accuracy of the digitized polygons cannot be considered below that of the image resolution. To that, it should be taken into account human error and the magnification used in QGIS during digitization. At the same time, any displacement measured between the two datasets that fall within (and probably more than) the difference in their pixel resolution should be treated with caution.
As mentioned before, the analysis of the DEM has highlighted dinosaur footprints. This aspect reminds us of the importance of 3D models for the digital preservation of this peculiar paleontological feature otherwise doomed to erosion by weathering and wave motion. The shareability of 3D models is another aspect aimed at such preservation of sites of special geological interest (i.e. geosites: Cayla Citation2014; Burnham et al. Citation2022), and for this reason, the SfM-MVS products here presented will be made available upon request.
5.1. Analysis of boulder distribution
The data processing undertaken allowed for the production of a detailed inventory of the coastal boulders on Fenoliga Island. The amassed data included key boulder characteristics including size, size categorization and distance from the coastline. The inventory results obtained via the GIS analysis have shown interesting evidence that are summarized in .
Figure 10. (a) Pie chart showing the percentages of boulder size by sedimentary classification; (b) scatter plot diagram showing boulder size (b-axis) relative to the recorded distance from the coastline; (c) distribution of boulders classified according to longitude; (d) topographic profile (A - B) approximately normal to the coastline.
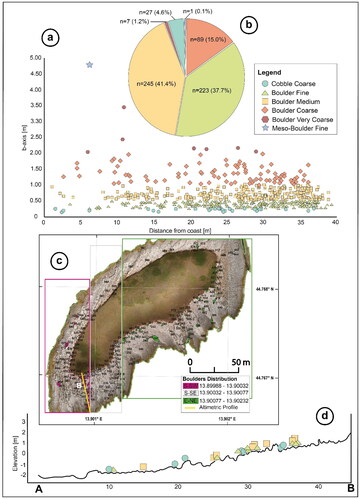
The distribution of boulders on the island is sporadic although the abundance generally increases landward, with the greatest concentrations found 20 - 40 m from the coastline (). Deposits beyond this point are limited due to the raised, central plateau which acts as a geomorphological barrier to transport. Counter-intuitively, the largest boulder with a b-axis of 4.8 m (Meso-boulder) is positioned 6.2 m from the coast, whilst many smaller boulders of a lesser mass are located closer to the coast. This may be attributed to limited time exposure, or that boulder transport capability is not a direct function of mass and may be attributed to obstructions and/or topographic variance (Naylor et al. Citation2016; Hastewell et al. Citation2020a).
shows a geographical subdivision of the distributed boulders based on an equal number of clasts (197-198) within three different longitude bands, divided into West (13.89988-13.90032 E - pink), central (13.90032-13.90077 E - white), and East (13.90077-13.90232 E - green). It is apparent that the island south-facing coastline has the highest concentration of boulders (as evidenced by the smaller size of the southern bands, ) which is attributed to the greater fetch distance from the SE and the generation of swell waves arising from the sirocco winds. However, some boulders are located in the northern sector of the island. These are considered to be the result of boulder transport from the western side of the island, as it is unlikely the boulders were displaced across the elevated vegetated plateau where very few smaller sized boulders are located.
depicts the topographic profile of the southern part of Fenoliga coast, where the largest concentration of boulder deposits occurs. The southeasterly fetch distance of approximately 700 km (), and the relatively low-lying coastline facilitate the transport, deposition and subsequent accumulation of storm boulder deposits. Additionally, the absence of vegetation along the coastal perimeter and the lack of anthropogenic barriers that interact with and reduce wave velocities also contribute to the accumulation of boulder assemblages on Fenoliga.
5.2. Importance of structural discontinuities on boulder genesis
Bedding attitudes and fracture orientations were digitized from the 3D model. summarized the main dihedral angles computed from the digitized fracture assemblage. We have shown () that these angles are also observed on a selection of the boulders accumulated along the coastline; thus, representing the same fracture assemblage. The interpretation of geological data suggests that, generally, the majority of boulders transported and subsequently deposited on the coast are derived from structurally weak areas (i.e. bedding and fractures) within the discontinuous carbonate strata from which the island is formed. These findings draw comparison with Buchanan et al. (Citation2020), who suggest that boulder production is influenced by site-specific litho-structural controls. The exposure to repeated wave action on the coast of Fenoliga periodically quarries boulders along fractured strata removing them from the bedrock. This mechanism of detachment forms the initial phase in the boulder production, transport and deposition process as conceptualized by Hastewell (Citation2020b). Once these clasts have been dislodged, they are available to be transported under exposure to wave forces. Boulder mobilisation is a response to the hydrodynamic forces that occur from breaking waves (drag, lift, inertia, buoyancy, and gravity). Transport is initiated when the mechanical wave forces exceed those of the resisting forces of the static boulder (Nandasena et al. Citation2011). The distance to which the boulder is moved is governed by the physical force of momentum, associated with wave energy, coupled with a coastal fringe that is free of obstruction and with limited topographic variance.
The factors that curtail boulder transport subsequently result in deposition. This occurs when the forces of resistance acting upon the boulder exceed the assailing wave force that initiated the episodic movement. The process of deposition occurs when the wave energy that initiated transport is reduced, which may occur where slope angle increases and/or when a mobile boulder encounters a morphological obstruction, e.g. a cliff base, individual/collective boulder deposits or raised scarp (Hastewell Citation2020b). Notably the latter appears to have occurred as detailed earlier () whereby boulders #344, #345 and #590 have been prevented from seaward transport due to the presence of a scarp.
5.3. Quantifying boulder transport
Although previous research has successfully used GE imagery to (i) identify the presence of boulder assemblages (Ruban Citation2020; Devoto et al. Citation2021); and, (ii) track individual movement in very coarse-sized clasts (Mottershead et al. Citation2020) this method was deemed unsuitable for confidently identifying transport pathways and quantify displacement in smaller sized boulders on Fenoliga. However, several outcomes arose from the exercise:
The GE image was subject to issues with resolution and the light/shadow effect caused by the timing of satellite passes relative to the time of day and subsequently the sun’s angle of incidence;
It was found that those more readily comparable boulders were concentrated in the S-SE part of the island. This may have been attributed to favorable light conditions at the time of the satellite pass, or a reflection of the higher concentration of boulders in this area;
Numerous boulders displayed a shift in an SW-NE direction, aligned with the southerly wave direction associated with the greatest fetch distance of the sirocco winds which dominate particularly during the winter period;
Some identifiable boulders displayed a slight shift in orientation towards a NE-SW direction, this is attributed to the angle of the dominant wave retreat/backwash.
Although this study was not focused on the modes of boulder transport it is expected that displacement of the boulders on Fenoliga occurred by either sliding, rolling and/or saltation. The latter two modes were suggested as the primary means of transport at the adjacent study site on the coast of the Premantura Peninsula (Biolchi et al. Citation2019a). Boulder mobilisation is a response to exposure of the hydrodynamic forces that occur from breaking waves (drag, lift, inertia, buoyancy, and gravity). Transport is initiated when the mechanical wave forces exceed those of the resisting forces of the static boulder (Nandasena et al. Citation2011). The distance to which the boulder is moved is governed by the physical force of momentum, associated with wave energy, coupled with a coastal fringe that is free of obstruction and with limited topographic variance.
6. Conclusions
Recent research into the transport and deposition of boulders by storm waves has provided valuable insight to the changing geomorphology of rocky coastlines around the globe. The contemporary modification of rocky coasts proffers a glimpse of the future impacts that are likely to be magnified by the cumulative response to climate change, including sea level rise and increased storm frequency and intensity.
This research study demonstrates that UAVs can successfully be deployed to document large areas quickly enabling the capture of HR aerial imagery. As a data collection technique, we have verified the use of products from a UAV-derived SfM-MVS photogrammetry technique as a means of complementing field surveys allowing for the cataloguing and categorization of 592 blocks that comprise the extensive coastal boulder assemblage on Fenoliga Island. The outputs arising from the UAV-DP technique are shown to provide a greater level of image clarity when compared with Google Earth satellite imagery as evidenced by the ability to analyze and classify 592 boulders (b-axis exceeding 0.4 m) using the UAV-DP technique compared with just 73 using the GE image.
The low-lying coastal rim of the island, with its gentle gradient, fractured bedrock and dominant southerly directional storm wave component all act to provide suitable conditions for the detachment, transport, and deposition of limestone clasts from the discontinuous rocky bedrock exposures.
The southerly aspect of the Fenoliga coastline and the alignment with the sirocco generated southerly wind and wave activity ensures that this area of the island is subject to the most dynamic wave climate and subsequently has the largest concentration of boulder deposits. Notably the boulders are all deposited on the sloped limestone bedrock up to an elevation of 3 m asl. This suggests the extent of wave competence on the island and immediate surrounds is limited to approximately 3 m asl. The island’s eastern flank also has a high concentration of deposited clasts that could tentatively be attributed to the prevailing NE wind and wave conditions associated with the bora winds, although the fetch distance is very short. In contrast, the more sheltered areas to the north and northwest that are less exposed to direct wind and wave activity have a limited number of boulder deposits.
This study demonstrates the multiple benefits of using HR images derived by an inexpensive micro-UAV for increasing our understanding of coastal boulder deposits and providing insights to the investigation of marine geohazards affecting low-lying rocky coasts. The study also, (i) recognizes the benefits of conducting geological assessments to determine boulder genesis; and, (ii) identifies the limitations of using GE imagery as a substitute for UAV-derived image collection. This arises from the lower image resolution which hinders the unequivocal identification of detached boulders. The techniques employed in undertaking this research can be used to assist with the revision of future coastal hazard assessments and management plans and help in the development of future coastal adaptation pathways that can build resilience against the future impacts of climate change. Furthermore, the increased understanding of the processes and mechanisms impacting on the island’s coastal evolution provides opportunity to manage and preserve the valuable paleontological features present, namely the dinosaur footprints. These significant relict features may yet hold further evidence of the paleoenvironment of the region during the Cretaceous period.
Disclosure statement
The authors report there are no competing interests to declare.
Data availability statement
Datasets used in this study are available via: doi.org/10.6084/m9.figshare.24057843.v1.
Additional information
Funding
References
- Arjomandi M, Agostino S, Mammone M, Nelson M, Zhou T. 2006. Classification of Unmanned Aerial Vehicles. Report for Mechanical Engineering class. , Adelaide, Australia: University of Adelaide.
- Barbano MS, Pirrotta C, Gerardi F. 2010. Large boulders along the south-eastern Ionian coast of Sicily: storm or tsunami deposits? Mar Geol. 275(1-4):140–154. doi: 10.1016/j.margeo.2010.05.005.
- Biolchi S, Furlani S, Antonioli F, Baldassini N, Causon Deguara J, Devoto S, Di SA, Evans J, Gambin T, Gauci R, et al. 2016. Boulder accumulations related to extreme wave events on the eastern coast of Malta. Nat Hazards Earth Syst Sci. 16(3):737–756. doi: 10.5194/nhess-16-737-2016.
- Biolchi S, Furlani S, Devoto S, Scicchitano G, Korbar T, Vilibić I, Šepić J. 2019a. The origin and dynamics of coastal boulders in a semi-enclosed shallow basin: a Northern Adriatic case study. Mar Geol. 411:62–77. doi: 10.1016/j.margeo.2019.01.008.
- Biolchi S, Denamiel C, Devoto S, Korbar T, Macovaz V, Scicchitano G, Vilibić I, Furlani S. 2019b. Impact of the October 2018 storm Vaia on coastal boulders in the Northern Adriatic Sea. Water, 11. 11:2229. doi: 10.3390/w11112229.
- Bird EC. 2011. Coastal geomorphology: an introduction. Chichester: John Wiley & Sons.
- Buchanan DH, Naylor LA, Hurst MD, Stephenson WJ. 2020. Erosion of rocky shore platforms by block detachment from layered stratigraphy. Earth Surf Processes Landf. 45(4):1028–1037. doi: 10.1002/esp.4797.
- Burnham BS, Bond CE, Flaig PP, van der Kolk DA, Hodgetts D. 2022. Outcrop conservation: promoting accessibility, inclusivity, and reproducibility through digital preservation. TSR. 20(1):5–14. doi: 10.2110/sedred.2022.1.2.
- Carrivick JL, Smith MW, Quincey DJ. 2016. Structure from motion in the geosciences. Chichester: John Wiley & Sons. doi: 10.1002/9781118895818.
- Causon Deguara J, Gauci R. 2017. Evidence of extreme wave events from boulder deposits on the south-east coast of Malta (Central Mediterranean). Nat Hazards. 86(S2):543–568. doi: 10.1007/s11069-016-2525-4.
- Causon Deguara J, Gauci R, Inkpen R. 2022. Monitoring coastal erosion using remote images: comparison between physically and remotely acquired data on a limestone coast. Remote Sens. 15(1):36. doi: 10.3390/rs15010036.
- Cavaleri L, Sclavo M. 2006. The calibration of wind and wave model data in the Mediterranean Sea. Coastal Eng. 53(7):613–627. doi: 10.1016/j.coastaleng.2005.12.006.
- Cayla N. 2014. An overview of new technologies applied to the management of geoheritage. Geoheritage. 6(2):91–102. doi: 10.1007/s12371-014-0113-0.
- Cerovečki I, Orlić M, Hendershott MC. 1997. Adriatic seiche decay and energy loss to the Mediterranean. Deep Sea Res Part I. 44(12):2007–2029. doi: 10.1016/S0967-0637(97)00056-3.
- Cheng Z, Gong W, Tang H, Juang CH, Deng Q, Chen J, Ye X. 2021. UAV photogrammetry-based remote sensing and preliminary assessment of the behavior of a landslide in Guizhou, China. Eng Geol. 289:106172. doi: 10.1016/j.enggeo.2021.106172.
- Corradetti A, Tavani S, Parente M, Iannace A, Vinci F, Pirmez C, Torrieri S, Giorgioni M, Pignalosa A, Mazzoli S. 2018. Distribution and arrest of vertical through-going joints in a seismic-scale carbonate platform exposure (Sorrento peninsula, Italy): insights from integrating field survey and digital outcrop model. J Struct Geol. 108:121–136. doi: 10.1016/j.jsg.2017.09.009.
- Cox R, Jahn KL, Watkins OG, Cox P. 2018. Extraordinary boulder transport by storm waves (west of Ireland, winter 2013–2014), and criteria for analysing coastal boulder deposits. Earth Sci Rev. 177:623–636. doi: 10.1016/j.earscirev.2017.12.014.
- Cox R, O’Boyle L, Cytrynbaum J. 2019. Imbricated coastal boulder deposits are formed by storm waves, and can preserve a long-term storminess record. Sci Rep. 9(1):10784. doi: 10.1038/s41598-019-47254-w.
- Demurtas V, Orru PE, Deiana G. 2022. Active lateral spreads monitoring system in East-Central Sardinia. Eur J Remote Sens. 55(1–21). doi: 10.1080/22797254.2022.2161418.
- Devoto S, Macovaz V, Mantovani M, Soldati M, Furlani S. 2020. Advantages of using UAV digital photogrammetry in the study of slow-moving coastal landslides. Remote Sens. 12(21):3566. doi: 10.3390/rs12213566.
- Devoto S, Hastewell LJ, Prampolini M, Furlani S. 2021. Dataset of gravity-induced landforms and sinkholes of the northeast coast of Malta (Mediterranean Sea). Data. 6(8):81. doi: 10.3390/data6080081.
- Dominey‐Howes DTM. 1998. Assessment of tsunami magnitude and implications for urban hazard planning in Greece. Disaster Prev Manage. 7(3):176–182. doi: 10.1108/09653569810223218.
- Dorigo L. 1965. La laguna di Grado e le sue foci. Ufficio Idrografico del Magistrato alle Acque di Venezia. Ricerche e Rilievi Idrografici, Venezia, p. 231.
- Etienne S, Paris R. 2010. Boulder accumulations related to storms on the south coast of the Reykjanes Peninsula (Iceland). Geomorphology. 114(1-2):55–70. doi: 10.1016/j.geomorph.2009.02.008.
- Evelpidou N, Zerefos C, Synolakis C, Repapis C, Karkani A, Polidorou M, Saitis G. 2020. Coastal boulders on the SE coasts of Cyprus as evidence of palaeo-tsunami events. JMSE. 8(10):812. doi: 10.3390/jmse8100812.
- Fernández O. 2005. Obtaining a best fitting plane through 3D georeferenced data. J Struct Geol. 27(5):855–858. doi: 10.1016/j.jsg.2004.12.004.
- Fernández T, Pérez JL, Cardenal J, Gómez JM, Colomo C, Delgado J. 2016. Analysis of landslide evolution affecting olive groves using UAV and photogrammetric techniques. Remote Sens. 8(10):837. doi: 10.3390/rs8100837.
- Furlani S, Bolla A, Hastewell L, Mantovani M, Devoto S. 2022. Integrated geomechanical and digital photogrammetric survey in the study of slope instability processes of a Flysch Sea Cliff (Debeli Rtič Promontory, Slovenia). Land. 11(12):2255. doi: 10.3390/land11122255.
- Furukawa Y, Ponce J. 2009. Accurate camera calibration from multi-view stereo and bundle adjustment. Int J Comput Vis. 84(3):257–268. doi: 10.1007/s11263-009-0232-2.
- Gaidi S, Galve JP, Melki F, Ruano P, Reyes-Carmona C, Marzougui W, Devoto S, Pérez-Peña JV, Azañón JM, Chouaieb H, et al. 2021. Analysis of the geological controls and kinematics of the Chgega Landslide (Mateur, Tunisia) exploiting photogrammetry and InSAR technologies. Remote Sens. 13(20):4048. doi: 10.3390/rs13204048.
- Giordan D, Manconi A, Remondino F, Nex F. 2017. Use of unmanned aerial vehicles in monitoring application and management of natural hazards. Geomatics Nat Hazards Risk. 8(1):1–4. doi: 10.1080/19475705.2017.1315619.
- Giordan D, Hayakawa Y, Nex F, Remondino F, Tarolli P. 2018. Review article: the use of remotely piloted aircraft systems (RPASs) for natural hazards monitoring and management. Nat Hazards Earth Syst Sci. 18(4):1079–1096. doi: 10.5194/nhess-18-1079-2018.
- Google Earth V.10.43.0.2. 2022. Fenoliga Island. 44° 46’ 03.92 N, 13° 54’ 06.07 E, Eye alt 465 m. Maxar Technologies. [accessed 2023 July 26]. http://www.earth.google.com.
- Gómez-Pazo A, Pérez-Alberti A, Trenhaile A. 2021. High resolution mapping and analysis of shore platform morphology in Galicia, northwestern Spain. Mar Geol. 436:106471. doi: 10.1016/j.margeo.2021.106471.
- Grün A, Remondino F, Zhang L. 2004. Photogrammetric reconstruction of the Great Buddha of Bamiyan, Afghanistan. Photogramm Rec. 19(107):177–199. doi: 10.1111/j.0031-868X.2004.00278.x.
- Hastewell LJ, Schaefer M, Bray M, Inkpen R. 2019. Intertidal boulder transport: a proposed methodology adopting Radio Frequency Identification (RFID) technology to quantify storm induced boulder mobility. Earth Surf Processes Landf. 44(3):681–698. doi: 10.1002/esp.4523.
- Hastewell L, Inkpen R, Bray M, Schaefer M. 2020a. Quantification of contemporary storm-induced boulder transport on an intertidal shore platform using radio frequency identification technology. Earth Surf Processes Landf. 45(7):1601–1621. doi: 10.1002/esp.4834.
- Hastewell LJ. 2020b. Geomorphic process mechanisms and quantification of storm-induced intertidal boulder transport using radio frequency identification (RFID) tagging technology [doctoral dissertation]. University of Portsmouth.
- Hofmann-Wellenhof B, Lichtenegger H, Collins J. 2001. Global positioning system; theory and practice. Austria: Springer-Verlag, Wien. doi: 10.1007/978-3-7091-6199-9.
- Hrvatski geološki institut - Croatian Geological Survey. 2009. Geological map of the Republic of Croatia in scale 1:300.000. [accessed 2023 Jul 31]. http://webgis.hgi-cgs.hr/gk300/default.aspx.
- Izumida A, Uchiyama S, Sugai T. 2017. Application of UAV-SfM photogrammetry and aerial lidar to a disastrous flood: repeated topographic measurement of a newly formed crevasse splay of the Kinu River, central Japan. Nat Hazards Earth Syst Sci. 17(9):1505–1519. doi: 10.5194/nhess-17-1505-2017.
- Katalinić M, Parunov J. 2021. Comprehensive wind and wave statistics and extreme values for design and analysis of marine structures in the Adriatic Sea. JMSE. 9(5):522. doi: 10.3390/jmse9050522.
- Kelletat D, Schellmann G. 2002. Tsunamis on Cyprus: field evidences and 14C dating results. zfg. 46(1):19–34. doi: 10.1127/zfg/46/2002/19.
- Knight J, Burningham H, Griffiths D, Yao Y. 2023. Coastal boulder movement on a rocky shoreline in northwest Ireland from repeat UAV surveys using structure from motion photogrammetry. Geomorphology. 440:108883. doi: 10.1016/j.geomorph.2023.108883.
- Korbar T, Skelton PW, Tišljar J, Moro A, Vlahović I, Velić I, Fuček L. 2002. Middle to upper cenomanian transition: high-energy shoals with recumbent rudists to relatively low-energy environments with elevator rudists in Southern Istria (Gomila, Tašalera and Fenoliga Islet). In: Vlahović I and Korbar T, editors. 6th International Congress on Rudists, Rovinj, Abstracts and Excursion Guidebook. Zagreb: Institute of Geology. p. 111–122.
- Korbar T, Navratil D, Denamiel C, Kordić B, Biolchi S, Vilibić I, Furlani S. 2022. Coarse-clast storm deposit and solitary boulders on the Island of Mana (NP Kornati, Central Adriatic, Croatia). Geosciences. 12(10):355. doi: 10.3390/geosciences12100355.
- Lorang MS. 2011. A wave-competence approach to distinguish between boulder and megaclast deposits due to storm waves versus tsunamis. Mar Geol. 283(1–4):90–97. doi: 10.1016/j.margeo.2010.10.005.
- Maouche S, Morhange C, Meghraoui M. 2009. Large boulder accumulation on the Algerian coast evidence tsunami events in the western Mediterranean. Mar Geol. 262(1–4):96–104. doi: 10.1016/j.margeo.2009.03.013.
- Marr P, Jiménez Donato YA, Carraro E, Kanta R, Glade T. 2023. The role of historical data to investigate slow-moving landslides by long-term monitoring systems in lower Austria. Land. 12(3):659. doi: 10.3390/land12030659.
- Mastronuzzi G, Sansò P. 2004. Large boulder accumulations by extreme waves along the Adriatic coast of southern Apulia (Italy). Quat Int. 120(1):173–184. doi: 10.1016/j.quaint.2004.01.016.
- Međugorac I, Pasarić M, Orlić M. 2015. Severe flooding along the eastern Adriatic coast: the case of 1 December 2008. Ocean Dyn. 65(6):817–830. doi: 10.1007/s10236-015-0835-9.
- Mezga A, Bajraktarević Z. 1999. Cenomanian dinosaur tracks on the islet of Fenoliga in southern Istria, Croatia. Cretaceous Res. 20(6):735–746. doi: 10.1006/cres.1999.0180.
- Mottershead D, Bray M, Soar P, Farres PJ. 2014. Extreme wave events in the central Mediterranean: geomorphic evidence of tsunami on the Maltese Islands. zfg. 58(3):385–411. doi: 10.1127/0372-8854/2014/0129.
- Mottershead DN, Bray MJ, Soar PJ. 2018. Tsunami landfalls in the Maltese archipelago: reconciling the historical record with geomorphological evidence. SP. 456(1):127–141. doi: 10.1144/SP456.8.
- Mottershead DN, Soar PJ, Bray MJ, Hastewell LJ. 2020. Reconstructing boulder deposition histories: extreme wave signatures on a complex rocky shoreline of Malta. Geosciences. 10(10):400. doi: 10.3390/geosciences10100400.
- Nandasena NAK, Paris R, Tanaka N. 2011. Reassessment of hydrodynamic equations: minimum flow velocity to initiate boulder transport by high energy events (storms, tsunamis). Mar Geol. 281(1-4):70–84. doi: 10.1016/j.margeo.2011.02.005.
- Nandasena NAK, Scicchitano G, Scardino G, Milella M, Piscitelli A, Mastronuzzi G. 2022. Boulder displacements along rocky coasts: a new deterministic and theoretical approach to improve incipient motion formulas. Geomorphology. 407:108217. doi: 10.1016/j.geomorph.2022.108217.
- Naylor LA, Stephenson WJ, Smith HCM, Way O, Mendelssohn J, Cowley A. 2016. Geomorphological control on boulder transport and coastal erosion before, during and after an extreme extra-tropical cyclone. Earth Surf Processes Landf. 41(5):685–700. doi: 10.1002/esp.3900.
- Öğretmen N, Cosentino D, Gliozzi E, Cipollari P, Iadanza A, Yildirim C. 2015. Tsunami hazard in the Eastern Mediterranean: geological evidence from the Anatolian coastal area (Silifke, southern Turkey). Nat Hazards. 79(3):1569–1589. doi: 10.1007/s11069-015-1916-2.
- Paris R, Naylor LA, Stephenson WJ. 2011. Boulders as a signature of storms on rock coasts. Mar Geol. 283(1-4):1–11. doi: 10.1016/j.margeo.2011.03.016.
- Piras M, Taddia G, Forno MG, Gattiglio M, Aicardi I, Dabove P, Lo Russo S, Lingua A. 2017. Detailed geological mapping in mountain areas using an unmanned aerial vehicle: application to the Rodoretto Valley, NW Italian Alps. Geomatics Nat Hazards Risk. 8(1):137–149. doi: 10.1080/19475705.2016.1225228.
- Polli S. 1970. Tabelle di previsione delle maree per Trieste e l’Adriatico Settentrionale per l’anno 1971. Trieste: Istituto Talassografico Sperimentale. p. 20.
- Polšak A. 1965. Geologija južne Istre s osobitim obzirom na biostratigrafiju krednih naslaga. Geološki Vjesnik [Geology of Southern Istria Particularly with Respect to the Biostratigraphy of the Cretaceous Beds]. 18:415–509. https://geoloski-vjesnik.hgi-cgs.hr/wp-content/uploads/2022/05/1965_Polsak_252.pdf.
- Raicich F. 2015. Long-term variability of storm surge frequency in the Venice Lagoon: an update thanks to 18th century sea level observations. Nat Hazards Earth Syst Sci. 15(3):527–535. doi: 10.5194/nhess-15-527-2015.
- Roig-Munar FX, Rodríguez-Perea A, Martín-Prieto JA, Gelabert B, Vilaplana JM. 2019. Tsunami boulders on the rocky coasts of Ibiza and Formentera (Balearic Islands). JMSE. 7(10):327. doi: 10.3390/jmse7100327.
- Rossi G, Tanteri L, Tofani V, Vannocci P, Moretti S, Casagli N. 2018. Multitemporal UAV surveys for landslide mapping and characterization. Landslides. 15(5):1045–1052. doi: 10.1007/s10346-018-0978-0.
- Ruban DA. 2020. Finding coastal megaclast deposits: a virtual perspective. JMSE. 8(3):164. doi: 10.3390/jmse8030164.
- Saroglou C, Asteriou P, Zekkos D, Tsiambaos G, Clark M, Manousakis J. 2018. UAV-based mapping, back analysis and trajectory modeling of a coseismic rockfall in Lefkada island, Greece. Nat Hazards Earth Syst Sci. 18(1):321–333. doi: 10.5194/nhess-18-321-2018.
- Scheffers A, Scheffers S. 2007. Tsunami deposits on the coastline of west Crete (Greece). Earth Planet Sci Lett. 259(3-4):613–624. doi: 10.1016/j.epsl.2007.05.041.
- Scheffers A. 2008. Chapter seventeen - Tsunami boulder deposits. Tsunamiites. Amsterdam: Elsevier. p. 299–317. doi: 10.1016/B978-0-444-51552-0.00017-5.
- Scicchitano G, Scardino G, Tarascio S, Monaco C, Barracane G, Locuratolo G, Milella M, Piscitelli A, Mazza G, Mastronuzzi G. 2020. The first video witness of coastal boulder displacements recorded during the impact of medicane “Zorbas” on Southeastern Sicily. Water. 12(5):1497. doi: 10.3390/w12051497.
- Sedrati M, Morales JA, El M’rini A, Anthony EJ, Bulot G, Le Gall R, Tadibaght A. 2022. Using UAV and structure-from-motion photogrammetry for the detection of boulder movement by storms on a rocky shore platform in Laghdira, Northwest Morocco. Remote Sensing. 14(16):4102. doi: 10.3390/rs14164102.
- Seers TD, Hodgetts D. 2016. Probabilistic constraints on structural lineament best fit plane precision obtained through numerical analysis. J Struct Geol. 82:37–47. doi: 10.1016/j.jsg.2015.11.004.
- Seers TD, Sheharyar A, Tavani S, Corradetti A. 2022. Virtual outcrop geology comes of age: the application of consumer-grade virtual reality hardware and software to digital outcrop data analysis. Comput Geosci. 159:105006. doi: 10.1016/j.cageo.2021.105006.
- Seitz SM, Curless B, Diebel J, Scharstein D, Szeliski R. 2006. A comparison and evaluation of multi-view stereo reconstruction algorithms. 2006 IEEE Computer Society Conference on Computer Vision and Pattern Recognition (CVPR’06). 1:519-528. doi: 10.1109/CVPR.2006.19.
- Šepić J, Vilibić I, Fine I. 2015. Northern Adriatic meteorological tsunamis: assessment of their potential through ocean modeling experiments. JGR Oceans. 120(4):2993–3010. doi: 10.1002/2015JC010795.
- Shah-Hosseini M, Saleem A, Mahmoud AMA, Morhange C. 2016. Coastal boulder deposits attesting to large wave impacts on the Mediterranean coast of Egypt. Nat Hazards. 83(2):849–865. doi: 10.1007/s11069-016-2349-2.
- Smirčić A, Gačić M, Dadić V. 1996. Ecological study of gas fields in the northern Adriatic. Acta Adriatica. 37(1/2):17–34.
- Snavely N, Seitz SM, Szeliski R. 2006. Photo tourism: exploring photo collections in 3D. ACM Trans Graph. 25(3):835–846. doi: 10.1145/1141911.1141964.
- Stravisi F. 2003. Caratteristiche meteorologiche e climatiche del Golfo di Trieste. In: Bussani, M, editor. Manuale del conduttore-motorista alla pesca locale professionale. Trieste: Hydrores S.A.S. p. 148–154.
- Szeliski R. 2011. Image processing. In Computer vision: Algorithms and applications. London: Springer. doi: 10.1007/978-1-84882-935-0_3.
- Tavani S, Arbues P, Snidero M, Carrera N, Muñoz JA. 2011. Open Plot Project: an open-source toolkit for 3-D structural data analysis. Solid Earth. 2(1):53–63. doi: 10.5194/se-2-53-2011.
- Tavani S, Granado P, Corradetti A, Girundo M, Iannace A, Arbués P, Muñoz JA, Mazzoli S. 2014. Building a virtual outcrop, extracting geological information from it, and sharing the results in Google Earth via OpenPlot and Photoscan: An example from the Khaviz Anticline (Iran). Comput. Geosci. 63:44–53. doi: 10.1016/j.cageo.2013.10.013.
- Tavani S, Corradetti A, Billi A. 2016. High precision analysis of an embryonic extensional fault-related fold using 3D orthorectified virtual outcrops: the viewpoint importance in structural geology. J Struct Geol. 86:200–210. doi: 10.1016/j.jsg.2016.03.009.
- Terry JP, Goff J. 2014. Megaclasts: proposed revised nomenclature at the coarse end of the Udden-Wentworth grain-size scale for sedimentary particles. J Sediment Res. 84(3):192–197. doi: 10.2110/jsr.2014.19.
- Ullman S. 1979. The interpretation of structure from motion. Proc R Soc Lond B Biol Sci. 203(1153):405–426. doi: 10.1098/rspb.1979.0006.
- Vella C, Demory F, Canut V, Dussouillez P, Fleury TJ. 2011. First evidence of accumulation of mega boulders on the Mediterranean rocky coast of Provence (southern France). Nat Hazards Earth Syst Sci. 11(3):905–914. doi: 10.5194/nhess-11-905-2011.
- Verhoeven G. 2011. Taking computer vision Aloft - archaeological three-dimensional reconstructions from aerial photographs with photoscan. Archaeol Prospect. 18(1):67–73. doi: 10.1002/arp.399.
- Vilibić I, Šepić J. 2009. Destructive meteotsunamis along the eastern Adriatic coast: overview. Phys Chem Earth, Parts A/B/C. 34(17-18):904–917. doi: 10.1016/j.pce.2009.08.004.
- Westoby MJ, Lim M, Hogg M, Pound MJ, Dunlop L, Woodward J. 2018. Cost-effective erosion monitoring of coastal cliffs. Coastal Eng. 138:152–164. doi: 10.1016/j.coastaleng.2018.04.008.
- Woodcock NH. 1977. Specification of fabric shapes using an eigenvalue method. Geol Soc Am Bull. 88(9):1231–1236. doi: 10.1130/0016-7606(1977)88<1231:SOFSUA>2.0.CO;2.
- Yao H, Qin R, Chen X. 2019. Unmanned aerial vehicle for remote sensing applications – a review. Remote Sens. 11(12):1443. doi: 10.3390/rs11121443.
- Yuan R, Kennedy DM, Ierodiaconou DA. 2022. Spatial scaling in geomorphology: extrapolating micro-erosion measurements to the landform scale on shore platforms using unoccupied aerial vehicles. Geomorphology. 408:108252. doi: 10.1016/j.geomorph.2022.108252.