
 ?Mathematical formulae have been encoded as MathML and are displayed in this HTML version using MathJax in order to improve their display. Uncheck the box to turn MathJax off. This feature requires Javascript. Click on a formula to zoom.
Abstract
Blasting excavation is frequently used in myriads of hydraulic tunnels in Southwest China. To evaluate the effects of blasting parameters on the stability of tunnels and reveal reasonable blasting parameters, a field test on blasting parameters is carried out in typical sections of a diversion tunnel at a large hydropower project in Southwest China. Two different charging methods are designed. The multiple monitoring techniques, i.e. blasting vibration test (point), wave velocity test (line), three-dimensional laser scanning (plane), and microseismic monitoring (volume), combined with corresponding criteria are adopted to evaluate the effects of two different blasting parameters on construction safety. Multiple monitoring results well reflect the disturbance of blasting excavation on rock mass. In addition, the effects on rock damage and deformation of two different blasting parameters have some differences. The blasting parameters with less charge in the cut and breaking holes and more charge in the perimeter hole contribute to reducing rock mass damage and deformation. Therefore, the more reasonable blasting scheme is revealed. Present study will provide a new thought for the evaluation and optimization of blasting parameters in hydraulic tunnels.
1. Introduction
To achieve carbon neutrality, an expansion of clean energy is essential. In this situation, many large hydropower projects such as Shuangjiangkou, Jinchuan, Yebatan, etc., are under construction in Southwest China, which is located in the alpine canyon of Hengduan Mountain Region at the eastern margin of the Qinghai-Tibet Plateau. Deep buried high geostress, complicated geological environments and strong excavation unloading are main challenges that will be encountered during the construction of the hydropower underground caverns (Xu et al. Citation2016; Qian and Zhou Citation2018; Li et al. Citation2022; Xiao et al. Citation2022; Zhao et al. Citation2024).
Blasting excavation is widely used in the construction of hydropower underground caverns due to economy, efficiency and convenience. When rock mass is broken and stripped in the blasting area, some hazards including rock mass disturbance and damage, overbreak and underbreak, and structural vibration cannot be avoided. The effect of blasting excavation on rock mass comprises excavation impact and stress redistribution after excavation (Martino and Chandler Citation2004; Yan et al. Citation2015). Except for the rock mass features, the blasting excavation effect is also dominated by blasting parameters such as blastholes distribution, charge quantity and structure (Ramulu et al. Citation2009; Mei et al. Citation2021). How to optimize blasting parameters and reduce the adverse impact of blasting excavation is an important link of safety control in underground engineering construction.
Scholars have carried out a lot of research work on the evaluation of blasting parameters in underground caverns. Blair (Citation2014) revealed the influence of charge weight and length on blasting vibration through theoretical analysis and field measurements. Singh et al. (Citation1991) analysed the characteristics of underground rock fragmentation combing the photographic and image analysis technique with multiple statistic method and reviewed the factors influencing the blasting results. Ren et al. (Citation2012) designed the blasting test with a low-strength cement mortar model to analyse the boulders of different blasting parameters and optimized the layout of holes and charging structure in the Beiminghe iron mine. Xu et al. (Citation2019) proposed a model based on principal component analysis (PCA) and support vector machine (SVM) to predict blasting vibration and optimize blasting parameters. Li et al. (Citation2010) established the relationship between damage depth, damage horizontal radius and charge and vibration velocity, and considered the critical damage vibration velocity as the safety criterion of blasting damage based on wave velocity test of rock mass and numerical simulation. Koh et al. (Citation2009) used multiple flash imaging technology to improve the measurement accuracy of blasting fragmentation and optimize the blasting parameters. Mei et al. (Citation2021) conducted blasting excavation tests in the Panlongshan tunnel and designed new blasting parameters for horizontal layered rock mass. Rock mass damage investigation, deformation monitoring data, and overbreak and underbreak calculation well verified the superiority of the optimized blasting parameters. Previous study mainly selected structural vibration, rock fragmentation, overbreak and underbreak, and rock mass damage and deformation as criteria to optimize blasting parameters, and methods involved theoretical analysis, mathematical calculation, model test, artificial intelligence, numerical simulation and field monitoring. Thereinto, the field monitoring can provide intuitive and reliable bases, which has been a crucial method to optimize blasting parameters. A single monitoring technology combined with corresponding criterion was usually applied to optimize blasting parameters of underground caverns. The multiple monitoring based criteria used for evaluating blasting parameters of underground caverns have been rarely reported.
The rest of paper is organized as follows: The engineering background is first introduced in Section 2. Section 3 introduces the project design of the blasting parameter evaluation, including the blasting project and multiple monitoring techniques, i.e. blasting vibration test (point), acoustic wave velocity test (line), three-dimensional laser scanning (surface), and microseismic (MS) monitoring (volume). In Section 4, the main monitoring results are presented and explained. Section 5 evaluates the blasting effects of two different blasting schemes on rock mass of the tunnel, followed by the conclusions in Section 6.
2. Engineering background
2.1. Project description
As shown in , the Xulong hydropower station is under construction in the upper reaches of Jinsha River between Sichuan and Yunnan Provinces, Southwest China. The primary purpose of this hydropower project is to generate electricity. The total reservoir storage is 847 million m3. The installed capacity is 2400 MW with four 600 MW units. The main structures include a 213 m height concrete double-curvature arch dam, underground powerhouse caverns, flood discharge and energy dissipation buildings and diversion tunnels (Guodian Jinshajiang Xulong Hydropower Development Co., Ltd. Citation2021).
Figure 1. Plane layout of main structures at Xulong hydropower station.
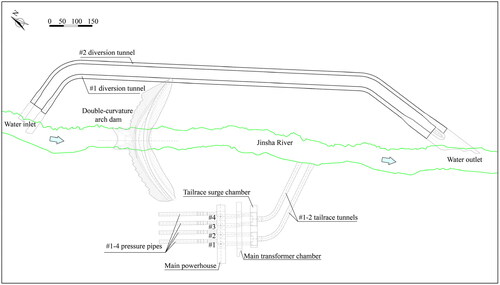
Two diversion tunnels, i.e. #1 diversion tunnel (Low diversion tunnel) and #2 diversion tunnel (High diversion tunnel), are parallelly arranged in the left bank (see ). The interplanar spacing between two tunnels is 36–50 m. The shape of the flow section is designed as gate way-like. The net section size of #1 diversion tunnel is 14 m × 17 m (width × height), while the net section size of #2 diversion tunnel is 12 m × 16 m. The lengths of two tunnels are 1313.18 and 1446.77 m respectively (Guodian Jinshajiang Xulong Hydropower Development Co., Ltd. Citation2021). The test section was selected in the #1 diversion tunnel.
2.2. Formation lithologies
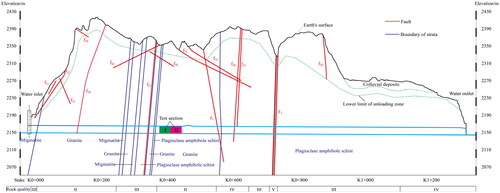
illustrates a typical geological profile along the axis of the #1 diversion tunnel. The water inlet elevation is 2148.0 m and the water outlet elevation is 2143.0 m. The largest depth of this tunnel is about 283 m. The strata include plagioclase amphibole schist and migmatite (formed in the Xiongsong Group of Middle Proterozoic), granite (formed in the Indosinian period of Triassic), and colluvial deposits (formed in Quaternary). The main types of rock mass are granite and plagioclase amphibole schist. There is a small amount of migmatite distributed near the water inlet. Colluvial deposits, composed of block gravel mixed with soil, mainly accumulate in the water outlet slope. Three main factors (i.e. rock strength, rock mass integrity and structural plane conditions) and two secondary factors (i.e. underground water and orientations of structural planes) are selected to classify rock mass quality. Each main factor has a score to reflect the quality of rock mass. For example, the higher of the rock strength, the higher the score of this factor. The full score composed of the three main factors is 100. The other two factors then give a modification of the score. Based on the final score T, the rock mass quality is classified as five grades (i.e. Class I: T > 85; Class II: 85≥T > 65; Class III: 65≥T > 45; Class IV: 45≥T > 25; Class V: T ≤ 25) (China Electricity Council Citation2016). Based on these, most of the rock mass along the tunnel profile is classified as II, III and IV. The rock mass of Class V accounts for less than 2% (Guodian Jinshajiang Xulong Hydropower Development Co., Ltd. Citation2021).
Figure 2. A typical geological profile along the axis of the #1 diversion tunnel.
2.3. Geological structures
Schistosity of the plagioclase amphibole schist near the water outlet and contact zone between granite and schist is especially developed. Mica enrichment can be observed locally. Fifteen faults are revealed along the diversion tunnel and four of them, i.e. F1, f3, f35 and f36 have greater influences on rock mass stability. There are also five fissure groups in the tunnel (Guodian Jinshajiang Xulong Hydropower Development Co., Ltd. Citation2021).
2.4. In situ stress conditions
The geostress of the left bank generally increases with buried depth. The integral value of geostress is medium and local geostress in the stress concentration area is medium-high. The geostress in the riverbed area increases obviously with the maximum horizontal principal stress ranging from 2.9 MPa to 16.7 MPa, and high geostress phenomena such as core discing occur locally. Overall, the diversion tunnel is dominated by a medium level of geostress (Guodian Jinshajiang Xulong Hydropower Development Co., Ltd. Citation2021).
3. Project design of the blasting parameter evaluation
3.1. Blasting project design
The diversion tunnel is designed to be excavated using three benches with the drilling and blasting method. In order to determine reasonable blasting parameters for the later construction of this tunnel, the test sections with different blasting parameters were arranged in the first bench between Stake K0 + 388 and Stake K0 + 458 and divided into two parts, i.e. test sections I and II (blue and pink in ). Test section I was from Stake K0 + 388 to Stake K0 + 423 and test section II was between Stake K0 + 423 and Stake K0 + 458. There are no special geological structures near the test section. In addition, the properties and types of rock mass in two sections are almost homogeneous.
The excavation size of the first bench is 15.4 m × 9.0 m (see ) and the expected footage is 4 m. Test section I was constructed using the scheme A and test section II used the scheme B. Schemes A and B have the same design of blasting holes and different charging structures. The arrangement of blasting holes is shown in and corresponding parameters of different blasting holes can be seen in . The blasting holes mainly include 34 cut holes, 18 bottom holes, 88 breaking holes and 60 perimeter holes. The depth of the cut holes is 600 cm, and that is 400 cm for other blasting holes. The dimeter of all blasting holes is 48 mm and the charge dimeter is 32 mm. Two commonly used and relatively effective charging schemes are designed (see ). As for scheme A used in the test section I, there are 280 mm charge and 320 mm stemming in the outer and inner cut and bottom holes. In the breaking holes, there are 245 mm charge and 155 mm stemming in the outer and inner holes. The 70 mm charge and 330 mm stemming in the outer and inner holes are arranged at intervals from the bottom left one for the perimeter holes, while the 182.5 mm air, 35 mm charge and 182.5 mm stemming from the outside to the inside of the holes are arranged for the other perimeter holes. For scheme B used in the test section II, the charge and stemming are 245 mm and 355 mm in the outer and inner cut and bottom holes. There are 190 mm charge and 210 mm stemming in the outer and inner breaking holes. The 70 mm charge and 330 mm stemming in the outer and inner holes are arranged alternately from the bottom left one for the perimeter holes, while the 35 mm charge, 200 mm air, 17.5 mm charge and 147.5 mm stemming from the outside to the inside of the holes are arranged for the other perimeter holes.
Figure 3. Arrangement of blasting holes in the test section (unit: cm).
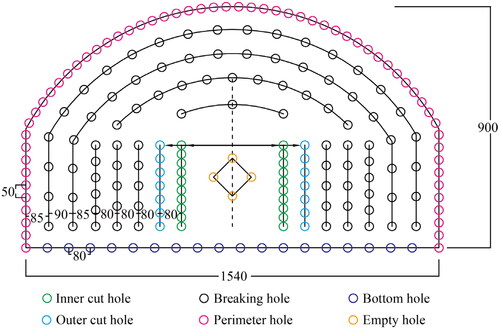
Figure 4. Design of blasting vibration tests (unit: cm). (a): blasting scheme A in test section I, and (b) blasting scheme B in test section II.
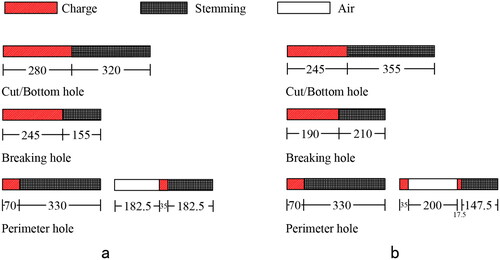
Table 1. Blasting holes and their parameters.
3.2. Monitoring scheme design
Four monitoring measures, i.e. blasting vibration test (point), acoustic wave velocity test (line), three-dimensional laser scanning (surface) and MS monitoring (volume), were comprehensively applied to evaluate the influences on rock mass of two blasting schemes in the test sections of the diversion tunnel. Monitoring results of the four techniques include all the significant but different indexes to reflect blasting effects, i.e. blasting vibration velocity, underbreak, rock mass damage and deformation. These indexes are usually the basic references used for evaluating the blasting effect in hydraulic tunnels. The blasting vibration velocity is the most direct reflection of the blasting load and the underbreak represents the quality of excavation face, which are the direct data of the blasting effect. The wave velocity and MS events respectively reflect the shadow and deep damage of rock mass induced by blasting excavation and unloading, while rock mass deformation is also a significant index that has a great influence on rock mass stability. These results represents the mechanical behaviours of rock mass and reflect the blasting effect indirectly. Besides, these comprehensive measurements reflect different dimensional monitoring information at different time. Thus, the four monitoring measurements could provide significant but different references for rock mass stability and tunnel construction, and these monitoring results are complementary to each other. The monitoring designs in two test sections are similar.
Blasting vibration test. illustrates the layout of blasting vibration testing sensors. Five sensors with the response frequency of 5–500 Hz are arranged on the sidewall with a 5 m interval and the closest senor to the excavation face is 25 m away from the excavation face. Five blasting vibration tests were respectively conducted in each test section.
Acoustic wave velocity test. As shown in , two acoustic test holes are arranged in the left and right spandrels of two typical sections (Stakes K0 + 388 and K0 + 428). The holes are drilled 6 m depth with an obliquely upward angle of 30°. After the sections with acoustic test holes are excavated from 5 to 10 days, the acoustic wave velocity of rock mass will be tested once a day.
Three-dimensional laser scanning. Stakes K0 + 388-398 in test section I and Stakes K0 + 428-438 in test section II are selected as representative sections to calculate rock mass underbreak and deformation using three-dimensional laser scanning. The original rock surface will be scanned twice i.e. after the excavation and 10 days after excavation when rock mass deformation is almost stable.
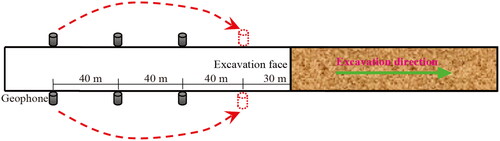
MS monitoring. The spatial layout of MS monitoring geophones is shown as . Six geophones with the response frequency of 15–2000 Hz are arranged in the left and right sidewalls with a 40 m interval behind the excavation face. The initial closest two geophones to the excavation face are 30 m away from the excavation face. As the excavation of the tunnel progresses, the distance between the geophones and excavation face becomes further and further. When the closest two geophones to the excavation face are 70 m away from the excavation face, the farthest two geophones will be moved forward 30 m away from the excavation face. The sampling frequency of the MS monitoring system is 10 kHz. Using the Short Time Average vs. Long Time Average algorithm (STA/LTA), a triggering threshold was set up with 3.
Figure 5. Layout of blasting vibration testing sensors.
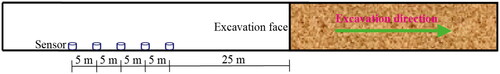
Figure 6. Arrangement of the acoustic test holes.
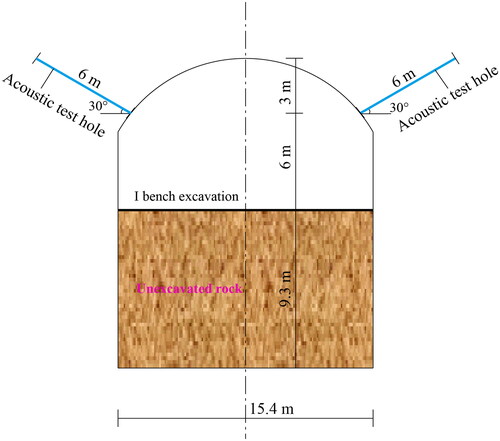
Figure 7. Spatial layout of MS monitoring geophones.
4. Monitoring results analysis
4.1. Blasting vibration test
Rock mass vibration velocity is the most immediate response of the blasting disturbance on rock structures. Five blasting tests were respectively conducted in each test section and detailed results are shown as . The resultant velocity obtained from three directions is used in this study. In test section I, the vibration velocity gradually decreases as the position is getting farther to the excavation face. The average values of the testing points 25, 30, 35, 40, and 45 m away from the working face are 7.90 cm/s, 5.75 cm/s, 4.37 cm/s, 3.45 cm/s and 2.80 cm/s. The relationship between vibration velocity and distance is determined using the Sodev’s regression formula that is expressed as (Liang et al. Citation2011; Tian et al. Citation2019; Jiang et al. Citation2021a):
(1)
(1)
where v is the vibration velocity, Q is the maximum single charge, R is the distance away from blasting position, k is a factor related to the medium and blasting conditions, a is the vibration attenuation coefficient. The values of k and a obtained by fitting are 235.5 and 1.76 (). The distance from the working face is more than 17.38 m when the vibration velocity is limited less than 15 cm/s for hydraulic tunnels (China Engineering Blasting Association Citation2014). As for the test section II, the vibration velocity also decreases as the position is getting farther to the excavation face. The average values of the testing points 25, 30, 35, 40, and 45 m away from the working face are 6.90 cm/s, 5.18 cm/s, 4.04 cm/s, 3.27 cm/s and 2.73 cm/s. Using the Sodev’s regression formula, the fitted values of k and a are 157.2 and 1.58 (). The distance from the working face is more than 15.32 m when the vibration velocity is less than 15 cm/s. By comparison, it can be found that the vibration velocity by scheme A is larger than that by scheme B. The safety distance of scheme B is shorter, which also means this scheme has less disturbance than scheme A.
Figure 8. Relationship curve between average vibration velocity and distance using Sodev’s empirical formula. (a): Blasting scheme A in test section I, and (b) blasting scheme B in test section II.
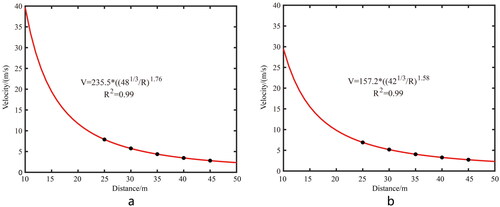
Table 2. Results of blasting vibration tests.
4.2. Wave velocity test of rock mass
During blasting excavation, the coupling effect of blast load and redistributed stress causes rock mass fracturing (Martino and Chandler Citation2004; Yan et al. Citation2015). As the fractures develop, the mechanical parameters of rock mass such as wave velocity, elastic modulus decrease. Larger blasting disturbance will result in more fractures, lower wave velocity of rock mass and deeper excavation loose zone near the excavation face (Xu et al. Citation2017). Thus, the tested wave velocity of rock mass can be used to reflect the influences of blasting excavation on rock mass around the excavation face. As mentioned in Section 3.2, the acoustic holes arranged in two typical sections (Stakes K0 + 388 and K0 + 428) were tested once a day after excavated from 5 to 10 days.
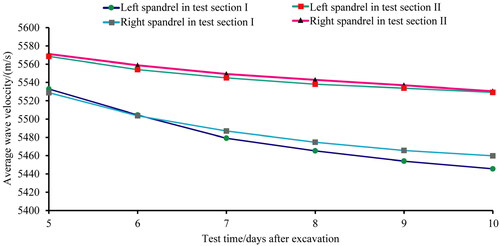
illustrates the acoustic wave velocity curves of rock mass in two test sections after the last test. The excavation loose depths revealed by the acoustic wave velocity curves of rock mass induced by two schemes are close and the value is approximately 0.6 m. Nevertheless, the acoustic wave velocity in different depths in section II are a little larger. The average wave velocity of rock mass in different test time are shown as . It can be seen that after the excavation the average wave velocity of rock mass in both sections tends to decease with time. At the same time after excavation, the average velocity of rock mass in section II is also larger than that in section II, with the values of 40–80 m/s. Therefore, scheme A has more disturbance than scheme B by comparing the characteristics of rock mass wave velocity.
Figure 9. Acoustic wave velocity curves of rock mass.
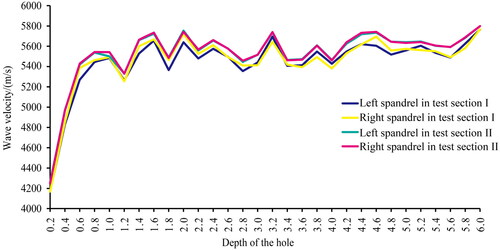
Figure 10. Average acoustic wave velocity in different test time.
4.3. Three-dimensional laser scanning
Using the three-dimensional laser scanning technology, the spatial coordinates of point clouds on the excavation faces of the tunnels can be acquired by calculation. The original rock surface will be scanned twice i.e. just after excavation and 10 days after excavation when rock mass deformation is almost stable. Rock mass overbreak and underbreak are calculated by comparing the first scanning data with the designed model and rock mass deformation can be obtained by comparing two-time scanning data, or deformation are obtained (Jiang et al. Citation2020, Citation2021b).
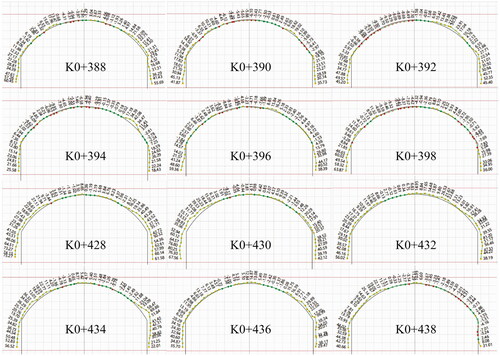
During the construction of the hydraulic tunnels, the overbreak is easier to be influenced by multiple complex geological environments and it may be very large in localized region though the blasting parameters are reasonable. In addition, some overbreak is permitted and convenient to deal with. However, the underbreak is difficult to reprocess and has a great influence on construction progress. Thus, the underbreak is selected as the evaluation criterion and must be strictly controlled. Six profiles in test section I (Stakes K0 + 388, 390, 392, 394, 396 and 398) and II (Stakes K0 + 428, 430, 432, 434, 436 and 438) are selected as typical positions for rock mass underbreak analysis and the calculated results are shown as . In , the ‘−’ means underbreak and the ‘+’ represents overbreak. The underbreak volumes of six profiles in test section I are 0.185 m2, 0.398 m2, 0.661 m2, 0.452 m2, 0.326 m2 and 0.652 m2. In test section II, the underbreak volumes of six profiles are 0.017 m2, 0.021 m2, 0.000 m2, 0.076 m2, 0.000 m2 and 0.283 m2. Rock mass underbreak volume with scheme B is clearly less. Therefore, it can be concluded that scheme B has better blasting effect than scheme A.
Figure 11. Underbreak of typical profiles in the test section (unit: cm).
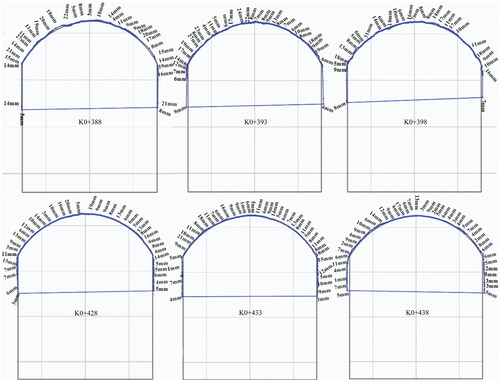
Rock mass deformation of three profiles in two sections (Stakes K0 + 388, 393, 398 and Stakes K0 + 428, 433, 438) is also obtained based on the three-dimensional laser scanning technology (see ). The average values of rock mass deformation of Stakes K0 + 388, 393 and 398 are 13.69, 11.59 and 11.45 mm while those of Stakes K0 + 428, 433 and 438 are 8.87, 9.15 and 6.24 mm. It can be seen that the overall deformation of rock mass is larger in test section I, which indicates that scheme A has larger disturbance on rock mass deformation.
Figure 12. Rock mass displacement of typical profiles in the test section.
4.4. MS monitoring
An MS event is a rock mass fracturing involving the generation of a new crack and the movement of an existing crack, which is usually induced by engineering construction and will inevitably cause rock mass damage (Cai et al. Citation2001). Rock mass fracturing is always accompanied by the released elastic waves, which can be received in real time using the sensors installed in rock mass. Then the time, location and intensity of the MS event are obtained by inversion. The MS events can well reflect three-dimensional damage of rock mass induced by blasting excavation (Li et al. Citation2023; Sun et al. Citation2023).
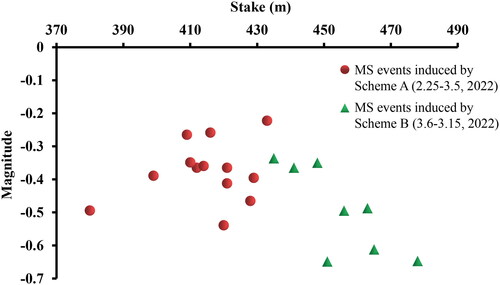
illustrates the spatial distribution of MS events (spheres) around the test sections in the diversion tunnel during the test period between 25 February 2022 and 15 March 2022. In , different sphere colours represent different moment magnitudes, while different sizes represent different energies. From February 25 to 5 March 2022, the test section I was being excavated and 13 MS events were induced. When the section II was being excavated, 8 MS events were recorded between 6 March and 15 March 2022 around the excavation disturbed areas. shows MS magnitudes and corresponding stakes induced by the excavation of test sections. The average magnitude of MS events induced by scheme A (excavation of section I) is about −0.4 and larger than that induced by scheme B (excavation of section II), which is approximately −0.5. According to the MS number and scales, it can be known that scheme A has larger disturbance on rock mass damage than scheme B.
Figure 13. MS events induced by blasting excavation in the test section.
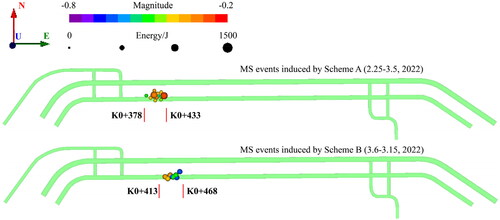
Figure 14. MS magnitudes and stakes induced by blasting excavation in two test sections.
5. Discussion
As illustrated above, both blasting schemes have achieved reliable monitoring results. For scheme A, the average blasting vibration values are less than 8.0 cm/s, which are not large and acceptable. Combing with the Sodev’s regression formula, the safety distance from the working face is a little far. The excavation loose depth reflected by wave velocity test is relatively small. However, the average wave velocity of rock mass after excavation decreased obviously and the value is about 5530 m/s and 5450 m/s on the 5th day and 10th day after excavation, indicating that excavation induced damage is large. The underbreak volumes of typical sections are small and well controlled. Rock mass deformation of all the typical sections is a little large with the values more than 10 mm. The MS activity is infrequent and their magnitudes are small, which means the deep damage of rock mass is not severe.
In the test section II where the scheme B is applied, the average blasting vibration values are less than 7.0 cm/s and the safety distance from the working face is about 15.32 m, which reflects a relatively small disturbance on structural vibration. The excavation loose depth is also small with the value less than 0.6 m. Moreover, the average wave velocity of rock mass after excavation decreased slowly and the value is about 5570 m/s and 5540 m/s on the 5th day and 10th day after excavation, which means excavation induced damage is slight. The underbreak volumes of typical sections are very small and rock mass deformation of all representative sections is less than 10 mm. There are only 8 MS events with low magnitudes induced by blasting excavation, which indicates that the deep damage of rock mass is slight.
Multiple monitoring results indicate that the safety distance, rock mass damage and deformation induced by scheme A need to be better controlled. Thus, scheme A could be further optimized to reduce the disturbance on rock mass. All monitoring data reveals scheme B has a good blasting effect and controlled better than scheme A. By field observation and calculation, the average residual half-porosity is about 78.61% in Section I and that is 84.84% in Section II. To sum up, scheme B has less disturbance on rock mass and is a better choice. As mentioned in Section 3.1, schemes A and B applied the same design of blasting holes. The main difference between two schemes is the charging structures. Compared with scheme A, scheme B was charged more in perimeter holes and less in cut, bottom and breaking holes. In this case, charging more in perimeter holes and less in cut, bottom and breaking holes reduced the disturbance of blasting excavation on rock mass in tunnels.
As more long hydraulic tunnels will be built in southwest China, blasting parameter evaluation for tunnels has been a critical task in hydropower projects. In addition to reducing construction risk, optimized blasting parameters can also accelerate construction process. The present study focuses on evaluate blasting parameters of a long hydraulic tunnel based on rock mass damage and deformation characteristics reflected by multiple monitoring information. To facilitate the comparison of different blasting schemes, two test sections with similar geological environments were selected, which could eliminate the influence of other factors as much as possible. Besides, the multiple monitoring information incorporating blasting vibration test (point), acoustic wave velocity test (line), three-dimensional laser scanning (surface) and MS monitoring (volume) was specially designed for blasting evaluation. Comparing with previous study (Koh et al. Citation2009; Mei et al. Citation2021), this method could provide more sufficient data, which made the evaluation for blasting effect more reliable.
This study presents a multiple monitoring-based thought for blasting parameter optimization. The monitoring results provide different kinds of references for better blasting effect evaluation. Meanwhile, there are still some deficiencies that need to be improved. When different blasting schemes are compared, similar geological environments are required to ensure that the differences of monitoring data are due to different blasting parameters. In addition, present study has introduced consistent monitoring results for effect evaluation of different blasting parameters. But when blasting parameter evaluation results based on multiple monitoring data are conflicting, more significant evaluation indexes should be selected as prior references. Thus, the evaluation results may be empirical and rely on the emphasis on different monitoring measures and corresponding evaluation indexes. To better use the monitoring information for blasting parameter optimization, the evaluation index could be given different weights. An evaluation model could be established using these indexes to quantitatively evaluate different blasting parameters.
6. Conclusions
A multiple monitoring-based method, including blasting vibration test (point), acoustic wave velocity test (line), three-dimensional laser scanning (surface) and MS monitoring (volume), is proposed to evaluate the blasting parameters of the diversion tunnel at a large hydropower project in Southwest China. Multiple monitoring results will reflect the disturbance of blasting excavation on rock mass, which will provide a new thought for the evaluation of blasting parameters.
As for the blasting scheme A, the average blasting vibration values are less than 8.0 cm/s. The average wave velocity of rock mass is about 5530 m/s and 5450 m/s on the 5th day and 10th day after excavation. The underbreak volumes are small and rock mass deformation is a little large with the values more than 10 mm. The MS activity is infrequent. Rock mass damage and deformation need to be better controlled.
As for the blasting scheme B, the average blasting vibration values are less than 7.0 cm/s. The average wave velocity of rock mass is about 5570 m/s and 5540 m/s on the 5th day and 10th day after excavation. The underbreak volumes are very small and rock mass deformation is less than 10 mm. There are only 8 MS events with low magnitude. All monitoring data reveals scheme B has a good blasting effect and controlled better than scheme A. Thus, scheme B has less disturbance on rock mass and is a better choice.
The main difference between schemes A and B is the charging structures. In the present case, charging more in perimeter holes and less in cut, bottom and breaking holes reduced the disturbance of blasting excavation on rock mass in tunnels. It is a significant method to optimize the blasting parameters by adjusting the charging structures in different charging holes. However, there are still much to be done to better use the monitoring information for blasting parameter optimization.
Disclosure statement
No potential conflict of interest was reported by the author(s).
Data availability statement
The data used to support the findings of this study are available from the corresponding author upon request.
Additional information
Funding
References
- Blair DP. 2014. Blast vibration dependence on charge length, velocity of detonation and layered media. Int J Rock Mech Min. 65:29–39. doi: 10.1016/j.ijrmms.2013.11.007.
- Cai M, Kaiser PK, Martin CD. 2001. Quantification of rock mass damage in underground excavations from microseismic event monitoring. Int J Rock Mech Min Sci. 38(8):1135–1145. doi: 10.1016/S1365-1609(01)00068-5.
- China Electricity Council. 2016. Code for hydropower engineering geological investigation: GB 50287-2016. Chinese.
- China Engineering Blasting Association. 2014. Safety regulations for blasting: GB 6722-2014. Chinese.
- Guodian Jinshajiang Xulong Hydropower Development Co., Ltd. 2021. Bidding document for the diversion tunnel construction of Xulong Hydropower Station in the upper reaches of Jinsha River. Chinese.
- Jiang N, Zhu B, Zhou CB, Li HB, Wu BB, Yao YK, Wu TY. 2021a. Blasting vibration effect on the buried pipeline: a brief overview. Eng Fail Anal. 129:105709. doi: 10.1016/j.engfailanal.2021.105709.
- Jiang Q, Shi YE, Yan F, Zheng H, Kou YY, He BG. 2021b. Reconstitution method for tunnel spatiotemporal deformation based on 3D laser scanning technology and corresponding instability warning. Eng Fail Anal. 125:105391. doi: 10.1016/j.engfailanal.2021.105391.
- Jiang Q, Zhong S, Pan PZ, Shi YE, Guo HG, Kou YY. 2020. Observe the temporal evolution of deep tunnel’s 3D deformation by 3D laser scanning in the Jinchuan No. 2 Mine. Tunn Undergr Space Technol. 97:103237. doi: 10.1016/j.tust.2019.103237.
- Koh TK, Miles NJ, Morgan SP, Hayes-Gill BR. 2009. Improving particle size measurement using multi—flash imaging. Miner Eng. 22(6):537–543. doi: 10.1016/j.mineng.2008.12.005.
- Li B, Ding QF, Xu NW, Dai F, Xu Y, Qu HL. 2022. Characteristics of microseismic b–value associated with rock mass large deformation in underground powerhouse caverns at different stress levels. J Cent South Univ. 29(2):693–711. doi: 10.1007/s11771-022-4946-4.
- Li B, Xu NW, Xiao PW, Xia Y, Zhou X, Gu GK, Yang XG. 2023. Microseismic monitoring and forecasting of dynamic disasters in underground hydropower projects in southwest China: a review. J Rock Mech Geotech Eng. 15(8):2158–2177. doi: 10.1016/j.jrmge.2022.10.017.
- Li XP, Chen JH, Li YH, Dai YF. 2010. Study of criterion and damage zone induced by excavation blasting of underground powerhouse of Xiluodu hydropower station. Chin J Rock Mech Eng. 29(10):2042–2049. Chinese.
- Liang QG, An YF, Zhao L, Li DW, Yan LP. 2011. Comparative study on calculation methods of blasting vibration velocity. Rock Mech Rock Eng. 44(1):93–101. doi: 10.1007/s00603-010-0108-3.
- Martino JB, Chandler NA. 2004. Excavation-induced damage studies at the underground research laboratory. Int J Rock Mech Min Sci. 41(8):1413–1426. doi: 10.1016/j.ijrmms.2004.09.010.
- Mei J, Zhang WZ, Xu BS, Zhu YX, Wang BK. 2021. Optimization methods of blasting parameters of large cross-section tunnel in horizontal layered rock mass. Geotech Geol Eng. 39(7):5309–5323. doi: 10.1007/s10706-021-01834-8.
- Qian QH, Zhou XP. 2018. Failure behaviors and rock deformation during excavation of underground cavern group for Jinping I Hydropower Station. Rock Mech Rock Eng. 51(8):2639–2651. doi: 10.1007/s00603-018-1518-x.
- Ramulu M, Chakraborty AK, Sitharam TG. 2009. Damage assessment of basaltic rock mass due to repeated blasting in a railway tunnelling project: a case study. Tunn Undergr Space Technol. 24(2):208–221. doi: 10.1016/j.tust.2008.08.002.
- Ren FY, Sow TAM, He RX, Liu XR. 2012. Optimization and application of blasting parameters based on the “pushing-wall” mechanism. Int J Miner Metall Mater. 19(10):879–885. doi: 10.1007/s12613-012-0642-y.
- Singh A, Scoble M, Lizotte Y, Crowther G. 1991. Characterization of underground rock fragmentation. Geotech Geol Eng. 9(2):93–107. doi: 10.1007/BF00881252.
- Sun YP, Su HJ, Xiao PW, Li P, Li B, Zhou X, Biao KQ, Xu NW. 2023. Visualization and early warning analysis of damage degree of surrounding rock mass in underground powerhouse. Int J Min Sci Technol. 33:2158–2177.
- Tian X, Song Z, Wang J. 2019. Study on the propagation law of tunnel blasting vibration in stratum and blasting vibration reduction technology. Soil Dyn Earthq Eng. 126:105813. doi: 10.1016/j.soildyn.2019.105813.
- Xiao PW, Mao HY, Qian B, Li B, Yang XG, Xu NW. 2022. Stability analysis of surrounding rock mass in underground powerhouse considering damage effect of microfractures. J Rock Mech Geotech Eng. 14(4):1115–1130. doi: 10.1016/j.jrmge.2022.01.007.
- Xu NW, Dai F, Li B, Zhu YG, Zhao T, Yang DS. 2017. Comprehensive evaluation of excavation-damaged zones in the deep underground caverns of the Houziyan hydropower station, Southwest China. B Eng Geol Environ. 79(1):275–293.
- Xu NW, Li TB, Dai F, Zhang R, Tang CA, Tang LX. 2016. Microseismic monitoring of strainburst activities in deep tunnels at the Jinping II hydropower station, China. Rock Mech Rock Eng. 49(3):981–1000. doi: 10.1007/s00603-015-0784-0.
- Xu SD, Li YH, Liu JP, Zhang FP. 2019. Optimization of blasting parameters for an underground mine through prediction of blasting vibration. J Vib Control. 25(9):1585–1595. doi: 10.1177/1077546319829938.
- Yan P, Lu WB, Chen M, Hu YG, Zhou CB, Wu XX. 2015. Contributions of in-situ stress transient redistribution to blasting excavation damage zone of deep tunnels. Rock Mech Rock Eng. 48(2):715–726. doi: 10.1007/s00603-014-0571-3.
- Zhao JS, Duan SQ, Chen BR, Li L, He BG, Li PX, Liu GF. 2024. Failure mechanism of rock masses with complex geological conditions in a large underground cavern: a case study. Soil Dyn Earthq. Eng. 177:108439. doi: 10.1016/j.soildyn.2023.108439.