
 ?Mathematical formulae have been encoded as MathML and are displayed in this HTML version using MathJax in order to improve their display. Uncheck the box to turn MathJax off. This feature requires Javascript. Click on a formula to zoom.
Abstract
Natural hazards usually cause heavy casualties and vast economic losses, as well as severe damage to the ecological environment. Quantitative and scientific evaluations of the ecological environment quality (EEQ) and its recovery trend after hazards can provide valuable insights for disaster risk reductions. This study takes the 2010 Ms7.1 Yushu earthquake as an example to explore the spatiotemporal changes and driving mechanisms of EEQ before and after the earthquake using remote sensing and GIScience. First, the Moderate-resolution Imaging Spectroradiometer (MODIS) data was selected to establish the remote sensing based ecological index (RSEI). Then, we analyzed the spatiotemporal characteristics of Yushu’s EEQ from 2001 to 2020 and explored spatial autocorrelation relationships. Last, the driving mechanism of EEQ recovery in Yushu was analyzed using the GeoDetector model. The main conclusions are as follows: (1) From the perspective of the RSEI time series, the EEQ in Yushu County was strongly negatively affected during the earthquake and recovered well after the earthquake. (2) Based on a spatial distribution analysis, it can be observed that the regions in Yushu with relatively high EEQ are primarily concentrated in the central and southern areas. Conversely, the northwestern and southeastern areas display relatively lower quality. Moreover, the EEQ in Yushu County has a strong correlation and clustering, as evidenced by Moran’s I value exceeding 0.7 over the years. (3) Based on the GeoDetector results, elevation and population were found to be the key driving factors affecting changes in post-disaster EEQ. The interaction between elevation and slope plays the most critical role in the process of ecological recovery. This study provides a theoretical basis for the evolution of the post-disaster ecological environment in Yushu County and helps decision-makers better balance the relationship between social development and environmental protection in disaster management and urban planning. It also provides useful reference and guidance for future ecological protection and recovery under similar disasters.
1. Introduction
In recent years, natural disasters such as floods, landslides, mudslides, and earthquakes have occurred frequently in China (Li et al. Citation2018; Zhou et al. Citation2022; Liu et al. Citation2019; Liu et al. Citation2023). As one kind of serious destructive disaster, earthquakes cause heavy casualties and vast economic losses in local areas, as well as severe damage to the ecological structure, thus bringing about nonnegligible impacts to the ecological environment (Liu et al. Citation2020, Citation2023). Natural ecosystems are the material basis for human survival and development and are closely related to human life (He et al. Citation2017). Moreover, ecosystems play an important role in responding to climate regulation, inhibiting harmful organisms, purifying the environment, and producing and maintaining biodiversity. With the progress of society and frequent human activities, environmental issues are becoming increasingly prominent, leading to the increased vulnerability of environmental quality to the threat of seismic hazards. Therefore, actively evaluating and monitoring the impact of disasters on the ecological environment plays a crucial role in reducing disaster risks and ensuring the safety of life and property. On April 14, 2010, a Ms7.1 earthquake occurred in Yushu County, resulting in over 2,000 fatalities, more than 80% of houses collapsing, and a large number of survivors suffering severe psychological damage (Ni et al. Citation2010; Zhang et al. Citation2010). The impact of this earthquake on the ecological environment and the recovery of the ecological environment after the earthquake require scientific evaluation, which is the focus of this study.
To date, ecological environment monitoring and evaluations have been conducted with various data and methods (Shan et al. Citation2019; Wen et al. Citation2021). Among the utilized methods, remote sensing spatial information technologies have developed rapidly and are now widely used in environmental detection and ecological research due to their advantages such as rapid, real-time acquisition and large-area monitoring (Mouat et al. Citation1993; Geng et al. Citation2022; Shan et al. Citation2022; Yang et al. Citation2022). Various remote sensing methods have been applied to the detection of the ecosystems of cities (Dai et al. Citation2021; Chen et al. Citation2022; Zhang et al. Citation2023), river basins (Yang et al. Citation2021), oases (Guo et al. Citation2021), and forests (Liu et al. Citation2018) and have become important components of environmental ecology research. Many scholars use only a single remote sensing index to evaluate EEQ in different regions. The normalized difference vegetation index (NDVI) (Rousel et al. Citation1973) is one of the most widely used indicators in ecological studies (Liu et al. Citation2016; Huang et al. Citation2021). The enhanced vegetation index (EVI) is often used for monitoring vegetation and environmental conditions (Wang et al. Citation2008). In addition, some studies have applied single indicators such as the land surface temperature (LST) (Liao and Jiang Citation2020), normalized difference build-up index (NDBI) (Luo and Li Citation2014), and hyperspectral flower index (HFI) (Chen et al. Citation2009). However, due to the complex ecological environment structure, a single ecological indicator cannot fully reflect EEQ. Additionally, it is worth noting that multi-index evaluation methods can be prone to disruptions caused by human factors, which can impact the weighting assigned to each index and introduce certain limitations to the evaluation process. Xu (Citation2013) proposed a new EEQ evaluation index called RSEI, which is completely based on remote sensing. The RSEI integrates greenness, humidity, heat, and dryness by using principal component analysis (PCA) technology and has the advantages of objectivity, comprehensiveness, and high precision in evaluations of ecological quality. The quality monitoring of the ecological environment based on RSEI has become a key research direction (Jing et al. Citation2020; He et al. Citation2021; Ji et al. Citation2022; Xia et al. Citation2022). Xiong et al. (Citation2021) constructed the RSEI based on the Google Earth Engine (GEE) platform and Landsat data to explore the spatial differentiation characteristics of the EEQ in the Erhai Lake Basin from 1999 to 2019. The EEQ of the Erhai Basin was generally moderate, with the EEQ deteriorating from the surrounding areas to the central area. Cui et al. (Citation2022) calculated the RSEI for the evaluation and analysis of ecological quality in Jinan City from 2006 to 2018. The areas of RSEI grade changes were counted, and the authors found that the overall EEQ of Jinan City showed an improvement trend over recent years. These study results provide data support for ecological protection in the context of rapid urbanization. An et al. (Citation2022) used MODIS data to develop the RSEI in the Three Gorges Ecological Economic Corridor from 2001 to 2019 and employed a GeoDetector to investigate multiple factors that affected the EEQ. The results provide a reference for the Three Gorges Ecological Economic Corridor to achieve green economic growth.
Based on the RSEI, the driving factors affecting changes in the ecological environment can be further explored. The GeoDetector is a new statistical model used to reveal the driving factors behind these changes; the GeoDetector has no linear assumptions and has an elegant form (Wang and Xu Citation2017; Tao et al. Citation2022). It combines geographic information system (GIS) spatial overlay technology with set theory (Wang and Xu Citation2017; Zhang and Lu Citation2019). GeoDetector is widely used in many fields because of its ability to identify and quantify the relationship between geographic elements and environmental variables (Wang et al. Citation2021; Wang, Zhang, Chen Citation2021; Cui et al. Citation2022; Yang et al. Citation2022).
Currently, several studies related to the 2010 Yushu earthquake have been carried out, such as studies exploring the reactions of Weibo netizens after the earthquake (Qu et al. Citation2011), the landslide hazard caused by the earthquake (Xu et al. Citation2012), and the psychological problems of post-disaster survivors (Zhang et al. Citation2012). However, to the best of our knowledge, dynamic monitoring of post-earthquake ecological recovery has not yet been conducted after the 2010 Yushu earthquake. In the realm of disaster recovery monitoring, numerous scholars concentrate on assessing post-disaster recovery through the examination of vegetation indicators or land use changes (Jiang et al. Citation2015; Mi et al. Citation2023). However, it is noteworthy that such an approach tends to be unidimensional, emphasizing only a singular aspect of the ecological recovery process. In contrast, RSEI offers a more holistic perspective by encompassing the four most pertinent indicators for human well-being. This approach boasts the advantages of comprehensiveness and objectivity, enabling a thorough assessment of the overall quality and status of the ecology. Integration of RSEI with the GeoDetector model further enhances the analytical capabilities, facilitating the precise identification of driving factors influencing the ecological impact across diverse geographic essentials. This amalgamation allows for a nuanced understanding of the specific degree of influence exerted by each factor on the ecosystem, thereby furnishing a scientific foundation for environmental management and protection. Consequently, this study employs the combined approach of RSEI and the GeoDetector model for monitoring changes and recovery in the EEQ after the earthquake.
Firstly, we utilized MODIS data to compute four key indicators, thereby constructing the RSEI for Yushu County before and after the earthquake. Subsequently, leveraging the generated RSEI, a comprehensive post-disaster ecosystem evolution process was attained. Finally, spatial clustering characteristics of the EEQ in Yushu County and the underlying driving factors of the recovery process were investigated using Moran’s I and GeoDetector. The monitoring and in-depth exploration of EEQ before and after the Yushu earthquake conducted in this study will contribute to the formulation of more effective and targeted measures by government departments, thus promoting the advancement of ecological civilization in Yushu County. Furthermore, it facilitates the harmonization between social development and the ecological environment, contributing to the realization of the Sustainable Development Goals (SDGs), particularly SDG 11, aimed at making cities and human settlements inclusive, safe, resilient, and sustainable.
This study is structured as follows. Section 2 provides an overview of the current status of Yushu County and presents information regarding the study data. In Section 3, the methodology for establishing the RSEI and the principles governing Moran’s I and GeoDetector are expounded. Section 4 is dedicated to the quantitative and qualitative assessments of the EEQ in Yushu County, based on the outcomes derived from RSEI, with a focus on analyzing the impact of the earthquake on EEQ. Additionally, this section scrutinizes the spatial clustering of Yushu County EEQ and delves into the driving factors influencing post-disaster recovery. Section 5 delves into a comprehensive discussion of the changes in EEQ and the corresponding driving factors post-earthquake in Yushu County. Lastly, Section 6 synthesizes the findings and draws conclusive remarks.
2. Study area and data collection
2.1. Study area
‘Yushu’ is a Tibetan transliteration meaning ‘relics’ and is also known as the source of rivers and considered the county containing the ‘Chinese water towers’. Yushu County (95°41′40″E-97°44′34″E, 32°44′44″N-33°46′44″N) is under the jurisdiction of Yushu Tibetan Autonomous Prefecture in Qinghai Province, covering an area of 15,400 (as presented in ). The terrain of Yushu County is high in the northwest and southeast and low in the northeast and southwest, with an average elevation of 4,493 meters. The climate of Yushu County is a typical plateau continental climate characterized by sufficient sunlight, cold winters and cool summers, and relatively low rainfall.
Figure 1. The study area.
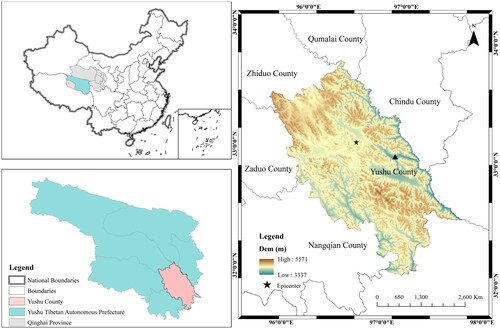
At 07:49 am on April 14, 2010, a Ms7.1 earthquake occurred in Yushu County, with a focal depth of 33 km (Yueping et al. Citation2010). The earthquake damage was distributed along active faults in a band shape, and the fault ruptured underground along a length of 19.7 km with a seismic intensity of IX. The earthquake affected an area of approximately 30,000 , leading a large area of Yushu County to become disaster-stricken. The epicenter of the earthquake was located in Jiegu Town, Yushu County, the political, economic, and cultural center of Yushu Tibetan Autonomous Prefecture.
2.2. Data collection
The data sources involved in this study are presented in . We selected MODIS datasets collected from 2001 to 2020 as the experimental data. The MOD09A1 and MOD11A2 datasets used in this study were all acquired by the TERRA satellite (Phan and Kappas Citation2018). MODIS data have the characteristics of high temporal resolutions, wide coverage, and an efficient data storage format.
Table 1. Data source in this study.
The average elevation in Yushu County is high, and the high mountains are covered with extensive ice and snow in spring, resulting in a certain impact on the acquisition of remote sensing images and subsequent study. The level of vegetation coverage directly affects EEQ, so greenness is a key index to consider when constructing the RSEI. Thus, we selected the MODIS products collected in June, July, and August, thus comprising the growing season of vegetation, to ensure the reliability of the comparative study results (Xu and Deng Citation2022). In summary, the remote sensing data selected in this study are reasonable and feasible and can better reflect the changes in the quality of the ecological environment before and after the analyzed earthquake in Yushu County.
3. Methodology
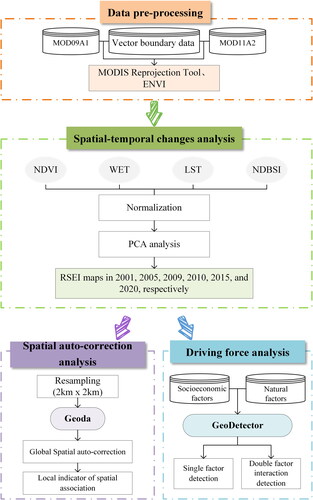
The workflow of this study is presented in . The MODIS Reprojection Tool (MRT), ENVI, and ArcGIS platforms were employed to process and analyze the data (Dwyer and Schmidt Citation2006; Sameen and Al Kubaisy Citation2014). The MRT is an efficient tool for processing MODIS data (Parajka et al. Citation2010). It can process gridded MODIS surface-product data in batches and has the characteristics of an easy and stable operation. Since the row and column numbers of the MODIS images covering the study area are H25V05 and H26V05, preprocessing steps such as image stitching, projection conversion, and format conversion were performed on the six-phase MOD09A1 and MOD11A2 data based on the MRT processing software (Neteler Citation2010). Since the MODIS data used in this study is optical images, the data would inevitably be missing due to the influence of clouds. Consequently, utilizing the quality bands inherent in MODIS data, cloud positions are identified and subsequently masked. The masked images are then merged, facilitating the extraction of comprehensive images within the designated study area. Subsequently, employing ENVI 5.3 software, four key indicators are extracted, and PCA calculations are executed to generate the RSEI. Then, the mapping and data autocorrelation analysis steps were carried out based on the ArcGIS platform and Geoda. Lastly, elevation (X1), slope (X2), aspect (X3), population density (X4), and gross domestic product (GDP) (X5) were selected as driving factors. The driving forces of the socioeconomic and natural factors affecting the RSEI results were analyzed using the GeoDetector. The influence intensities and interactive mechanisms of the RSEI changes in Yushu County were explored from the perspective of these two factors. Due to the data limitation, this study used the social and economic data of 2019 instead of the 2020 data.
Figure 2. Workflow of this study.
3.1. RSEI method
Based on remote sensing technology and integrating multiple ecological factors, RSEI can quickly and objectively evaluate EEQ (Xu Citation2013). The RSEI uses PCA technology to integrate the vegetation index, humidity component, building index, and land surface temperature, which are closely related to human life. The RSEI can be expressed as a function of these four indicators as follows:
(1)
(1)
Therefore, in this study, we chose the best indicator NDVI for evaluating and monitoring vegetation growth to represent the greenness factor (Rousel et al. Citation1973; Yan et al. Citation2017). Using the third component of the tasseled cap transformation as the humidity factor can effectively express the humidity of vegetation and soil (Thakkar et al. Citation2016) (Lobser and Cohen Citation2007). The mean values of the soil index (SI) and the index-based built-up index (IBI) were used as the Normalized Difference Built-up and Soil Index (NDBSI) to express dryness. (Xu Citation2008; Xu et al. Citation2018). The heat indicator is represented by the surface temperature, often referred to as the surface skin temperature. Here, the heat was calculated from the MODIS LST product data (Weng et al. Citation2014). The formulas for NDVI, WET, IBI, SI, and NDBSI are represented as follows.
(2)
(2)
(3)
(3)
(4)
(4)
(5)
(5)
(6)
(6)
where
to
denote bands 1 to 7 corresponding to the red, NIR1, blue, green, NIR2, short-wavelength infrared 1 (SWIR1), and SWIR2 bands of the MODIS image, respectively.
Due to the different dimensions of the above four indicators, it was necessary to standardize the four indicators using Formula 7 to unify between 0 and 1 (Xiong et al. Citation2022). Lastly, a PCA was performed, and the first principal component (PC1) was extracted to calculate RSEI. If low values indicate good ecological conditions, Formula 8 will be executed so that a relatively higher value represents a better ecological state, as usually expected. For the convenience of comparative study, Formula 7 was used to standardize the RSEI value again.
(7)
(7)
(8)
(8)
where
is the image standardization result;
is the numerical pixel value of the image;
and
are the maximum and minimum values of the image pixel, respectively.
3.2. Spatial auto-correlation analysis
Spatial auto-correlation can test the degree of correlation between a phenomenon in a certain area and the same phenomenon in adjacent area units (Li et al. Citation2021). This study used Global Moran’s I and local indicator of spatial correlation (LISA) to analyze the spatial correlation of EEQ in Yushu County. Its mathematical expression is as follows:
(9)
(9)
(10)
(10)
where
is the number of samples;
and
represent the RSEI value of position
and
is the average value of an attribute
is the spatial weight matrix.
3.3. GeoDetector model
The GeoDetector is a statistical method used to detect spatial heterogeneity and reveal its driving factors by detecting spatial differentiation (Wang et al. Citation2016; Wang and Xu Citation2017). Here, we focus on the detection of the factors influencing ecological environment changes and their interactions using the GeoDetector.
Factor detector: This module can quantitatively detect the spatial heterogeneity of the dependent variable and the explanatory power of the influencing factor Xi on the spatially heterogeneous characteristics of RSEI changes; q can be expressed as follows:
(11)
(11)
Where is the number of layers;
is the strata of driving factor X or variable;
and
are the numbers of units in layer h and the whole region, respectively;
and
are the variance of the variables for layer h and the entire region, repectively.
Interaction detector: This module can detect the interactive impact of any two driving factors on RSEI. Assuming that and
are the explanatory powers of the influence factors X1 and X2, respectively,
is the explanatory power of the two factors when they interact with each other, and five patterns of influence exist (as presented in ).
Table 2. The patterns of interaction detector.
4. Results
4.1. Analysis of spatiotemporal changes in EEQ before and after the 2010 Yushu earthquake
4.1.1. Temporal variation characteristics of EEQ in Yushu County
presents the PCA results of the six-phase remote sensing data within the study area. In PC1, except for 2010, the loading values of NDVI and WET, which are positively correlated with the ecological environment, exhibit consistent positive signs. To ensure that higher RSEI values correspond to better ecological conditions, a ‘1-PC1’ calculation was performed to derive the RSEI for 2010 (Xu and Deng Citation2022). The contribution rates of the PC1 eigenvalues of the six-phase remote sensing data were 71.25%, 63.86%, 68.02%, 62.47%, 53.09%, and 64.36%. These contribution rates surpass those of other components, indicating that PC1 captures the most substantial information related to the aforementioned four indicators. Consequently, the RSEI is constructed based on the PC1 results to analyze the regional EEQ before and after the Yushu earthquake. An increase in RSEI value signifies an improvement in the EEQ, while a decrease indicates a decline in the EEQ in Yushu County.
Table 3. Principal component analysis results and RSEI mean from 2001 to 2020.
As shown in , the average RSEI value before the earthquake (2001–2009) remained relatively stable and above 0.6, indicating a good ecological environment quality in Yushu County. Additionally, it is observed that the maximum and minimum RSEI values occurred in 2009 and 2010, respectively, with average RSEI values of 0.7229 and 0.6032. This represents a decrease of 0.1197, which can be attributed to the impact of the earthquake in Yushu County. Subsequently, following the 2010 earthquake, the RSEI value increased, signifying a significant improvement in EEQ and a return to the pre-disaster state. Overall, the temporal changes in EEQ from 2001 to 2020 can be categorized into three stages: before the earthquake (2001–2009), the EEQ in Yushu County was in good condition. However, during the occurrence of the earthquake (2009–2010), there was a significant decline in the average RSEI value, indicating damage to the ecology and environment. During the post-disaster recovery period (2010–2020), there was an increase in the average RSEI value, suggesting an improvement in EEQ.
4.1.2. Spatial variation characteristics of EEQ in Yushu County
To compare and analyze the changes in EEQ before and after the Yushu earthquake, as well as the recovery of EEQ after the earthquake, the RSEI calculation results were divided into five levels with an interval of 0.2 (Xu et al. Citation2019; Yang et al. Citation2021). shows the spatial distribution of EEQ in Yushu County. The Poor, Fair, Moderate, Good, and Excellent ecological levels are represented by red, orange, yellow, light green, and dark green, respectively. The red area is mainly distributed in the northwestern and southeastern parts of Yushu County, where the ecological environment is poor. From 2001 to 2020, the ecological environment in the central and southern parts was generally good. By comparing and observing , it can be seen that the dark green area in the epicenter area of Yushu County has significantly decreased, and the red area has significantly increased, indicating a decrease in EEQ here. shows the statistics of the area proportion of each ecological level from 2001 to 2020. During the study period, the area with RSEI values between 0.6 and 0.8 in Yushu County was the largest, with a proportion greater than 40%. Compared with that before the earthquake, the proportions of areas with Poor and Fair ecological levels in 2010 all showed upward trends, while the proportion of Good and Excellent ecological levels in 2010 showed a downward trend. In 2020, the area ratio of Excellent ecological quality level increased significantly. From the above analysis of changes in the RSEI values in Yushu, it can be concluded that the frequent human activities and urban development in southeastern Yushu have resulted in a poor ecological environment level; after the Yushu earthquake in 2010, the quality of the ecological environment in Yushu County generally showed a worsening trend, and due to the implementation of the post-disaster reconstruction policy, the ecological environment levels in 2020 improved.
Figure 3. Spatial distribution of EEQ levels in Yushu County from 2001 to 2020.
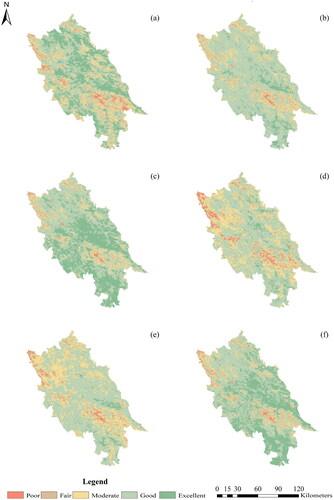
Table 4. EEQ area statistics for each level from 2001 to 2020.
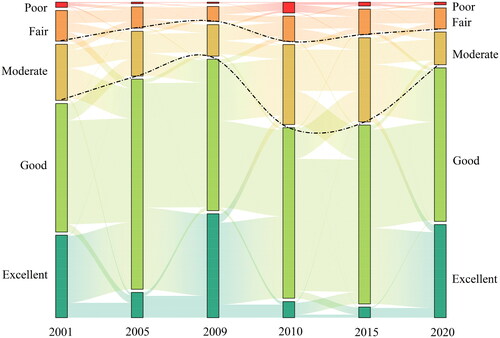
We employed transfer matrix analysis to conduct a comprehensive visual analysis of the changes and transfers of EEQ levels before and after the Yushu earthquake. The transfer matrix provides valuable insights into the direction and magnitude of transfers between different ecological levels. visually demonstrates frequent transfers between EEQ levels before and after the Yushu earthquake, with the primary transfers occurring among the Excellent, Good, and Moderate levels. Moreover, notable observations include the continual expansion of the areas classified as Good and Excellent before 2009, followed by a significant decline after the earthquake in 2010. Conversely, the areas designated as Poor and Fair exhibited contrasting patterns. The above results indicate that the ecological level of Yushu County has shifted from high to low due to the impact of the earthquake. Due to the implementation of reconstruction policies after the earthquake, the transition from Good level to Excellent level gradually occurred after 2010, indicating a slow improvement in EEQ.
Figure 4. Areas of different RSEI quality levels in Yushu County from 2001 to 2020.
4.1.3. RSEI difference analysis
To more intuitively and concretely understand the changes in the regional ecological environment after the Yushu earthquake in 2010, in this study, we used the difference principle to process the difference between the RSEI maps of Yushu in 2009 and 2010 and obtain an RSEI change distribution map as presented in . The green area in the figure indicates that the quality of the ecological environment improved to varying degrees, yellow represents no significant change in the quality of the ecological environment, and red represents a significant deterioration of the ecological environment. The proportion of the area with an improved ecological environment was small and scattered; the proportion of the area with a worsening ecological environment was relatively large and was mainly concentrated at the epicenter. shows the statistical results of RSEI changes before and after the earthquake in Yushu County. From the statistics of the area occupied by all levels, it can be seen that the proportion of the areas where the RSEI value did not change significantly after the earthquake accounted for 5.60% of the overall study area; the areas where the ecological environment improved after the earthquake covered 769.0152 , accounting for 4.99% of the total area; and the areas in which the EEQ deteriorated were spanned 13,775.9378
, accounting for 89.41% of the total area of Yushu County. According to these areal statistics, the earthquake caused damage to the ecological environment of Yushu County to varying degrees, and only a small number of areas did not experience significant changes in the quality of the ecological environment.
Figure 5. Changes in the ecological environment in Yushu County from 2009 to 2010.
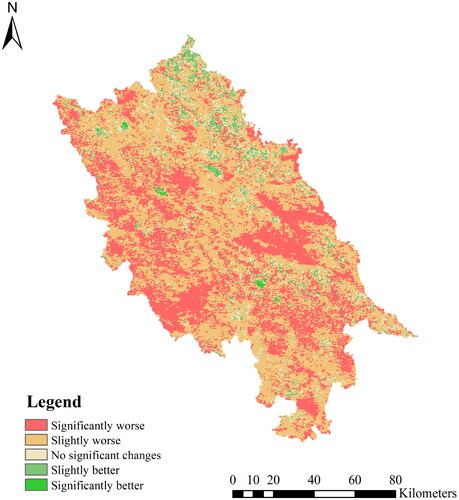
Table 5. Changes in the ecological quality of Yushu County from 2009 to 2010.
Table 6. Area statistics of different ecological environment change grades under different seismic intensities.
Table 7. Global moran’s I of RSEI in Yushu county from 2001 to 2020.
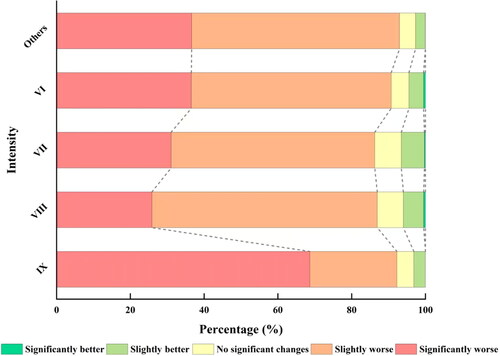
To further explore the impact of earthquakes on the quality of the local ecological environment, in this study, we employed the seismic intensity of the 2010 Yushu earthquake to obtain areal statistics indicating the RSEI changes at different intensity grades (as presented in and , ). From the statistics of the areas that experienced RSEI value changes with different intensities, we found that the deterioration of the eco-environment quality occupied the largest area among each intensity class. Among them, the proportion of significantly deteriorated ecological environment in Intensity IX is the highest, up to more than 65%. Significant improvement in EEQ accounts for less than 2% of the area in each intensity level, and the area proportion of Intensity IX was the lowest among all levels. At each intensity, the deterioration of the overall regional eco-environment quality was greater than 80%, the proportion of the area in which the eco-environment quality improved was less than 10%, and the rest of the ecological environment experienced no significant changes. To conclude, the impact of the Ms7.1 Yushu earthquake that occurred in 2010 on the quality of the ecological environment in Yushu County showed a worsening trend. The ecological environment is most seriously damaged in areas with the highest intensity.
Figure 6. The seismic intensity of the Ms 7.1 earthquake in Yushu County, Qinghai.
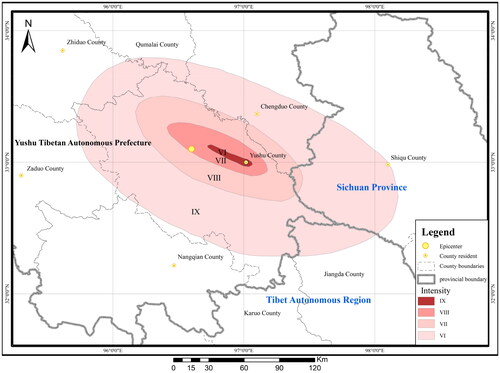
Figure 7. The proportion of the ecological change grades under different seismic intensities.
4.2. Spatial auto-correlation analysis of EEQ
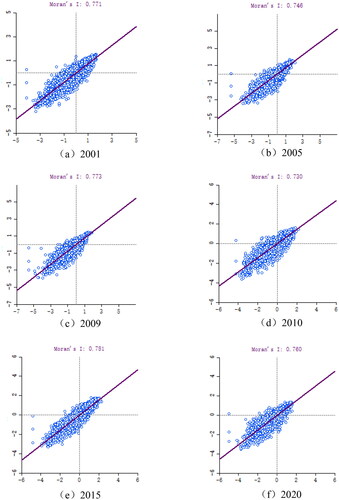
The global moran’s I was calculated using the RSEI values of Yushu County from 2001 to 2020, and the results are shown in and . Global moran’s I value is between plus and minus 1. Values greater than zero indicate positive spatial correlation, while values equal to zero indicate no spatial correlation, and values less than zero indicate negative spatial correlation. Moran’s I value in Yushu County has been positive and greater than 0.7 over the years, with a p-value less than 0.01 and a Z-value greater than 2.58, indicating significant results at the 1% level. shows the scatter plots of Moran’s I for RSEI in 2001, 2005, 2009, 2010, 2015, and 2020, mainly distributed in the first and third quadrants. The above results indicate a strong positive correlation between EEQ and geographical location, with a high degree of agglomeration rather than randomness in space.
Figure 8. Scatter plots of the RSEI in Yushu County from 2001 to 2020.
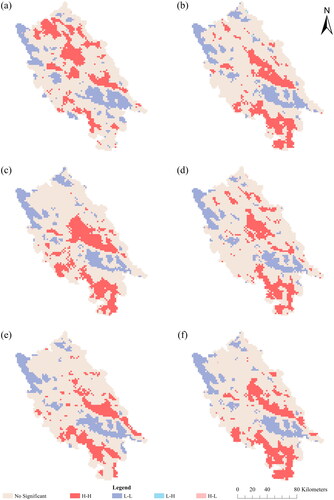
The LISA cluster diagram can provide a better understanding of the spatial clustering pattern and distribution of EEQ in Yushu County. The LISA cluster map has 5 types of local spatial aggregation, namely High-High (H-H), High-Low (H-L), Low-Low (L-L), Low-High (L-H), and No Significant. In terms of quantity, the L-L and H-H types gather more, indicating that streets with high (low) ecological environment quality in Yushu County are more likely to gather in space. From a spatial perspective, the clustering characteristics of RSEI in Yushu County are relatively stable and have spatial consistency. The central northern and southern parts of Yushu County exhibit a high concentration pattern, indicating that the ecological environment quality in the area is relatively high, and the surrounding ecological environment quality is also relatively high, making it a high-value concentration area. The northwest and southeast of Yushu County, on the other hand, are low-value gathering areas ().
Figure 9. LISA of the RSEI in Yushu County from 2001 to 2020.
4.3. Driving factors of the spatiotemporal variation of EEQ
4.3.1. Single factor detection analysis
From 2010 to 2020, the RSEI values in Yushu County changed to varying degrees. According to the actual situation in the study area and the availability of data, five influencing factors were selected among the socioeconomic and natural systems. The change characteristics of the RSEI values after the earthquake were used to detect the driving factors and the interactions among these factors.
The factor detection results reflect the explanatory power of each factor to the variation characteristics of the RSEI values in Yushu County. The factor detection results obtained for each year are shown in . The q-values reflect the explanatory power of each factor to the RSEI results, and the larger the q-values are, the stronger the explanatory power of that factor to the RSEI value is. From 2010 to 2020, the q-values of the elevation (X1) gradually increased. The elevation (X1) with the greatest explanatory power explained more than 35% of the results. Compared with the elevation, the q-values of the slope, population density, and GDP are relatively low, less than 10%. Overall, the elevation and population were the main factors driving the RSEI value changes. The p-values of the aspect factor were 0.151, 0.026, and 0.011, indicating that the aspect has low reliability in driving RSEI value changes.
Table 8. The detection result of different factors of EEQ.
4.3.2. Interactive effects among factors
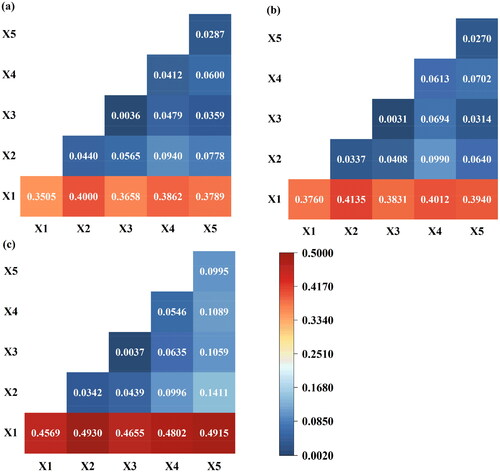
In the interaction detection performed using the GeoDetector, the interactions of two influencing factors on the RSEI values were determined, and the interaction detection results are shown in . The q-values of each factor pair’s interaction on the RSEI results are higher than those of the factors individually, and the interactions between the factor pairs represent either two-factor enhancement or nonlinear enhancement, thus confirming that the RSEI value change process was affected by multifactor interactions. In the process by which the RSEI values changed in different periods, the q-values of the interactions between elevation and other factors were higher than the other factor interactions, indicating that elevation was the dominant factor affecting the changes in RSEI values. Among the results, the q-values of the interaction between the elevation and slope were 0.4000, 0.4135, and 0.4930, the highest q-values in each period, followed by those of the interaction between the elevation and population, with q-values of 0.3862, 0.4012, and 0.4802.
Figure 10. Results of the interaction detection. (a) 2010, (b) 2015, and (c) 2020.
5. Discussion
5.1. EEQ changes in Yushu County before and after the earthquake
Yushu County is located in the Three Rivers Source area, and the ecological environment of this area directly affects the ecological environment of the Three Rivers Source Protection Zone and even the Yangtze and Yellow Rivers. Under this background, we conducted the construction of the RSEI to assess the EEQ characteristics both before and after the 2010 Yushu Ms7.1 earthquake. Moran’s I and the GeoDetector model were then employed to investigate the spatial clustering of EEQ and the underlying factors driving its post-disaster recovery, respectively. Among them, RSEI utilizes PCA technology to integrate four indicators that are most relevant to human life: greenness, humidity, dryness, and heat. It has objectivity and authenticity and can effectively express the EEQ of the study area. The findings from the PCA indicate a consistent pattern in the sign of the loading values for the four indicators, specifically in PC1 of each year. This pattern aligns with the conclusions drawn by other scholars, where NDVI and WET exhibit positive loading values, while NBDSI and LST display negative loading values (Gong et al. Citation2023; Jiang et al. Citation2023). This consistency reinforces the reliability of utilizing PC1 from 2001 to 2020 to construct the RSEI, facilitating an exploration of the spatiotemporal characteristics of the EEQ in Yushu County and an analysis of the earthquake’s impact on EEQ. Overall, the EEQ changes in Yushu County between 2001 and 2020 follow a stabilization-decline-recovery pattern. To investigate the effect of the Yushu earthquake on EEQ, the trend of EEQ change from 2001 to 2009 before the earthquake, was monitored to establish a more accurate reference for comparative studies of EEQ before and after the earthquake. This analysis confirmed that the decrease in the mean RSEI value in 2010 was indeed a result of the earthquake. The mean RSEI values during the ten years after the earthquake were 0.6032, 0.6070, and 0.7046, respectively, indicating a continuous recovery of EEQ in Yushu County through a combination of natural recovery and artificial management. The growth rates of the mean RSEI values in 2015 and 2020 were 0.076% and 1.952%, respectively, suggesting an accelerating pace of EEQ recovery after the earthquake.
5.2. Driving factors of ecological recovery after earthquakes
GeoDetector model serves as a quantitative tool for discerning the driving factors behind post-disaster changes in RSEI, offering a more nuanced depiction of the influences of these driving factors on post-disaster ecosystem recovery. According to GeoDetector results, elevation and population density emerge as the most pivotal single-factor driving factors contributing to the sustained recovery of the EEQ in Yushu County after the earthquake. Elevation, serving as a crucial indicator of topographic conditions, exerts influence on factors such as soil composition, vegetation distribution, and biodiversity. Consequently, it plays a pivotal role in shaping the recovery and enhancement of the post-earthquake ecological environment. Therefore, the recovery and management of the ecological environment post-earthquake necessitate consideration of elevation’s impact, prompting the implementation of corresponding measures to foster recovery and enhancement. Population density, reflecting regional population distribution, indirectly mirrors patterns of resource utilization and environmental protection. After the earthquake, the influence of population density on the ecological environment initially intensifies and subsequently diminishes. This fluctuation can be attributed to disruptions in people’s production and living conditions post-earthquake, impacting population distribution and resource utilization. As conditions gradually recover and improve over time, the influence of population density on the ecological environment weakens. In summary, this study not only depicts the ecological recovery changes through the lens of individual factors but also delves into the mechanisms of post-earthquake ecological recovery, considering factor interactions. This approach holds practical significance for a comprehensive understanding of the ecological recovery process.
5.3. Post-earthquake ecological recovery revelation
The 2010 Yushu earthquake occurred in the south-central part of the Ba Yan Ka La block on the Tibetan Plateau, an area prone to frequent seismic activity. The nearby districts and cities are particularly vulnerable to seismic events. Consequently, there is a critical need to underscore the significance of ecological protection and undertake comprehensive measures to enhance the ecological resilience of both the district and city. Specific strategies that can be implemented include:
Formulating and implementing policies on ecological environmental protection: Establishing and refining pertinent policies and regulations is essential. This includes the clarification of responsibilities and objectives for post-disaster ecological environmental protection. Strengthening efforts in the protection and recovery of the ecological environment is a key component of this initiative.
Implement an ecological environment monitoring system: establish a robust monitoring system, including monitoring of air, water quality, and soil, to keep abreast of changes in the ecological environment and provide a scientific basis for decision-makers.
Strengthen disaster risk management: Strengthen the assessment of disaster risks and early warning mechanisms, and take measures in advance to mitigate the impacts of disasters on the ecological environment, including the rational planning of land use and the construction of earthquake-resistant facilities.
The high cloud cover in the Landsat data for the region posed a challenge in synthesizing a comprehensive and high-quality image. Consequently, in this study, MODIS, with its lower resolution and the exclusion of boundary strip noise, was selected for monitoring the EEQ before and after the disaster. It is acknowledged that this choice can be further refined in future studies, emphasizing the integration of multi-source data to enhance the understanding of the disaster’s impact on EEQ and its subsequent recovery process. This approach aims to furnish local authorities with more accurate and effective information, facilitating their efforts in maintaining and developing the ecological environment and disaster risk management in the county.
6. Conclusion
Evaluating the characteristics of EEQ changes before and after disasters and monitoring post-disaster recovery is of great significance in formulating ecological protection strategies for relevant departments. Taking the 2010 Ms7.1 Yushu earthquake as an example, in this study, we investigated the spatiotemporal changes and post-disaster recovery in EEQ before and after the earthquake based on remote sensing technology. Moreover, the Geodetector and Moran’s I were employed to further explore the post-disaster driving factors and spatial clustering. First, we selected the MODIS data acquired in similar periods from 2001 to 2020 and used PCA to construct RSEI. On this basis, we generated the RSEI spatiotemporal distribution to quantitatively and qualitatively analyze the impact of the 2010 Yushu earthquake on regional EEQ. Then, we explored the spatial clustering and spatial clustering relationship of EEQ in Yushu County through autocorrelation analysis. Last, the GeoDetector model was introduced to quantify the impacts of the potential driving factors of post-disaster ecological environment recovery from two aspects: single factor detection and factor interaction detection. The main conclusions are summarized in the following points.
The RSEI calculation results obtained for Yushu County from 2001 to 2020 were 0.6636, 0.6621, 0.7229, 0.6032, 0.6070, and 0.7046, respectively. From 2001 to 2020, the RSEI value showed a ‘stability-decline-rise’ change rule, and the EEQ status was consistent with the change rule of the RSEI values. These results reveal that the ecological quality of Yushu County declined due to the 2010 earthquake that the local ecological environment recovered slowly after the earthquake, and the overall quality of the ecological environment in the study area recovered to a considerable level before the earthquake.
According to the areal statistics of the RSEI difference before and after the Yushu earthquake, the results show that the areas in which the RSEI values increased accounted for 4.99%, while the areas in which the RSEI values decreased spanned as much as 89.41% of the study area. Among them, the epicenter in the northeast of Yushu County was seriously damaged.
The Moran’s I values from 2001 to 2020 indicated that the spatial distribution of EEQ exhibits a positive correlation and aggregation distribution, rather than a random distribution. Via the GeoDetector model, we found that elevation and population were the main driving factors affecting the RSEI value changes. In the detection of interaction factors, it is found that the driving factors of the interaction between elevation and slope are the largest and not less than 40% from 2010 to 2020.
In this study, the 2010 Yushu earthquake served as a case study for monitoring changes in the EEQ before and after the disaster, as well as assessing post-earthquake recovery from a remote sensing perspective. The results underscored the significant impact of the disaster on the ecological environment. Consequently, in the face of such disasters, there is a pressing need to reinforce post-disaster ecological environment monitoring and recovery initiatives to safeguard the local ecological balance.
Acknowledgment
The authors would like to thank the editors and the anonymous reviewers for their insightful comments and suggestions.
Data availability statement
The data that support the findings of this study are available upon reasonable request.
Disclosure statement
The authors report there are no competing interests to declare.
Additional information
Funding
References
- An M, Xie P, He W, Wang B, Huang J, Khanal R. 2022. Spatiotemporal change of ecologic environment quality and human interaction factors in three gorges ecologic economic corridor, based on RSEI. Ecol Indic. 141:109090. doi: 10.1016/j.ecolind.2022.109090.
- Chen C, Ge Q, Tao Z, Liang L. 2022. Evaluation of ecological environment quality in Chongqing main city area based on principal component analysis. Sci Program. 2022:1–10. doi: 10.1155/2022/7374034.
- Chen J, Shen M, Zhu X, Tang Y. 2009. Indicator of flower status derived from in situ hyperspectral measurement in an alpine meadow on the Tibetan Plateau. Ecol Indic. 9(4):818–823. doi: 10.1016/j.ecolind.2008.09.009.
- Cui J, Zhu M, Liang Y, Qin G, Li J, Liu Y. 2022. Land use/land cover change and their driving factors in the Yellow River Basin of Shandong Province based on Google earth engine from 2000 to 2020. IJGI. 11(3):163. doi: 10.3390/ijgi11030163.
- Cui J, Zhu M, Mi H, Liu Y. 2022. Evaluation of eco-environmental quality and analysis on spatio-temporal variation in Jinan, China. Pol J Environ Stud. 31(2):1061–1072. doi: 10.15244/pjoes/140297.
- Dai X, Gao Y, He X, Liu T, Jiang B, Shao H, Yao Y. 2021. Spatial-temporal pattern evolution and driving force analysis of ecological environment vulnerability in Panzhihua City. Environ Sci Pollut Res Int. 28(6):7151–7166. doi: 10.1007/s11356-020-11013-6.
- Dwyer J, Schmidt G. 2006. The MODIS reprojection tool. In: Earth science satellite remote sensing. Berlin: Springer; p. 162–177.
- Geng J, Yu K, Xie Z, Zhao G, Ai J, Yang L, Yang H, Liu J. 2022. Analysis of spatiotemporal variation and drivers of ecological quality in Fuzhou based on RSEI. Remote Sensing. 14(19):4900. doi: 10.3390/rs14194900.
- Gong C, Lyu F, Wang Y. 2023. Spatiotemporal change and drivers of ecosystem quality in the Loess Plateau based on RSEI: a case study of Shanxi, China. Ecol Indic. 155:111060. doi: 10.1016/j.ecolind.2023.111060.
- Guo K, Zhao J, Wang X, Xie Y. 2021. Spatio-temporal dynamics of environmental status based on a remote sensing ecological distance index (RSEDI) in the Oases of Hexi Corridor in Northwest China. Pol J Environ Stud. 30(6):4997–5012. doi: 10.15244/pjoes/132806.
- He C, Gao B, Huang Q, Ma Q, Dou Y. 2017. Environmental degradation in the urban areas of China: evidence from multi-source remote sensing data. Remote Sen Environ. 193:65–75. doi: 10.1016/j.rse.2017.02.027.
- He Y-l, You N, Cui Y, Xiao T, Hao Y, Dong J. 2021. Spatio-temporal changes in remote sensing-based ecological index in China since 2000. J. Nat. Resour. 36(5):1176.
- Huang S, Tang L, Hupy JP, Wang Y, Shao G. 2021. A commentary review on the use of normalized difference vegetation index (NDVI) in the era of popular remote sensing. J for Res. 32(1):1–6. doi: 10.1007/s11676-020-01155-1.
- Ji J, Tang Z, Zhang W, Liu W, Jin B, Xi X, Wang F, Zhang R, Guo B, Xu Z, et al. 2022. Spatiotemporal and multiscale analysis of the coupling coordination degree between economic development equality and eco-environmental quality in China from 2001 to 2020. Remote Sens. 14(3):737. doi: 10.3390/rs14030737.
- Jiang W-G, Jia K, Wu J-J, Tang Z-H, Wang W-J, Liu X-F. 2015. Evaluating the vegetation recovery in the damage area of Wenchuan earthquake using MODIS data. Remote Sensing. 7(7):8757–8778. doi: 10.3390/rs70708757.
- Jiang X, Guo X, Wu Y, Xu D, Liu Y, Yang Y, Lan G. 2023. Ecological vulnerability assessment based on remote sensing ecological index (RSEI): a case of Zhongxian County, Chongqing. Front Environ Sci. 10:1074376. doi: 10.3389/fenvs.2022.1074376.
- Jing Y, Zhang F, He Y, Kung H-t, Johnson VC, Arikena Mis 2020. Assessment of spatial and temporal variation of ecological environment quality in Ebinur Lake Wetland National Nature Reserve, Xinjiang, China. Ecol Indic. 110:105874. doi: 10.1016/j.ecolind.2019.105874.
- Li X, Li Z, Yang J, Liu Y, Fu B, Qi W, Fan X. 2018. Spatiotemporal characteristics of earthquake disaster losses in China from 1993 to 2016. Nat Hazards. 94(2):843–865. doi: 10.1007/s11069-018-3425-6.
- Li X, Zhang H, Yu J, Gong Y, Guan X, Li S. 2021. Spatial–temporal analysis of urban ecological comfort index derived from remote sensing data: a case study of Hefei, China. J Appl Rem Sens. 15(04):042403–042403. doi: 10.1117/1.JRS.15.042403.
- Liao W, Jiang W. 2020. Evaluation of the spatiotemporal variations in the eco-environmental quality in China based on the remote sensing ecological index. Remote Sensing. 12(15):2462. doi: 10.3390/rs12152462.
- Liu Q, Yang Z, Han F, Wang Z, Wang C. 2016. NDVI-based vegetation dynamics and their response to recent climate change: a case study in the Tianshan Mountains, China. Environ Earth Sci. 75(16):1–15. doi: 10.1007/s12665-016-5987-5.
- Liu Y, Li Z, Wei B, Li X, Fu B. 2019. Seismic vulnerability assessment at urban scale using data mining and GIScience technology: application to Urumqi (China). Geomatics Natural Hazard Risk. 10(1):958–985. doi: 10.1080/19475705.2018.1524400.
- Liu Y, Liu W, Lin Y, Zhang X, Zhou J, Wei B, Nie G, Gross L. 2023. Urban waterlogging resilience assessment and postdisaster recovery monitoring using NPP-VIIRS nighttime light data: a case study of the ‘July 20, 2021’heavy rainstorm in Zhengzhou City, China. Int J Disaster Risk Reduct. 90:103649. doi: 10.1016/j.ijdrr.2023.103649.
- Liu Y, So E, Li Z, Su G, Gross L, Li X, Qi W, Yang F, Fu B, Yalikun A, et al. 2020. Scenario-based seismic vulnerability and hazard analyses to help direct disaster risk reduction in rural Weinan, China. Intern J Disaster Risk Reduct. 48:101577. doi: 10.1016/j.ijdrr.2020.101577.
- Liu Y, Yue H, Meng J, Zhang F, Cui Q. 2018. Ecological environment assessment for the main cities along the Silk Road Economic Belt (China section) based on remote sensing. Admin Tech Environ Monit. 30:35–39.
- Liu Y, Zhang X, Liu W, Lin Y, Su F, Cui J, Wei B, Cheng H, Gross L. 2023. Seismic vulnerability and risk assessment at the urban scale using support vector machine and GIScience technology: a case study of the Lixia District in Jinan City, China. Geomatics, Natural Hazards and Risk. 14(1):2173663. doi: 10.1080/19475705.2023.2173663.
- Lobser SE, Cohen WB. 2007. MODIS tasselled cap: land cover characteristics expressed through transformed MODIS data. Intern J Remote Sensing. 28(22):5079–5101. doi: 10.1080/01431160701253303.
- Luo X, Li W. 2014. Scale effect analysis of the relationships between urban heat island and impact factors: case study in Chongqing. J Appl Remote Sens. 8(1):084995. doi: 10.1117/1.JRS.8.084995.
- Mi H, Cui J, Ning Y, Liu Y, Zhu M. 2023. Post-earthquake recovery monitoring and driving factors analysis of the 2014 Ludian M s6. 5 earthquake in Yunnan, China based on LUCC. Stoch Environ Res Risk Assess. 37(12):4991–5007. doi: 10.1007/s00477-023-02555-5.
- Mouat DA, Mahin GG, Lancaster J. 1993. Remote sensing techniques in the analysis of change detection. Geocarto International. 8(2):39–50. doi: 10.1080/10106049309354407.
- Neteler M. 2010. Estimating daily land surface temperatures in mountainous environments by reconstructed MODIS LST data. Remote Sensing. 2(1):333–351. doi: 10.3390/rs1020333.
- Ni S, Wang W, Li L. 2010. The April 14th, 2010 Yushu earthquake, a devastating earthquake with foreshocks. Sci China Earth Sci. 53(6):791–793. doi: 10.1007/s11430-010-0083-2.
- Parajka J, Pepe M, Rampini A, Rossi S, Blöschl G. 2010. A regional snow-line method for estimating snow cover from MODIS during cloud cover. J Hydrol. 381(3-4):203–212. doi: 10.1016/j.jhydrol.2009.11.042.
- Phan TN, Kappas M. 2018. Application of MODIS land surface temperature data: a systematic literature review and analysis. J Appl Rem Sens. 12(04):1. doi: 10.1117/1.JRS.12.041501.
- Qu Y, Huang C, Zhang P, Zhang J. 2011. Microblogging after a major disaster in China: a case study of the 2010 Yushu earthquake. Paper presented at the. Proceedings of the ACM 2011 Conference on Computer Supported Cooperative Work.
- Rousel J, Haas R, Schell J, Deering D. 1973. Monitoring vegetation systems in the Great Plains with ERTS. Paper Presented at the Proceedings of the Third Earth Resources Technology Satellite—1 Symposium; NASA SP-351.
- Sameen MI, Al Kubaisy MA. 2014. Automatic surface temperature mapping in Arcgis using landsat-8 tirs and envi tools, case study: al Habbaniyah Lake. J. Environ. Earth Sci. 4(12):12–17.
- Shan W, Jin X, Ren J, Wang Y, Xu Z, Fan Y, Gu Z, Hong C, Lin J, Zhou Y. 2019. Ecological environment quality assessment based on remote sensing data for land consolidation. J Clean Product. 239:118126. doi: 10.1016/j.jclepro.2019.118126.
- Shan Y, Dai X, Li W, Yang Z, Wang Y, Qu G, Liu W, Ren J, Li C, Liang S, et al. 2022. Detecting spatial-temporal changes of urban environment quality by remote sensing-based ecological indices: a case study in Panzhihua City, Sichuan Province, China. Remote Sensing. 14(17):4137. doi: 10.3390/rs14174137.
- Tao S, Peng W, Xiang J. 2022. Spatiotemporal variations and driving mechanisms of vegetation coverage in the Wumeng Mountainous Area, China. Ecological Informatics. 70:101737. doi: 10.1016/j.ecoinf.2022.101737.
- Thakkar AK, Venkappayya RD, Ajay P, Madhukar BP. 2016. An effective hybrid classification approach using tasseled cap transformation (TCT) for improving classification of land use/land cover (LU/LC) in semi-arid region: a case study of Morva-Hadaf watershed, Gujarat, India. Arab J Geosci. 9(3):1–13. doi: 10.1007/s12517-015-2267-8.
- Wang H, Qin F, Xu C, Li B, Guo L, Wang Z. 2021. Evaluating the suitability of urban development land with a Geodetector. Ecol Indic. 123:107339. doi: 10.1016/j.ecolind.2021.107339.
- Wang JF, Xu CD. 2017. Geodetector: principle and prospective. Acta Geographica Sinica. 72(1):116–134.
- Wang J-F, Zhang T-L, Fu B-J. 2016. A measure of spatial stratified heterogeneity. Ecol Indic. 67:250–256. doi: 10.1016/j.ecolind.2016.02.052.
- Wang XD, Zhong XH, Liu SZ, Liu JG, Wang ZY, Li MH. 2008. Regional assessment of environmental vulnerability in the Tibetan Plateau: development and application of a new method. J Arid Environ. 72(10):1929–1939. doi: 10.1016/j.jaridenv.2008.06.005.
- Wang Y, Zhang Z, Chen X. 2021. Quantifying influences of natural and anthropogenic factors on vegetation changes based on geodetector: a case study in the Poyang Lake Basin, China. Remote Sen. 13(24):5081. doi: 10.3390/rs13245081.
- Wen C, Zhan Q, Zhan D, Zhao H, Yang C. 2021. Spatiotemporal evolution of lakes under rapid urbanization: a case study in Wuhan, China. Water. 13(9):1171. doi: 10.3390/w13091171.
- Weng Q, Fu P, Gao F. 2014. Generating daily land surface temperature at Landsat resolution by fusing Landsat and MODIS data. Remote Sensing of Environment. 145:55–67. doi: 10.1016/j.rse.2014.02.003.
- Xia Q-Q, Chen Y-N, Zhang X-Q, Ding J-L. 2022. Spatiotemporal changes in ecological quality and its associated driving factors in Central Asia. Remote Sensing. 14(14):3500. doi: 10.3390/rs14143500.
- Xiong Y, Xu W, Huang S, Wu C, Dai F, Wang L, Lu N, Kou W. 2022. Ecological environment quality assessment of Xishuangbanna rubber plantations expansion (1995–2018) based on Multi-temporal Landsat imagery and RSEI. Geocarto Intern. 37(12):3441–3468. doi: 10.1080/10106049.2020.1861663.
- Xiong Y, Xu W, Lu N, Huang S, Wu C, Wang L, Dai F, Kou W. 2021. Assessment of spatial–temporal changes of ecological environment quality based on RSEI and GEE: a case study in Erhai Lake Basin, Yunnan province, China. Ecol Indic. 125:107518. doi: 10.1016/j.ecolind.2021.107518.
- Xu C, Xu X, Hsi Lee Y, Tan X, Yu G, Dai F. 2012. The 2010 Yushu earthquake triggered landslide hazard mapping using GIS and weight of evidence modeling. Environ Earth Sci. 66(6):1603–1616. doi: 10.1007/s12665-012-1624-0.
- Xu H, Deng W. 2022. Rationality analysis of MRSEI and its difference with RSEI. Remote Sens Technol Appl. 37:1–7.
- Xu H, Shi T, Wang M, Fang C, Lin Z. 2018. Predicting effect of forthcoming population growth–induced impervious surface increase on regional thermal environment: xiong’an New Area, North China. Building and Environment. 136:98–106. doi: 10.1016/j.buildenv.2018.03.035.
- Xu H, Wang Y, Guan H, Shi T, Hu X. 2019. Detecting ecological changes with a remote sensing based ecological index (RSEI) produced time series and change vector analysis. Remote Sensing. 11(20):2345. doi: 10.3390/rs11202345.
- Xu H. 2008. A new index for delineating built‐up land features in satellite imagery. Intern J Remote Sens. 29(14):4269–4276. doi: 10.1080/01431160802039957.
- Xu HQ. 2013. A remote sensing urban ecological index and its application. Acta Ecologica Sinica. 33(24):7853–7862.
- Yan L, He R, Kašanin-Grubin M, Luo G, Peng H, Qiu J. 2017. The dynamic change of vegetation cover and associated driving forces in Nanxiong Basin, China. Sustainability. 9(3):443. doi: 10.3390/su9030443.
- Yang H, Zhong X, Deng S, Xu H. 2021. Assessment of the impact of LUCC on NPP and its influencing factors in the Yangtze River basin, China. Catena. 206:105542. doi: 10.1016/j.catena.2021.105542.
- Yang X, Meng F, Fu P, Wang Y, Liu Y. 2022. Time-frequency optimization of RSEI: a case study of Yangtze River Basin. Ecological Indicators. 141:109080. doi: 10.1016/j.ecolind.2022.109080.
- Yang X, Meng F, Fu P, Zhang J, Liu Y. 2022. Instability of remote sensing ecological index and its optimisation for time frequency and scale. Ecological Informatics. 72:101870. doi: 10.1016/j.ecoinf.2022.101870.
- Yang X, Meng F, Fu P, Zhang Y, Liu Y. 2021. Spatiotemporal change and driving factors of the Eco-Environment quality in the Yangtze River Basin from 2001 to 2019. Ecological Indicators. 131:108214. doi: 10.1016/j.ecolind.2021.108214.
- Yueping YIN, Zhang Y, Yinsheng MA, Daogong HU, Zuochen Z. 2010. Research on major characteristics of geohazards induced by the Yushu Ms7.1 earthquake. Journal of Engineering Geology. 18(3)289.
- Zhang H, Liu Y, Li X, Feng R, Gong Y, Jiang Y, Guan X, Li S. 2023. Combing remote sensing information entropy and machine learning for ecological environment assessment of Hefei-Nanjing-Hangzhou region, China. J Environ Manage. 325(Pt B):116533. doi: 10.1016/j.jenvman.2022.116533.
- Zhang RT, Lu JF. 2019. Multiscale spatiotemporal characteristics and influencing factors of intensive cultivated land use in Yangtze River Economic Belt. Trans Chin Soc Agric Eng. 35:271–278.
- Zhang Y, LiSheng X, Chen Y-T. 2010. Source process of the 2010 Yushu, Qinghai, earthquake. Sci China Earth Sci. 53(9):1249–1251. doi: 10.1007/s11430-010-4045-5.
- Zhang Z, Wang W, Shi Z, Wang L, Zhang J. 2012. Mental health problems among the survivors in the hard-hit areas of the yushu earthquake.
- Zhou J, Liu Y, Nie G, Cheng H, Yang X, Chen X, Gross L. 2022. Building extraction and floor area estimation at the village level in rural China via a comprehensive method integrating UAV photogrammetry and the novel EDSANet. Remote Sensing. 14(20):5175. doi: 10.3390/rs14205175.