
 ?Mathematical formulae have been encoded as MathML and are displayed in this HTML version using MathJax in order to improve their display. Uncheck the box to turn MathJax off. This feature requires Javascript. Click on a formula to zoom.
Abstract
This study enhances the understanding of virus removal efficiency by filters, crucial for predicting respiratory disease transmission risk and guiding outbreak prevention. Current research often neglects the survival behaviour of pathogens. Addressing this, our research develops a novel approach anchored in medical experimental data. A mathematical model was established to depict the dynamic changes in particulate concentration within non-centralized air-conditioned rooms, considering indoor and outdoor concentrations, natural ventilation, and filter dynamics. The model’s reliability was affirmed through particle and aerosolized pathogen filtration experiments, showing an R2 value over 0.99, indicating strong agreement with empirical data. Analysis of filter operation, both with and without infection sources during epidemics, reveals that the use of split air conditioners and filters significantly reduces pathogen concentration. Pathogens trapped in filters undergo natural decay, considerably lowering transmission risk compared to airborne states. This research offers a scientifically grounded, precise methodology for evaluating respiratory disease transmission risks, contributing substantially to public health management.
1. Introduction
As society advances and living standards improve, individuals express elevated expectations for indoor air quality. The sources of indoor air pollutants include pollutants released from decorative furniture materials and outdoor air during regular indoor activities (Hospodsky et al. Citation2012; Adams et al. Citation2015; Fujiyoshi et al. Citation2017). The repercussions of air pollution encompass not only a considerable number of premature deaths due to lung cancer, cardiovascular and cerebrovascular diseases but also the potential for respiratory ailments like asthma, pneumonia, and bronchitis (Sublett Citation2011; Abba et al. Citation2012; Fisk Citation2013; Kyung and Jeong Citation2020). Given that individuals spend a significant amount of time indoors (Klepeis et al. Citation2001), indoor air quality emerges as a direct factor influencing human health, underscoring the recognized importance of enhancing indoor air quality (Zhang D et al. Citation2022).
Biological pollution contributes significantly to indoor air contamination, accounting for approximately 5–34% of the total indoor air pollution (Srikanth et al. Citation2008). The past few years have witnessed a surge in global diseases attributable to biological pollution, including notable examples like H1N1, SARS, and H7N9. These pathogens are typically harboured on solid or liquid particles and can be airborne, leading to rapid spread in public spaces and resulting in widespread infections. The recent emergence and swift proliferation of COVID-19 have underscored the imminent threat posed by biological aerosols (WHO addresses European Parliament on COVID-19 response Citation2020). Activities such as breathing, speaking, and coughing by infected individuals generate droplets, forming virus-laden aerosols that significantly increase infection risks (Morawska Citation2006; Stadnytskyi et al. Citation2020; Zhang R et al. Citation2020). Historical epidemic data reveal a heightened risk of viral transmission through aerosols in densely populated, confined environments. Incidents such as those on the Diamond Princess cruise liner (Baraniuk Citation2020), in a church in Mount Vernon, Washington, USA (Kupferschmidt Citation2020), and a restaurant in Guangzhou, China (Li et al. Citation2020), demonstrate concentrated viral infection events. The pandemic has led to widespread panic, economic shutdowns, and social disruption. As such, controlling viral spread via indoor air is crucial for resuming normalcy.
Utilizing filters is a critical technological approach to enhance indoor air quality (Roy et al. Citation2019), a necessity made more urgent by escalating global environmental pollution. In the wake of the COVID-19 pandemic, the majority of transmission and infection cases have occurred indoors. Research indicates that the risk of indoor infection is nearly 19 times greater than outdoors (Kupferschmidt Citation2020), raising questions about the efficacy of air filters in virus filtration versus their potential as sources of pollution and secondary transmission. Experts from the Chinese Center for Disease Control and Prevention have expressed concerns that standard air filters, primarily designed for particle filtration, might not effectively remove submicron viruses or other pathogens.
However, some researchers (Forthomme et al. Citation2014; Morisseau et al. Citation2017; Nakpan et al. Citation2019) argue that using standard-level filters in conjunction with ultraviolet light, gaseous iodine, or other sterilization methods could be as effective as using higher-level filters. They hypothesize that while ordinary filters may intercept microbes, the accumulated pathogens might not be inactivated, potentially growing and multiplying within the filter, leading to re-aerosolization and reintroduction into indoor spaces, thus posing safety hazards. Conversely, some studies (Bandaly et al. Citation2017; Bandaly et al. Citation2019) have suggested that filters in ventilation systems might become sources of air pollution, with viruses remaining infectious both upstream and downstream of the filter. Nonetheless, many scholars maintain a positive view of filter efficacy. Electron microscopy studies have shown that the SARS-CoV-2 virus measures approximately 0.06 μm to 0.14 μm in diameter (Zhu et al. Citation2020), but particles bearing the SARS-CoV-2 genetic sequence predominantly range from 0.25 to 1 μm and 2.5 to 10 μm (Shi et al. Citation2019). This indicates that viruses are typically attached to particles and could be captured by intercepting these particles. Experiments by Curtius et al. (Citation2020) in a classroom setting revealed that aerosol concentrations dropped by over 90% after less than 30 min of purifier operation with closed doors and windows, suggesting significant infection risk reduction. Furthermore, (Qian et al. Citation2010) observed substantial particulate matter and droplet core removal in a hospital ward environment using an air purifier equipped with a high-efficiency filter module. Goyal et al. (Citation2011) conducted tests on air treatment device filters in two large public buildings, finding no live viruses in the samples. The current research landscape presents diverse perspectives, necessitating a comprehensive evaluation of filters’ roles during epidemics.
Over the past five years, significant advancements have been made in air filtration technology for capturing and removing viral particles from the air, especially during the COVID-19 pandemic (Han et al. Citation2021). Research has primarily focused on enhancing the viral capture efficiency of air filters while reducing energy consumption and costs. HEPA filters, effective in capturing particles of 0.3 microns and larger, have shown significant efficacy in trapping viral carriers such as respiratory droplets. However, their efficiency decreases for naked viral particles smaller than 0.3 microns (Ueki et al. Citation2022). Consequently, researchers have been exploring advanced filtration technologies including nanofiber technology (Leung and Sun Citation2020) and electrostatic filter materials (Park et al. Citation2022) to improve capture rates for these smaller particles. However, current research tends to approach virus-laden particles as generic contaminants, often overlooking the distinct survival characteristics intrinsic to the viruses themselves. This oversight potentially undermines the accuracy and applicability of their findings in real-world scenarios where virus behaviour plays a crucial role.
A significant number of residential or public buildings lack central air conditioning systems. In typical non-centralized air-conditioned spaces, split air conditioners are installed to regulate indoor temperature and humidity (Pizzatto et al. Citation2024). These spaces lack a dedicated fresh air system for indoor air quality regulation, relying primarily on natural ventilation through the opening and closing of doors and windows. As global air pollution intensifies, it poses a serious threat to the health of individuals indoors (Song et al. Citation2021). Beyond the temporary solution of purchasing and installing indoor air purification devices, air-conditioner manufacturers are upgrading their filtration systems, and some housing developers in China are integrating fresh air treatment systems into their building designs (Zhang X et al. Citation2021). During an epidemic outbreak, frequent interpersonal contact occurs in non-centralized air-conditioned buildings, often involving a diverse mix of individuals (Sadeghi et al. Citation2021). The air flow generated by fans and filters in operation could intensify concerns regarding virus transmission.
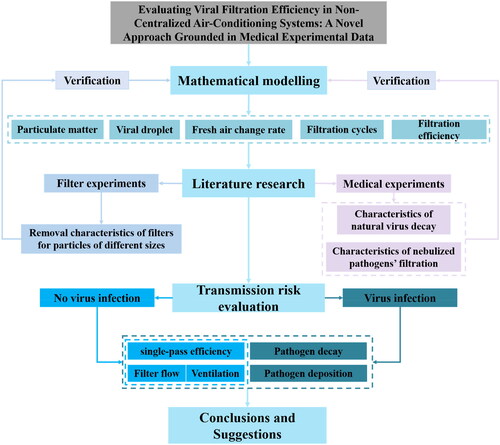
The aim of this study is to assess the efficacy of air filters in eliminating virus-laden particles, with a particular emphasis on understanding virus survival patterns (). Firstly, we developed a mathematical model to analyse the dynamic changes of indoor particulate pollutants in non-centralized air-conditioned rooms, considering the combined effects of ventilation, filter flow, single-pass efficiency, and the natural decay rate of pollutants. Secondly, we summarized and revealed the removal mechanisms of filters through particle filtration and microbial nebulization experiments, ensuring the model’s reliability. Finally, we assessed the virus removal efficiency of the filters under various operational conditions in non-centralized air-conditioned rooms based on the validated mathematical model, thereby offering valuable insights for COVID-19 containment strategies and respiratory disease prevention.
Figure 1. Research roadmap of this study.
2. Mathematical modelling
2.1. Governing equations
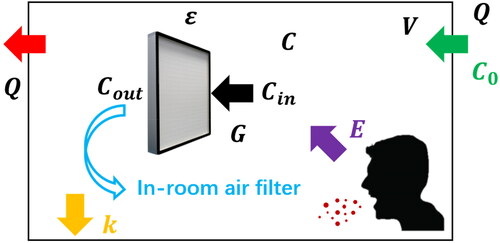
illustrates the schematic diagram of pollution sources and air distribution in non-centralized air-conditioned spaces. The model posits that the fresh air volume entering a room of volume V (m3) through natural or mechanical ventilation, denoted as Q (m3/h), along with the filter flow rate G (m3/h), and the particulate pollutant concentration of outdoor air C0 (μg/m3), are known variables. To specifically address the risk of virus transmission, the model considers only pollutant emissions from exhaled droplets by indoor occupants, with an emission rate denoted as E (μg/h). The model incorporates the natural decay rate of pollutants k (h−1), and the single-pass efficiency, ε, of filters, whether integral to split air-conditioning systems or acquired separately. The concentration of indoor particulate pollutants at any given moment is represented as C (μg/m3). The concentration of particulate pollutants in the room, at all times, adheres to the law of conservation of mass:
(1)
(1)
Figure 2. Working diagram of in-room filter.
Solving EquationEquation (1)(1)
(1) , we can get the following results:
(2)
(2)
where A is an undetermined constant.
If it is assumed that the initial concentration of indoor particulate pollutants at the initial time (t = 0) is Cs, the undetermined constant A can be expressed as:
(3)
(3)
Substituting A into EquationEquation (2)(2)
(2) given:
(4)
(4)
EquationEquation (4)(4)
(4) is the general expression of the particle pollutant concentration at any time t in any non-centralized air-conditioned room, which indicates the coupling effect of ventilation, filter flow, filter efficiency, etc.
2.2. Typical scenarios
2.2.1. Scenario I
When the operation time of indoor filter is sufficiently long, then:
(5)
(5)
denotes the indoor particulate concentration under conditions of stable operation of the room equipment system. Evidently, the factors influencing the steady-state concentration are intricate. Elevated concentrations of both outdoor and indoor pollution sources correspond to an increased indoor steady-state concentration. Conversely, augmented values of room volume, filter flow, and filtration efficiency contribute to a diminished indoor steady-state concentration. Nevertheless, the impact of ventilation Q remains uncertain, exhibiting the potential to either increase or decrease contingent upon the interplay of various factors. The formula possesses clear physical significance and serves as a valuable reference for optimizing indoor air quality. Furthermore, this equation facilitates a scientific interpretation of measured filter efficiency results.
2.2.2. Scenario II
For some public buildings, the area of windows and doors that can be opened is limited, or because of seasonal or habitual reasons, so the natural ventilation volume is very small and even be ignored (Q = 0), then EquationEquation (4)(4)
(4) can be simplified as:
(6)
(6)
The inherent physical significance of this equation unveils the dynamic variation in particle concentration, particularly in stringent working conditions characterized by limited fresh air availability. It qualitatively hints at potential technical strategies to mitigate transmission risks. Such strategies may encompass augmenting filter flow rates, enhancing filtration efficiency, and fostering the expedited decay of potential pathogens.
2.2.3. Scenario III
Moreover, during an outbreak, the incidence of infection within most indoor environments remains markedly low, largely attributable to public health interventions such as quarantine policies, travel restrictions, and temperature screening procedures. In scenarios where E equals 0 and k is also 0, EquationEquation (4)(4)
(4) can be effectively simplified to:
(7)
(7)
2.3. Association with medical experiments
This equation effectively models scenarios of significant particulate pollution. The practical implication of EquationEquation (7)(7)
(7) is that occupants can mitigate indoor particulate pollution by opting for filters with higher flow rates and greater filtration efficiency, while ensuring minimal sanitary ventilation. The predictive qualitative effects of the equation are corroborated by various experiments involving room filters, encompassing both successful and unsuccessful instances. In certain cases, rooms fitted with high-efficiency air purifiers still exhibit uncontrolled fresh air volume due to random opening and closing of doors and windows, resulting in measured indoor particulate pollution concentrations (or comprehensive filtration efficiency) lower than rooms with less efficient filters. The underlying mechanisms of these unsuccessful instances are readily explicable. Obviously, there are many factors affecting the concentration of indoor particulate pollutants, coupled with a variety of circumstances that make the problem more complex. In order to focus on the risk of transmission of the viruses released by indoor infected persons during the epidemic, the general equation can be simplified by combining with the medical experiments of virus decay. Due to strict safety requirements during medical experiments, the room was completely sealed (Q = 0) and no indoor particulate pollutant was released (E = 0). During the test, no filter was run (G = 0). Before the test (t = 0), the culture medium containing viruses was nebulized through the nozzle. The initial concentration of viruses in the room was Cs, and then the concentration of viruses in the air was detected by air sampling at different time points. Viral natural decay represents a reduced risk of airborne particulate transmission. Therefore, the above medical experiments can also be described by EquationEquation (8)
(8)
(8) :
(8)
(8)
In medical references (Silverman and Boehm Citation2020), denotes the relative survival rate of the virus. The variable k represents the natural decay rate of the virus, expressed in units of per hour (h−1), and is ascertainable through empirical data. To mitigate the impact of settling from the nebulized droplets of the microbial culture medium within the experimental space, two methodologies are employed. First, a compact rotating drum is selected for conducting the experiment, which aids in minimizing the settling effect. Secondly, when experiments are carried out in an aerobiology chamber, positioning the fan at the lower part of the chamber is crucial to ensure an even distribution of the virus throughout the space. In subsequent research, utilizing the time-based experimental data on microbial decay, we not only corroborated the validity of the general expression but also quantified the decay rate through experimental analysis. This calculation of decay rate forms the foundation for ensuing risk assessment studies. This approach underscores the critical interplay between empirical experimentation and theoretical modelling in advancing our understanding of viral transmission dynamics in controlled environments.
What is particularly gratifying is that the relevant experiments on the removal effect of nebulized microorganisms was found by running filters in the aerobiology chamber. The variation of the pathogen concentration can be predicted by EquationEquation (9)(9)
(9) :
(9)
(9)
By using the experimental results of the virus natural decay rate k, the reliability of EquationEquation (9)(9)
(9) can be verified and the risk evaluation index of the filter’s effect on pathogen removal can be obtained when the relevant experimental conditions such as room volume, circulating air volume and filtration efficiency are clearly known.
Following the mechanism analysis and mathematical modelling, the study examines various working conditions. Subsequent research initially focused on the general principles of particle filtration across varying sizes, drawing upon experimental data from publications worldwide. This was followed by validating the mathematical model through medical experiments, assessing the filter’s efficacy in removing nebulized microorganisms. Various scenarios involving small buildings were examined to comprehensively assess the risks associated with virus transmission during filter operation.
3. Filtration efficiency in experiments
As mentioned above, during the outbreak of the epidemic, due to the public interventions such as quarantine policies, travel restrictions and temperature detection, the probability of infected persons in most rooms is very low. Therefore, we first start from the filter related experimental research to analyse the impact of various operating conditions of the filter in non-centralized air-conditioned rooms on indoor air quality.
3.1. Comparison
Particles with aerodynamic equivalent diameters less than or equal to 2.5 (PM2.5) pose serious health risks, leading to an increased installation of air purifiers (filters) in residential and public buildings within heavily polluted areas. These purifiers are frequently used during periods of high respiratory disease incidence and in winters when elevated heating demands escalate pollution levels. Economic constraints result in a wide range of filter qualities. Numerous studies have evaluated the removal efficiency of PM2.5 in environments using filters with varying Minimum Efficiency Reporting Values (MERV). provides a comprehensive comparison of PM2.5 filtration efficiency for filters with different MERV ratings, analysed under seven distinct conditions (Fisk et al. Citation2002; Azimi et al. Citation2014; Brown et al. Citation2014; Zhao et al. Citation2015; Ben-David et al. Citation2018; Ben-David and Waring Citation2018; Ruan and Rim Citation2019). It is observed that filtration efficiency for identical particle sizes generally improves with higher MERV ratings. However, significant variations in actual efficiency are noted under different experimental conditions, even with the same MERV. For instance, the actual filtration efficiency of MERV8 filters ranges from 15% to 40%. In Fisk et al.’s experiment (Fisk et al. Citation2002), MERV13 and MERV14 filters demonstrated significantly higher filtration efficiency compared to other experiments. When considered alongside EquationEquation (7)
(7)
(7) , factors such as experimental room volume, filter flow, fresh air volume, and building air tightness are seen to contribute to these variations in experimental outcomes, which also been observed by other researchers (Alavy and Siegel, Citation2019; Küpper et al. Citation2019; Alavy and Siegel Citation2020).
Figure 3. Filtration efficiency of different MERV on PM2.5.
Airborne pollutants of various particle sizes pose significant health risks. Consequently, understanding the efficacy of filters across a range of particle sizes is of paramount importance. Experimental data illustrating the variation in particle size filtration are provided. displays a comparative analysis of the filtration efficiency across various MERV filters in relation to particle size changes. These findings, observed in five experimental groups The results were observed in five experiment groups (Macintosh et al. Citation2008; Waring and Siegel Citation2008; Brown et al. Citation2014; Cai et al. Citation2019), further delineate the varying filtering efficiencies for pollutants of different sizes in practical applications. It also reveals that, for identical MERV filters, a decrease in particle size corresponds to a reduction in filtration efficiency. As the particle size increases, the purification efficiency rapidly escalates until it stabilizes upon reaching a certain particle size. However, the data also indicate that not all filters with higher MERV ratings necessarily exhibit greater filtration efficiency. The anomalously high filtration efficiency of portable HEPA filters observed in Cai et al.'s experiment (Cai et al. Citation2019) appears to be an abnormal phenomenon, which is explained in combination with the theoretical equation.
Figure 4. Comparison Of filtration efficiency of different particle sizes.
3.2. Mechanism analysis
As evident from the preceding discussion, the filtration efficiency results measured by various researchers do not reflect the filters’ efficiency under rated conditions, but rather illustrate the steady-state removal efficiency of particulate pollutants influenced by a combination of factors. According to EquationEquation (5)(5)
(5) , disregarding the sedimentation of particulate pollutants in the room (k = 0), the calculated removal efficiency of particulate matter is expressed as follows:
(10)
(10)
EquationEquation (10)(10)
(10) demonstrates that the measured filtration efficiency is influenced by a multitude of factors. The efficiency of various MERV filters, as depicted in and , is governed by parameters such as
and
collectively exerting a complex influence. Specifically, the volume of fresh air is contingent upon factors such as the airtightness, ventilation and exhaust systems, and the window-opening practices of the occupants. Therefore, identical filters can exhibit varying levels of actual filtration efficiency. Notably, even high-efficiency particulate air (HEPA) filters can demonstrate low measured efficiencies under certain conditions.
As exemplified by Cai et al.'s experiment (Cai et al. Citation2019), conducted in 20 houses in Chongqing, the residents’ everyday activities, such as opening or closing doors and windows and moving freely, significantly impacted the performance of indoor filters by allowing outdoor air to infiltrate. Moreover, the low airflow rate of portable purifiers is a critical factor contributing to their reduced purification efficiency. According to EquationEquation (10)(10)
(10) , variations in G significantly influence the actual efficiency of pollutant removal. A lower value of G results in diminished pollutant removal efficacy. Consequently, the real-world performance of filters is markedly influenced by environmental conditions, making their judicious selection and proper usage crucial. The theoretical model effectively elucidates the trends observed in experimental results.
4. Pathogen survival principles
4.1. Pathogens’ natural decay
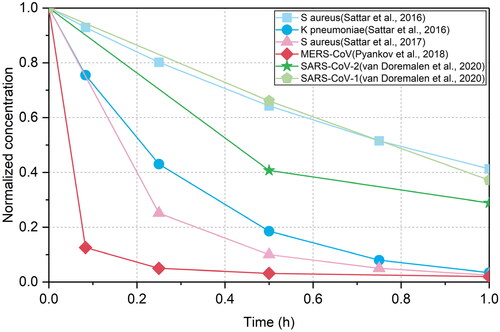
Pathogen carriers emit droplets containing pathogens into the room via activities such as breathing and coughing. As water evaporates, the concentrations of various substances in the droplets rise swiftly, altering the survival conditions for pathogens within the droplet nuclei. Understanding the decay behaviour of pathogens is crucial to comprehend their indoor transmission mechanisms. In the experiments focusing on pathogen nebulization and natural decay, pathogens were aerosolized into droplets measuring 0.5–5 μm and released into the center of an aerobiology chamber. Typically, the nebulization process spanned 600 s, during which indoor fans were activated to ensure even distribution of the droplets. Following nebulization, indoor air samples were collected at various intervals, with each sampling session lasting 2 min. Pathogen concentrations were monitored to elucidate their natural decay patterns in the air. depicts the normalized concentrations of pathogens from various nebulization experiments (Sattar et al. Citation2016; Sattar et al. Citation2017; Pyankov et al. Citation2018; van Doremalen et al. Citation2020). There was a sharp decline in the number of airborne pathogens, and the decay rate progressively decreased over time. However, the natural decay rates varied significantly among different pathogens. In the study by Pyankov et al. (Citation2018), MERS-CoV exhibited the most rapid decay rate. Variations in decay rates can also occur within the same pathogen type. For Staphylococcus aureus, one study by Sattar et al. (Citation2017) reported a significantly higher decay rate compared to another study by the same team (Sattar et al. Citation2016).
Figure 5. Pathogen’s natural decay.
4.2. Nebulized pathogens’ filtration
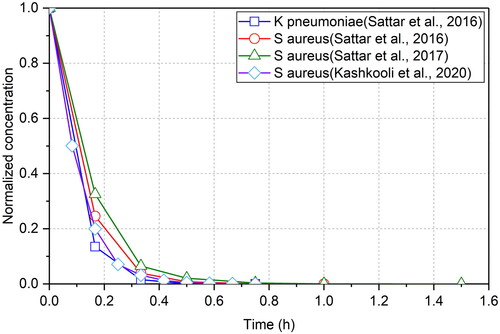
The pathogen nebulization and filtration experiments build upon the natural decay experiments. Immediately following nebulization, the filter was activated. Air samples were taken at various intervals indoors. Pathogen concentrations were monitored to assess the filter’s effectiveness in removing pathogens. displays four representative bacterial nebulization and filtration experiments, analysing their similar features. Three referenced experiments (Sattar et al. Citation2016; Zargar et al. Citation2019; Kashkooli et al. Citation2020) were conducted in the same bioaerosol chamber, while one (Sattar et al. Citation2017) took place in an abandoned family car. also reveals significant variations in bacterial species, chamber volume, filter flow, and other experimental conditions across the different studies. The experiments involved four types of bacteria, with Air Changes per Hour of filtration () ranging from 3.08 to 8.38. The same filter exhibited varying filtration efficiencies for different bacteria. For a given bacterial type,
significantly influenced filtration efficiency, with lower ACHf resulting in reduced efficiency. Additionally, the experiments indicated varying times for filters to attain 99.9% filtration efficiency, typically between 45 and 60 min, whereas reaching 95% efficiency often took only 20 min. This demonstrates that filter operation plays a crucial role in mitigating transmission risk during an outbreak.
Table 1. Summary of bacterial nebulization experiments.
illustrates the decay in concentration of two bacterial species under various filtration conditions. When compared to , it is evident that the activation of the filter substantially accelerates the decay rate of pathogens. In all four groups, the pathogen concentration reduced by over 90% within just 20 min. Clearly, the pathogen removal observed in these experiments results from the combined effects of natural decay and filtration, as suggested by EquationEquation (9)(9)
(9) .
Figure 6. Concentration of bacteria during filter operation.
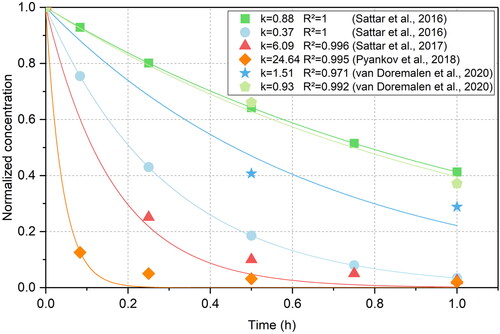
5. Verification
The experiments being discussed were conducted in a sealed experimental environment, devoid of any external pollution sources, fresh air, or filter operation. Consequently, the results of these experiments can be accurately represented using EquationEquation (8)(8)
(8) . To validate this, compares the empirical data with the curves derived from EquationEquation (8)
(8)
(8) , facilitating the determination of the natural decay rate, denoted as k. The high coefficient of determination (R2), exceeding 0.97, indicates an excellent fit between the measured data and the theoretical model. This strong correlation not only confirms the accuracy of the equation but also highlights a critical insight: a higher k value correlates with a more rapid decrease in airborne pathogen levels.
Figure 7. Comparison between predicted results and measured results in the natural decay experiments.
To facilitate a comparison between the predicted outcomes and the experimental data, illustrates the correlation between the curves derived from EquationEquation (9)(9)
(9) and the observed results. Remarkably, the fitting curves demonstrate high consistency with the experimental data, evidenced by an
value exceeding 0.997 in each instance. In contrast to the data presented in , the natural decay profiles varied across different pathogens; however, the comprehensive removal efficiency, denoted as
(where
), exhibited a notable enhancement post-filter activation. In the study conducted by Sattar et al. (Citation2016), involving two bacterial species, Klebsiella pneumoniae demonstrated a higher
value, which correspondingly led to an increased
value upon activation of the filter. Conversely, in another experiment by Sattar et al. (Citation2017), conducted within an abandoned family car, the lower
ratio resulted in a reduced
value.
Figure 8. Comparison between predicted results and measured results in the nebulization experiments.
6. Illustrative examples
These experiments demonstrate the natural decay behaviour of pathogens in the air, establishing that the operation of the filter can effectively remove the particles. This study investigates the potential risk of virus propagation due to filter operation in non-centralized air-conditioned rooms with potentially infected individuals present. By integrating mathematical models with medical experiments, a comprehensive analysis can be conducted.
6.1. No virus infections
As depicted in , the scenario assumes a small office with a volume of 180 m³ housing 10 employees. Indoor particulate pollutants originated from activities such as talking, coughing, or other actions by individuals. The assumption was that these pollutants were emitted at a constant indoor rate of 100 μg/h. The initial concentration of indoor particulate pollutants stood at 200 μg/m³, while the concentration in the outdoor fresh air was 30 μg/m³, with a fresh air volume of 90 m³/h (equating to an ACH of 0.5 h−1, attributable to ventilation). The flow rate of the filter was set at 540 m³/h (resulting in an of 3 h−1, indicative of the air-exchange rate due to in-room air filtration), disregarding the natural decay of the pollutants.
6.1.1. Effect of single-pass efficiency
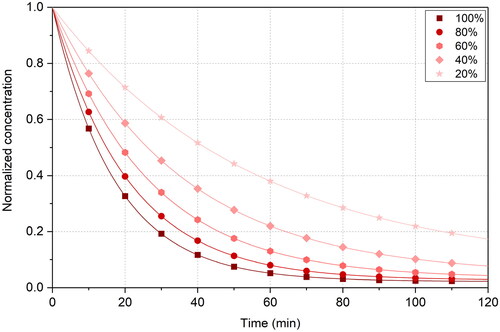
Under specified working conditions, while altering only the single-pass efficiency of the filter, the variation of pollutant concentration over time in a room with different filter efficiencies is depicted in , as per EquationEquation (7)(7)
(7) . This figure illustrates that the normalized concentration (
) signifies the ratio of the concentration at a given time to the initial concentration. It is observed that for a given filter, the pollutant removal rate diminishes over time, initially rapidly and then more gradually. Eventually, after a sufficient duration, the indoor pollutant concentration stabilizes at a specific constant value. A higher single-pass efficiency of the filter results in a more effective removal and a reduced time for the room’s pollutant concentration to stabilize. Additionally, demonstrates that even with a relatively low single-pass efficiency (20%), the attenuation of pollutant concentration can achieve 62% following 60 min of operation, substantially diminishing the risk of pollutant exposure to individuals.
Figure 9. Effect of single-pass efficiency on indoor pollutant concentration.
6.1.2. Effect of filter flow
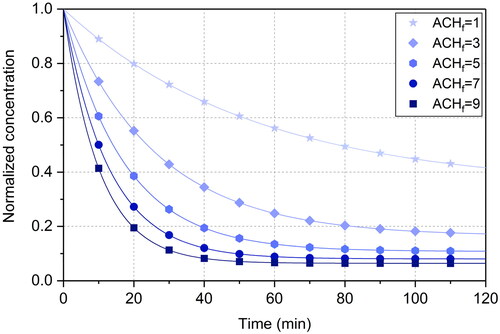
Assuming significant outdoor air pollution (C0 = 150 μg/m3) and a filter efficiency of 60%, with all other parameters held constant, only the air changes per hour () are varied (1–9 h−1). illustrates the impact of the air-exchange rate of a medium-efficiency filter on the relative change rate of indoor pollutant concentration over time, while other office parameters are maintained constant. A higher
value results in more effective filtration and a reduced time to achieve stable conditions, thus offering guidance for selecting filter parameters. During periods of severe outdoor air pollution, selecting a filter with a higher flow rate is recommended to enhance the filtering effect.
Figure 10. Effect of on indoor pollutant concentration.
6.1.3. Effect of ventilation
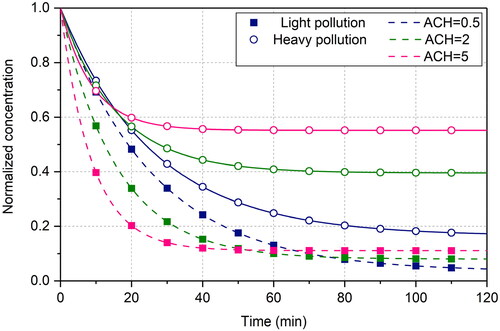
Two scenarios were examined: one with severe outdoor pollution (C0 = 150 μg/m3), and the other with minimal outdoor pollution (C0 = 30 μg/m3). The filter efficiency was set at 60%, and the at 3 h−1, with all other parameters remaining constant except for the
presents a comparison of the removal effects on indoor pollutants resulting from the ACH variation during filter operation in both scenarios. In both cases, filter operation substantially reduces the concentration of indoor particulate pollutants, with higher ACH values enabling the indoor pollutant concentration to stabilize more quickly. However, the ultimate impact of severe pollution contrasts markedly with that of mild pollution. With severe outdoor pollution, a higher
results in increased indoor pollution levels. Conversely, with minimal outdoor pollution, the ultimate indoor pollution concentration remains comparatively low. The experiments cited in Cai et al. (Citation2019) demonstrate that unregulated opening and closing of doors and windows, coupled with poor outdoor air quality, significantly disrupts indoor filter performance. During an epidemic, excessive opening of doors and windows in response to panic, especially in areas with heavy outdoor pollution, can paradoxically exacerbate the situation.
Figure 11. Effect of ACH on indoor pollutant concentration.
Although the likelihood of infected individuals being present in a room during an outbreak is considerably reduced due to stringent public health interventions, the issue remains critically relevant to human life. To investigate virus transmission risks, it is imperative to base our analysis on medical experiments and integrate these findings with the impact of indoor filter operation.
6.2. Virus infections
In order to focus on the transmission risk of potential pathogen pollution sources in the room during the outbreak, the pathogen concentration in the outdoor air is ignored (C0 = 0). EquationEquation (4)(4)
(4) can be simplified as:
(11)
(11)
The physical significance of this equation is to reveal the influence of factors such as k, Q, G, E, V on the pathogen concentration when the outdoor fresh air is clean. If:
(12)
(12)
Then
(13)
(13)
In the aforementioned equation, f (h−1) is designated as the pathogen removal index. It represents a comprehensive metric quantifying the rate at which indoor pathogen particles decay due to a multitude of factors and serves to assess variations in pathogen transmission risk under diverse operational conditions. In the previously described model room, assuming Cs equals x (m−3) and E equals 0.5x (h−1), EquationEquation (13)(13)
(13) can predict the fluctuation of pathogen concentration with varying f values across different operational durations, as depicted in . Due to the natural decay of pathogens, f is always greater than 0. illustrates that, for a constant operating duration of the room’s filtration system, the pathogen concentration declines precipitously as f increases. With a constant f value, an extended operation of the filtration system results in progressively lower pathogen concentrations. For instance, assuming continuous release of potential pathogens in the room, at f = 16, operating the filtration system for just 10 min can eliminate over 90% of the pathogens. Conversely, with f = 8, a 30-minute operation of the filtration system can eradicate over 95% of pathogens.
Figure 12. Effect of on indoor pollutant concentration.
Coincidentally, Curtius et al. (Citation2020) conducted an experiment in a classroom with a volume of 180 m3. When the doors and windows were kept closed (resulting in an ACH of 0) and four air purifiers with a flow rate of 1460.6 m3/h were used simultaneously for 30 min, the concentration of pollutants decreased by approximately 98%. This significant reduction in pollutant concentration corroborates the reliability of the analysis presented earlier. Notably, during this experiment, the air purifiers operated under a condition of = 8.11. Despite the doors and windows being closed, some level of air leakage was inevitable, leading to an ACH greater than 0. Additionally, there was a natural settling of particulate matter (denoted as k > 0). Consequently, the actual removal index (f) in the measured condition had to be greater than 8.11. This observation is consistent with the predictions made in , further validating the effectiveness of high-efficiency air filtration under these specific conditions.
7. Conclusions
This study develops a mathematical model to analyse indoor particulate pollution dynamics in non-centralized air-conditioned rooms, incorporating the effects of natural ventilation, filter flow, single-pass efficiency, and the natural decay rate of pollutants. The model’s validity is confirmed through filtration experiments, focusing on scenarios with and without infection sources during epidemic periods. Key findings include:
Theoretical model predictions align closely with empirical data, evidenced by R2 values exceeding 0.99. This congruence validates the model’s accuracy and relevance, making it a useful tool for guiding filter selection and usage in everyday settings, particularly in understanding indoor pollutant removal dynamics.
Pathogens undergo natural decay, with filter usage enhancing this process. Filters are particularly effective in removing larger particles, to which most pathogens adhere. We introduce a removal index ‘f’ to quantify the combined impact of various factors on pathogen and pollutant removal. Filter operation not only mitigates pollution spread but also shows heightened efficacy in larger particle removal.
While filters may not directly neutralize pathogens, they effectively capture them, facilitating natural decay on the filter material. Regular cleaning and maintenance of ordinary household filters are essential for safety and efficacy. Optimal filter selection, balancing cost and air quality, negates the need for excessively high-grade filtering devices. These findings provide a comprehensive framework for understanding and optimizing air filtration systems in residential settings, especially during public health crises.
| Nomenclature | ||
| C | = | The concentration of indoor particulate pollutants at any time, μg/m3 |
| C0 | = | The concentration of outdoor particulate pollutants, μg/m3 |
| Cs | = | The initial concentration of indoor particulate pollutants, μg/m3 |
| V | = | Room volume, m3 |
| Q | = | Fresh air flow, m3/h |
| G | = | Filter flow, m3/h |
| E | = | The pollutant emission rate, μg/h |
| ε | = | Single-pass efficiency of filters |
| k | = | Natural decay rate of pollutants, h−1 |
| f | = | The removal index, h−1 |
| A | = | An undetermined constant |
| ACH | = | Q/V, air-exchange rate due to ventilation, h−1 |
| ACHf | = | G/V, air-exchange rate due to in-room air filtration, h−1 |
| PM2.5 | = | The particles whose aerodynamic equivalent diameters are |
| MERV | = | Minimum efficiency reporting value |
| HEPA | = | High efficiency particulate air filter |
| R2 | = | The coefficient of determination |
Disclosure statement
The authors declare no conflict of interest. The funders had no role in the design of the study; in the collection, analyses, or interpretation of data; in the writing of the manuscript; or in the decision to publish the results.
Data availability statement
The data that support the findings of this study are available from the corresponding author, Dr J. Li, upon reasonable request.
Additional information
Funding
References
- Abba EJ, Unnikrishnan S, Kumar R, Yeole B, Chowdhury Z. 2012. Fine aerosol and PAH carcinogenicity estimation in outdoor environment of Mumbai City, India. Int J Environ Health Res. 22(2):134–149. doi: 10.1080/09603123.2011.613112.
- Adams RI, Bateman AC, Bik HM, Meadow JF. 2015. Microbiota of the indoor environment: a meta-analysis. Microbiome. 3(1):49. doi: 10.1186/s40168-015-0108-3.
- Alavy M, Siegel JA. 2020. In-situ effectiveness of residential HVAC filters. Indoor Air. 30(1):156–166. doi: 10.1111/ina.12617.
- Alavy M, Siegel JA. 2019. IAQ and energy implications of high efficiency filters in residential buildings: a review (RP-1649). Sci Technol Built Environ. 25(3):261–271. doi: 10.1080/23744731.2018.1526012.
- Azimi P, Zhao D, Stephens B. 2014. Estimates of HVAC filtration efficiency for fine and ultrafine particles of outdoor origin. Atmos Environ. 98:337–346. doi: 10.1016/j.atmosenv.2014.09.007.
- Bandaly V, Joubert A, Andres Y, Le Cann P. 2019. Adenovirus behavior in air handling unit fiberglass filters. Aerobiologia. 35(2):357–366. doi: 10.1007/s10453-019-09565-3.
- Bandaly V, Joubert A, Le Cann P, Andres Y. 2017. The fate of mengovirus on fiberglass filter of air handling units. Food Environ Virol. 9(4):464–472. doi: 10.1007/s12560-017-9310-8.
- Baraniuk C. 2020. What the diamond princess taught the world about covid-19. BMJ. 369(2):m1632. doi: 10.1136/bmj.m1632.
- Ben-David T, Wang S, Rackes A, Waring MS. 2018. Measuring the efficacy of HVAC particle filtration over a range of ventilation rates in an office building. Build Environ. 144:648–656. doi: 10.1016/j.buildenv.2018.08.018.
- Ben-David T, Waring MS. 2018. Interplay of ventilation and filtration: differential analysis of cost function combining energy use and indoor exposure to PM2.5 and ozone. Build Environ. 128:320–335. doi: 10.1016/j.buildenv.2017.10.025.
- Brown KW, Minegishi T, Allen JG, McCarthy JF, Spengler JD, MacIntosh DL. 2014. Reducing patients’ exposures to asthma and allergy triggers in their homes: an evaluation of effectiveness of grades of forced air ventilation filters. J Asthma. 51(6):585–594. doi: 10.3109/02770903.2014.895011.
- Cai J, Yu W, Li BZ, Yao RM, Zhang TJW, Guo M, Wang H, Cheng Z, Xiong J, Meng QY, et al. 2019. Particle removal efficiency of a household portable air cleaner in real-world residences: a single-blind cross-over field study. Energy Build. 203:109464. doi: 10.1016/j.enbuild.2019.109464.
- Curtius J, Granzin M, Schrod J. 2020. Testing mobile air purifiers in a school classroom: reducing the airborne transmission risk for SARS-CoV-2. Aerosol Sci Technol. 55(5): 586–599. doi: 10.1080/02786826.2021.1877257.
- Fisk WJ. 2013. Health benefits of particle filtration. Indoor Air. 23(5):357–368. doi: 10.1111/ina.12036.
- Fisk WJ, Faulkner D, Palonen J, Seppanen O. 2002. Performance and costs of particle air filtration technologies. Indoor Air. 12(4):223–234. doi: 10.1034/j.1600-0668.2002.01136.x.
- Forthomme A, Joubert A, Andrès Y, Simon X, Duquenne P, Bemer D, Le Coq L. 2014. Microbial aerosol filtration: growth and release of a bacteria-fungi consortium collected by fibrous filters in different operating conditions. J Aerosol Sci. 72:32–46. doi: 10.1016/j.jaerosci.2014.02.004.
- Fujiyoshi S, Tanaka D, Maruyama F. 2017. Transmission of airborne bacteria across built environments and its measurement standards: a review. Front Microbiol. 8(17):2336. doi: 10.3389/fmicb.2017.02336.
- Goyal SM, Anantharaman S, Ramakrishnan MA, Sajja S, Kim SW, Stanley NJ, Farnsworth JE, Kuehn TH, Raynor PC. 2011. Detection of viruses in used ventilation filters from two large public buildings. Am J Infect Control. 39(7):E30–E38. doi: 10.1016/j.ajic.2010.10.036.
- Han S, Kim J, Ko SH. 2021. Advances in air filtration technologies: structure-based and interaction-based approaches. Mater Today Adv. 9:100134. doi: 10.1016/j.mtadv.2021.100134.
- Hospodsky D, Qian J, Nazaroff WW, Yamamoto N, Bibby K, Rismani-Yazdi H, Peccia J. 2012. Human occupancy as a source of indoor airborne bacteria. PLoS One. 7(4):e34867. doi: 10.1371/journal.pone.0034867.
- Kashkooli FM, Soltani M, Zargar B, Ijaz MK, Taatizadeh E, Sattar SA. 2020. Analysis of an indoor air decontamination device inside an aerobiology chamber: a numerical-experimental study. Air Qual Atmos Health. 13(3):281–288. doi: 10.1007/s11869-019-00782-w.
- Klepeis NE, Nelson WC, Ott WR, Robinson JP, Tsang AM, Switzer P, Behar JV, Hern SC, Engelmann WH. 2001. The National Human Activity Pattern Survey (NHAPS): a resource for assessing exposure to environmental pollutants. J Expo Anal Environ Epidemiol. 11(3):231–252. doi: 10.1038/sj.jea.7500165.
- Kupferschmidt K. 2020. COVID-19 case clustering emerges as key pandemic puzzle. Science. 368(6493):808–809. doi: 10.1126/science.368.6493.808.
- Küpper M, Asbach C, Schneiderwind U, Finger H, Spiegelhoff D, Schumacher S. 2019. Testing of an indoor air cleaner for particulate pollutants under realistic conditions in an office room. Aerosol Air Qual Res. 19(8):1655–1665. doi: 10.4209/aaqr.2019.01.0029.
- Kyung SY, Jeong SH. 2020. Particulate-matter related respiratory diseases. Tuberc Respir Dis. 83(2):116–121. doi: 10.4046/trd.2019.0025.
- Leung WWF, Sun Q. 2020. Electrostatic charged nanofiber filter for filtering airborne novel coronavirus (COVID-19) and nano-aerosols. Sep Purif Technol. 250:116886. doi: 10.1016/j.seppur.2020.116886.
- Li YG, Qian H, Hang J, Chen XG, Cheng P, Ling H, Wang SQ, Liang P, Li J, Xiao S, Wei J, Liu L, Cowling BJ, Kang M. 2021. Probable airborne transmission of SARS-CoV-2 in a poorly ventilated restaurant. Build Environ. 196:107788. doi: 10.1016/j.buildenv.2021.107788.
- Macintosh DL, Myatt TA, Ludwig JF, Baker BJ, Suh HH, Spengler JD. 2008. Whole house particle removal and clean air delivery rates for in-duct and portable ventilation systems. J Air Waste Manag Assoc. 58(11):1474–1482. doi: 10.3155/1047-3289.58.11.1474.
- Morawska L. 2006. Droplet fate in indoor environments, or can we prevent the spread of infection? Indoor Air. 16(5):335–347. doi: 10.1111/j.1600-0668.2006.00432.x.
- Morisseau K, Joubert A, Le Coq L, Andres Y. 2017. Quantification of the fungal fraction released from various preloaded fibrous filters during a simulated ventilation restart. Indoor Air. 27(3):529–538. doi: 10.1111/ina.12330.
- Nakpan W, Yermakov M, Indugula R, Reponen T, Grinshpun SA. 2019. Inactivation of bacterial and fungal spores by UV irradiation and gaseous iodine treatment applied to air handling filters. Sci Total Environ. 671:59–65. doi: 10.1016/j.scitotenv.2019.03.310.
- Park DH, An S-H, Lee Y, Kim Y-J, Han B, Kim H-J. 2022. Development of on-demand antiviral electrostatic precipitators with electrothermal-based antiviral surfaces against airborne virus particles. Toxics. 10(10):601. doi: 10.3390/toxics10100601.
- Pizzatto LR, Nascimento CAR, Mendes N. 2024. An empirical model of a split-type inverter air conditioner for building energy simulation. Appl Therm Eng. 236:121714. doi: 10.1016/j.applthermaleng.2023.121714.
- Pyankov OV, Bodnev SA, Pyankova OG, Agranovski IE. 2018. Survival of aerosolized coronavirus in the ambient air. J Aerosol Sci. 115:158–163. doi: 10.1016/j.jaerosci.2017.09.009.
- Qian H, Li YG, Sun HQ, Nielsen PV, Huang XH, Zheng XH. 2010. Particle removal efficiency of the portable HEPA air cleaner in a simulated hospital ward. Build Simul. 3(3):215–224. doi: 10.1007/s12273-010-0005-4.
- Roy A, Mishral C, Jain S, Solankil N. 2019. A review of general and modern methods of air purification. J Therm Eng. 5(2):22–28. doi: 10.18186/thermal.529054.
- Ruan TC, Rim D. 2019. Indoor air pollution in office buildings in mega-cities: effects of filtration efficiency and outdoor air ventilation rates. Sust Cities Soc. 49:10.
- Sadeghi M, Greene JM, Sontag ED. 2021. Universal features of epidemic models under social distancing guidelines. Annu Rev Control. 51:426–440. doi: 10.1016/j.arcontrol.2021.04.004.
- Sattar SA, Kibbee RJ, Zargar B, Wright KE, Rubino JR, Ijaz MK. 2016. Decontamination of indoor air to reduce the risk of airborne infections: studies on survival and inactivation of airborne pathogens using an aerobiology chamber. Am J Infect Control. 44(10):E177–E182. doi: 10.1016/j.ajic.2016.03.067.
- Sattar SA, Zargar B, Wright KE, Rubino JR, Ijaz MK. 2017. Airborne pathogens inside automobiles for domestic use: assessing in-car air decontamination devices using staphylococcus aureus as the challenge bacterium. Appl Environ Microbiol. 83(10):9. doi: 10.1128/AEM.00258-17.
- Shi L, Si P, Rong X, Qian F, Lei B, Liu X. 2019. Equivalent shape factor of buildings in solar-enriched areas. HV & AC. 49(07):62–68.
- Silverman AI, Boehm AB. 2020. Systematic review and meta-analysis of the persistence and disinfection of human coronaviruses and their viral surrogates in water and wastewater. Environ Sci Technol Lett. 7(8):544–553. doi: 10.1021/acs.estlett.0c00313.
- Song J, Huang X, Shi D, Lin WE, Fan S, Linden PF. 2021. Natural ventilation in London: towards energy-efficient and healthy buildings. Build Environ. 195:107722. doi: 10.1016/j.buildenv.2021.107722.
- Srikanth P, Sudharsanam S, Steinberg R. 2008. Bio-aerosols in indoor environment: composition, health effects and analysis. Indian J Med Microbiol. 26(4):302–312. doi: 10.1016/S0255-0857(21)01805-3.
- Stadnytskyi V, Bax CE, Bax A, Anfinrud P. 2020. The airborne lifetime of small speech droplets and their potential importance in SARS-CoV-2 transmission. Proc Natl Acad Sci U S A. 117(22):11875–11877. doi: 10.1073/pnas.2006874117.
- Sublett JL. 2011. Effectiveness of air filters and air cleaners in allergic respiratory diseases: a review of the recent literature. Curr Allergy Asthma Rep. 11(5):395–402. doi: 10.1007/s11882-011-0208-5.
- Ueki H, Ujie M, Komori Y, Kato T, Imai M, Kawaoka Y. 2022. Effectiveness of HEPA filters at removing infectious SARS-CoV-2 from the air. mSphere. 7(4):e00086-00022. doi: 10.1128/msphere.00086-22.
- van Doremalen N, Bushmaker T, Morris DH, Holbrook MG, Gamble A, Williamson BN, Tamin A, Harcourt JL, Thornburg NJ, Gerber SI, et al. 2020. Aerosol and surface stability of SARS-CoV-2 as compared with SARS-CoV-1. N Engl J Med. 382(16):1564–1567. doi: 10.1056/NEJMc2004973.
- Waring MS, Siegel JA. 2008. Particle loading rates for HVAC filters, heat exchangers, and ducts. Indoor Air. 18(3):209–224. doi: 10.1111/j.1600-0668.2008.00518.x.
- WHO addresses European Parliament on COVID-19 response. 2020. https://www.euro.who.int/en/health-topics/health-emergencies/coronavirus-covid-19/news/news/2020/6/who-addresses-european-parliament-on-covid-19-response2.
- Zargar B, Sattar SA, Rubino JR, Ijaz MK. 2019. A quantitative method to assess the role of indoor air decontamination to simultaneously reduce contamination of environmental surfaces: testing with vegetative and spore-forming bacteria. Lett Appl Microbiol. 68(3):206–211. doi: 10.1111/lam.13109.
- Zhang D, Ortiz MA, Bluyssen PM. 2022. A review on indoor environmental quality in sports facilities: indoor air quality and ventilation during a pandemic. Indoor Built Environ. 32(5):831–851. doi: 10.1177/1420326X221145862.
- Zhang R, Li Y, Zhang AL, Wang Y, Molina MJ. 2020. Identifying airborne transmission as the dominant route for the spread of COVID-19. Proc Natl Acad Sci U S A. 117(26):14857–14863. doi: 10.1073/pnas.2009637117.
- Zhang X, Fan Y, Zhang J, Wang H, Wei S. 2021. Research on outdoor design PM2.5 concentration for fresh air filtration systems based on mathematical inductions. J Build Eng. 34:101883. doi: 10.1016/j.jobe.2020.101883.
- Zhao D, Azimi P, Stephens B. 2015. Evaluating the long-term health and economic impacts of central residential air filtration for reducing premature mortality associated with indoor fine particulate matter (PM2.5) of outdoor origin. Int J Environ Res Public Health. 12(7):8448–8479. doi: 10.3390/ijerph120708448.
- Zhu N, Zhang DY, Wang WL, Li XW, Yang B, Song JD, Zhao X, Huang BY, Shi WF, Lu RJ, et al. 2020. A novel coronavirus from patients with pneumonia in China, 2019. N Engl J Med. 382(8):727–733. doi: 10.1056/NEJMoa2001017.