
Abstract
Deltas like the Ganges-Brahmaputra Delta (GBD) experience significant land subsidence due to overlaying load, consolidation, sediment compaction, regional tectonics, and human activity. The southwestern region of Bangladesh, marked by its low-lying floodplain with compressible sediments, experiences significant land subsidence. However, accurate assessments for these areas are very scarce, often focusing on the point-based measurements. This study employed Interferometric Synthetic Aperture Radar analysis, spanning from 2014 to 2022, to effectively measure land subsidence, and visualize it spatially. In the study area, subsidence rates were found to be ranging from 3 to 20 mm/year, with most areas experiencing 3-10 mm/year. While some areas show higher rates of 10-13 mm/year, very few exceeded 14 mm/year. The average subsidence rate was 5.98 mm/year, demonstrating significant spatial variability, with higher rates in Gopalganj, Patuakhali, Bhola, Barishal, and other areas. The findings were validated based on existing Global navigation satellite system (GNSS) data points, affirming their reliability. Despite minor discrepancies with other measurements at specific points, the overall results align well with existing data. This comprehensive analysis provides a detailed assessment of land subsidence in the southwestern region of Bangladesh, highlighting significant spatial variability and offering valuable insights for future coastal development and risk mitigation strategies.
1. Introduction
The GBD is acknowledged as the largest delta in the world due to its vast geographical area of around 123,500 km2 and its annual transportation of around 1.06 billion tonnes of sediment (Milliman and Syvitski Citation1992; Bandyopadhyay Citation2007). There are several distributaries in the Ganges and Brahmaputra River basins, which drain the Himalayan highlands and enter the Bay of Bengal through the Meghna River in Bangladesh. Due to the large catchment area of the river system and the erodible nature of the Himalayan mountain range, the river system transports a substantial amount of water and sediment, making it one of the three world’s largest river systems (Allison Citation1998). The modern delta keeps going seaward and it is considered to be a prograding clinoform (Kuehl et al. Citation1997). The progradation results in the creation of new land due to the flat topography, which is now about 250 kilometers off the coast of Bangladesh, being widened from the mouths of the river basins (Kuehl et al. Citation2005). The sediment cover in the southwestern part of Bangladesh is very thick and over 16 kilometers of sediment lie underneath the GBD in the southeast of the hinge zone, with the thickness perhaps reaching 22 kilometers out to sea (Curray Citation1991). Since 1792, new land has been accreting at a rate of around 7.0 km2/year in Bangladesh’s southwestern delta area, where delta formation is active (Allison Citation1998).
In a delta environment, subsidence is a common phenomenon. Subsidence of delta is generally caused by the load of sediments, compaction, and tectonics in connection with anthropogenic causes such as hydrocarbon extraction, groundwater extraction, decreased aggradation, etc. (Syvitski et al. Citation2009). According to Brown and Nicholls (Citation2015), the phenomenon of land subsidence in the GBD is influenced by urbanization and various human activities, such as changes in land use and poldering. Additionally, the loss of vegetation, especially trees, as well as root decomposition cause soil to become less compact, leading to land subsidence (Day et al. Citation2011). The southwest part of Bangladesh mainly consists of compressible and collapsible alluvial sediments, along with exceptionally soft organic soil. This region also features a substantial presence of peat layers (Ali et al. Citation2004). Groundwater is also crucial for influencing the process of land subsidence (Galloway and Burbey Citation2011). Extensive pumping activities, driven by the dependence on groundwater for agricultural irrigation and domestic use, have become normal, resulting in substantial depletion of aquifer reserves. The excessive extraction of groundwater leads to the compaction of the underlying sediments, which are mainly composed of clay and silt, causing land subsidence. Syvitski et al. (Citation2009) and Brown and Nicholls (Citation2015) identified groundwater extraction as a significant contributor to land subsidence in the GBM, particularly in the southwestern region. This area is therefore vulnerable to significant land subsidence. Plate-driven tectonic processes also contribute to rates as high as or greater than 4 mm/year in the subsidence of the GBD (Goodbred and Kuehl Citation2000). As the sea level rises, increasing floods and land loss are anticipated outcomes of land subsidence (Pethick and Orford Citation2013). Subsidence can also cause the coastline to retreat by allowing the sea to encroach further inland (Milliman et al. Citation1989). This can result in the loss of valuable coastal ecosystems and increase the risk of coastal erosion and flooding, especially during storm events. So, the southwestern region of Bangladesh is more vulnerable to being affected by land subsidence.
Despite the southwestern part of Bangladesh, mainly the coastal areas, and the GBD being an area at risk for sea-level rise, there are few accurate assessments of land subsidence. Few studies have investigated the rate and amount of subsidence that is ongoing in the GBD, and the rates vary significantly (Alam Citation1996; Ericson et al. Citation2006; Brammer Citation2014; Steckler et al. Citation2022). Each research has a significant deviation of the subsidence rate. It ranged from 0.53 mm/year in the nearby region of West Bengal to 5.48 mm/year in Khulna and surrounding area based on radiocarbon dates from the Holocene sample (Alam Citation1996). However, Hoque and Alam (Citation1997) claimed that rates could exceed and reach 20 to 30 mm/year in some locations. According to Syvitski et al. (Citation2009), the subsidence rate in GBD could reach nearly 18 mm/year. Steckler et al. (Citation2016) calculated the rate of subsidence in the lower part of GBD and found historic location shows subsidence at a rate of 1-5 mm/year, GNSS vertical data and river gauges show subsidence between 4 mm/year to 8 mm/year. According to the borehole data and RSET, the subsidence rate varies between 9 and 10 mm/year. Some other studies measured the subsidence at a different rate also, Hanebuth et al. (Citation2013) indicate subsidence of 4.1 mm/year at the coastal region.
There remain several techniques to determine the rate of land subsidence, including GPS measurement, borehole study, carbon dating, archeological site investigation, and others (Brown and Nicholls Citation2015; Steckler et al. Citation2022). Most of the time, these techniques only use a few point measurements for assessing the rate of land subsidence (Higgins et al. Citation2014). Subsidence rate in a delta environment cannot be entirely determined by the few point measurements of GPS sensors, carbon dating, borehole extensometers, and tide gauges. As a result, they often fail to produce continuous subsidence maps and visualize the spatial variability of subsidence, and these techniques are not always efficient (Yan et al. Citation2012). Land subsidence can be observed in another way, utilizing the Interferometric Synthetic Aperture Radar (InSAR) technique. And InSAR technique has been proven efficient in terms of determining and mapping land subsidence, as well as visualizing the spatial variability of land subsidence (Fan et al. Citation2011; Osmanoğlu et al. Citation2011; Chaussard et al. Citation2014; Kim et al. Citation2023). Despite the different drawbacks associated with InSAR, including coherence loss, atmospheric issues, inadequate preciseness of external reference DEM, and a limited capacity to estimate horizontal displacement, this remote sensing technique has demonstrated its effectiveness through numerous advantages. These advantages include the ability to monitor large areas with high accuracy and cost-effectiveness (Fan et al. Citation2011; Tomás et al. Citation2014; Hu et al. Citation2019; Zhao et al. Citation2023). There are several InSAR approaches that still exist, each with its own advantages and limitations. These include Differential Synthetic Aperture Radar Interferometry (DInSAR), Ground-Based Synthetic Aperture Radar (GBInSAR), Persistent Scatterer Interferometric Synthetic Aperture Radar (PSInSAR), Small Baseline Subset (SBAS), and Multi-Temporal Interferometric Synthetic Aperture Radar (MTInSAR) (Gabriel et al. Citation1989; Tarchi et al. Citation1999; Bürgmann et al. Citation2000; Ferretti et al. Citation2001; Lanari et al. Citation2007; Pratesi et al. Citation2015; Qu et al. Citation2015). DInSAR PSInSAR, GBInSAR, and MTInSA techniques were quite commonly used for deformation related studies (Aswathi et al. Citation2022). Using the InSAR technique, Kim et al. (Citation2023), Raju et al. (Citation2024), and Raju et al. (Citation2022) investigated the groundwater induced land subsidence. However, the Differential SAR Interferometry (DInSAR) approach has been utilized to measure the land subsidence rate in the southwestern region of Bangladesh in this study.
It is anticipated that the southwestern part of Bangladesh is subsiding at different rates in different areas, with a significant degree of spatial variability. Because, net subsidence is a very complicated process as it is affected by local tectonics, the compaction and sedimentation processes, and anthropogenic activities (Brown and Nicholls Citation2015). Steckler et al. (Citation2022) found varying rates of subsidence for various environmental and physical conditions in the GBD. In order to plan and zone for future developments, it’s important to comprehend the spatial variations and alterations in land subsidence. Therefore, it’s essential to investigate the spatial discrepancies in land subsidence across different areas in the southwestern region of Bangladesh.
The previous research conducted on the Ganges-Brahmaputra Delta primarily concentrated on measuring land subsidence at specific locations in the southwestern region of Bangladesh. These studies also examined the consequences of human activities and anthropogenic influences, as well as sedimentation, but did not extensively map the area in detail (Brown and Nicholls Citation2015; Steckler et al. Citation2022; Raff et al. Citation2023). To address this gap, the study employs the InSAR technique and utilizes multiple Sentinel-1 images to measure land subsidence in the GBD of the southwestern region of Bangladesh starting from 2014. The land subsidence detected by the InSAR technique has been verified through validation with other ground measurements obtained from secondary sources. These ground measurements primarily consist of GNSS observations and other point-based measurements provided by Steckler et al. (Citation2022) and Brown and Nicholls (Citation2015). As well as the spatial variability of land subsidence is analyzed for the study area.
2. Study area
2.1. Location
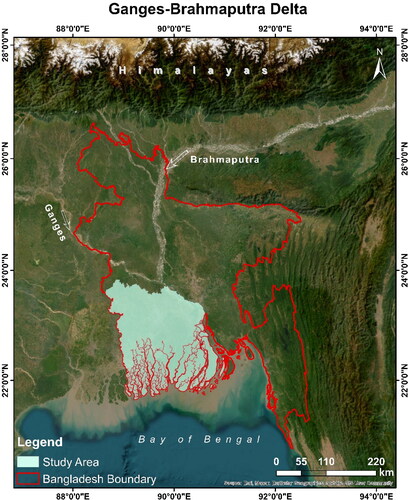
The GBD has an approximate sediment discharge of 1.06 billion tonnes per year and has the largest land area among the deltas (Milliman and Syvitski Citation1992; Kuehl et al. Citation1997). Delta formation is very active in the southwestern part of Bangladesh (Allison Citation1998). The GBD is a low-lying largely flat landscape, with a delta surface gradient of ∼5 × 10⁻⁵ (Wilson and Goodbred Citation2015). The study area is situated within the geographic coordinates of 21°39′03″ N to 23°50′23″ N latitude and 88°37′30″ E to 91°00′02″ E longitude (). It encompasses 18 districts in the southwestern region of Bangladesh. The southwest coastal region of Bangladesh possesses a distinctive brackish water environment due to its exposure to tides and reliance on freshwater sources from upstream (Mondal et al. Citation2013). The region, characterized by extensive low-lying areas surrounded by artificial polders, is deemed especially susceptible to climate change-induced dangers. Approximately 28% of the study region has an elevation that is lower than 5 meters. Due to the low elevation, the southwestern region of Bangladesh is particularly susceptible to be impacted by freshwater inundating, coastal erosion and overflowing, and intrusion of saltwater (Brouwer et al. Citation2007; Islam et al. Citation2010).
Figure 1. Map of GBD showing the aerial view of the study area. The Ganges-Brahmaputra river system is also visible on the map.
2.2. Tectonic and geologic settings
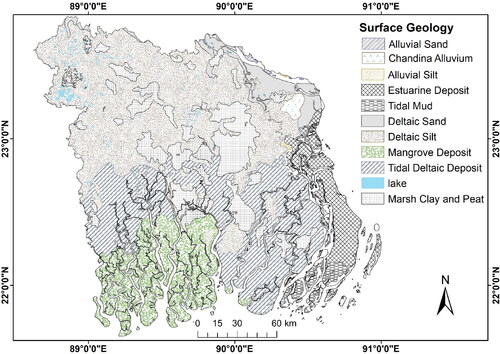
The GBD's alluvial layer reveals an interesting and unique geotectonic zone. The Bengal Basin is majorly dominated by the thick layer of sediments (), which covers the majority of Bangladesh (Kuehl et al. Citation2005). The Bengal deep-sea fan spans from the northern region of Bangladesh to the Bay of Bengal. The Shillong Massif is situated in the northern region of the Bengal Basin, while the Indian Shield is positioned in the western and northwestern directions. To the east is the Tripura Fold Belt, and the Bengal Basin is enclosed by the Bay of Bengal in the southern direction (Johnson and Nur Alam Citation1991; Kuehl et al. Citation1997). Since the Miocene epoch, a sediment deposit with a thickness of 4 kilometers has been present near the hinge line in Bangladesh, extending from the northeast to the southeastern region. Subsequently, sediments from the delta have advanced from the hinge line, resulting in an increase in the seafloor thickness to approximately 10 kilometers. (Lindsay et al. Citation1991).
Figure 2. The surface geology map of the study area. The map is collected and modified from the data of USGS's global energy project (Persits et al. Citation2001).
The GBD is located very close to the junction of two convergent boundaries, namely the Himalayan and Burma Arcs (Singh et al. Citation2016). All parts of the region’s river sediments have been affected by the tectonic motion and activity of the basin. As a result of the ongoing collision between the Burmese plate and the eastern boundary of both the Indian continent and the neighboring oceanic crust, the Bengal Basin has been subsiding since the Miocene (Alam et al. Citation2003). Bangladesh is mainly subdivided into two different tectonic units and that is separated by the hinge zone. The northeastern segment is named as stable platform and the southeastern part is a geosynclinal basin (Alam Citation1989). Mostly inside the geosynclinal basin, the study area is located.
3. Materials and methods
3.1. Data and materials
Several satellites include SAR sensors on board, so they can collect data for InSAR purposes. For this study, two successive Sentinel-1 frames from 2014 as the reference image, and two successive Sentinel-1 frames from 2022 as the secondary Sentinel-1 images were employed (). Four unique C-band imaging modes are included in the Sentinel-1 mission, each with a distinct coverage area up to 400 km and resolution down to 5 m (Torres et al. Citation2012). It has a dual-polarization capability, quick revisit times, and speedy product release (Geudtner et al. Citation2014). Precise measurements of the satellite’s location and orientation are provided for each observation. Sentinel-1A data were used for this study, the product type was Single Look Complex (SLC), and the beam mode was selected as Interferometric Wide swath (IW). Data is freely available on the NASA EarthData archive (website: https://asf.alaska.edu/). The extent of the study area is covered by two successive Sentine-1A slices. SNAP software was used to process the InSAR data and SNAPHU was used for phase unwrapping. Both software are freely available. The surface geologic map of Bangladesh was collected from USGS’s World Energy project (Persits et al. Citation2001). The GNSS vertical deformation records and the past point measurements of land subsidence are retrieved from secondary sources, analyzed by Steckler et al. (Citation2022) and Brown and Nicholls (Citation2015), and utilized for the purposes of validation and comparison. To visualize the data and create maps, Google Earth Pro and ArcGIS 10.8.2 were utilized.
Table 1. The list SAR imagery that were employed for the InSAR analysis and their characteristics. All images are taken in good atmospheric condition.
3.2. Methods
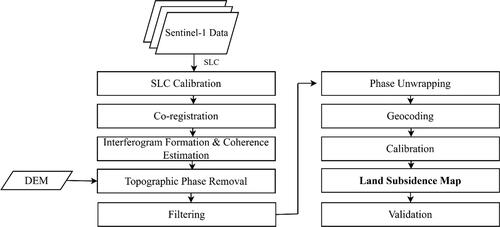
The study employs InSAR analysis to map land subsidence in Bangladesh’s southwestern region over a 7.4-year period, from 2014 to 2022. By processing Sentinel-1 radar images, interferograms are generated to detect surface deformations caused by subsidence. The study area is vast, necessitating the use of multiple images to cover it entirely. Co-registration, a crucial step for precise phase measurements, is carried out using orbit files and DEM data. The interferograms are then produced, highlighting areas of vertical displacement. Phase unwrapping is performed to convert wrapped interferograms into continuous functions, aiding in the accurate quantification of land subsidence. Low coherence values in the images are masked to enhance reliability. Finally, geocoding, calibration, and validation steps are conducted to refine and verify the subsidence maps ().
Figure 3. Map showing the workflow of this study.
3.2.1. Pre-processing and interferogram formation
Phase difference between SAR images taken from different viewpoints or at different times are employed in InSAR (Bamler and Hartl Citation1998). After importing the reference and secondary images into SNAP, image preprocessing has started. Since the study area is much larger than the swath of any single Sentinel-1 images and only one image is insufficient to encircle the full study area, two Sentinel-1 slices were used to capture the study area. The sub-swath was then selected from each image depending on the spatial coverage of the area in which the study was being conducted. To successfully complete the InSAR analysis and cover the entire study area, a total of nine interferometric-wide sub-swath pairs were split. In addition, subsequent processing stages require less time if the analysis is limited to a small area rather than the entire scene. For correct satellite positioning and velocity information, the initial stage was to apply or define the orbit files to Sentinel-1 products. The co-registration of the Sentinel-1 sub-swath pairs was the next stage. Aligning SAR images of the acquisition sites is called co-registration, and it is necessary for determining the phase difference accurately and minimizing noise (Li and Bethel Citation2008). A two-step procedure was typically used to attain high precision: first, coarse geometrical co-registration utilizing the Digital Elevation Model (DEM) and applying the orbital information; and second, fine co-registration using the Enhanced Spectral Diversity (ESD) technique (Scheiber and Moreira Citation2000). The number of GCPs was set to 3000.
Images that were co-registered are required in order to produce wrapped interferograms. It is possible to determine the area’s vertical deformation by processing two interference patterns that are similar to one another from the same area using differential SAR (Wang et al. Citation1997). A shift in the surface due to the land subsidence can be spotted as a phase difference in the InSAR technique. Surface deformation, atmospheric phase delay, topography, and various noise sources are all included in the interferometric phase difference (Hooper et al. Citation2012).
The total phase difference is a combination of several contributing factors, including phase differences caused by the movement of pixels, atmospheric-induced acquisition delay, residual phase resulting from orbit errors, residual phase caused by an inaccurate viewing angle, noise-induced phase, and others. The utilization of a wrapping operator enables the unification of these components, ensuring that the overall phase remains within a defined phase cycle range. In the absence of any additional variables, the topographic phase discrepancy can be eliminated from the interferogram, thereby exposing only the changes on the surface caused by land subsidence. Atmospheric phase was considered negligible in this study. The interferograms were generated by employing the interferogram formation tool that is designated specifically for the generation of interferograms in SNAP. During the formation of the interferograms, the flat earth phase was subtracted. In order to evaluate the coherence between the images used for the study, a coherence band was also generated using the layers available in the co-registered complex images. Both the differential interferograms and SLC images were then debursted, which removed the horizontal stripes. Each sub-swath contains several burst images, each of which was processed as an SLC pair. SRTM 1 arc second, a digital elevation model that is automatically available within the SNAP software, was used to eliminate the topographic phase. The Goldstein phase filtering was implemented to improve the images’ quality and lessen residual noise.
3.2.2. SNAPHU export and phase unwrapping
Following the implementation of phase filtering techniques, the resulting outputs consisted of wrapped interferograms. In an interferogram devoid of any noise, the spatial separation between consecutive pairs of fringes is precisely equal to 2π. Nevertheless, the actual interferogram exhibits an intricate pattern of noise (Qing et al. Citation2004). The interpretation of wrapped interferograms is complicated due to the ambiguity of the phases in terms of 2π. Consequently, the interferograms that had been wrapped were subsequently subjected to an unwrapping process. The process involved the conversion of an interferogram, which is a wrapped function, into a smooth and continuous function. The process of unwrapping was facilitated through the acquisition of noise-free interferograms. InSAR quantifies the relative phase change within a range of 0 to 2π, representing a complete wavelength. This implies that if the disparities in the distances between two targets are whole multiples of wavelengths, they exhibit the same phases. Because of this, it is important to find the different multiples of 2π. Because of phase unwrapping, it is possible to get clear phase values out of a SAR interferogram (Hooper and Zebker Citation2007). The process involved taking the overall pixel phase difference between two points and subtracting all full 2π intervals. The wrapped function resets to zero when the phase of the linear combination reaches a value of 2π.
Phase unwrapping was carried out using the SNAPHU software. In order to obtain the appropriate source bands for phase unwrapping, the wrapped images were initially exported. The images that had been unwrapped were subsequently imported once more following the completion of phase unwrapping. Subsequently, the images were capable of quantifying displacement. The determination of line of sight (LOS) displacement was subsequently determined and the vertical displacement was derived using the incident angle. The output provided measurements of displacement in meters, which signifies the occurrence of subsidence.
3.2.3. Post-processing and subsidence mapping
Large temporal and baseline gaps between SAR images employed for this study resulted in a lack of coherence. Given the requirement for pixels to possess a high coherence value, it was imperative to apply a masking technique to exclude regions exhibiting low coherence. A raster operation was employed for the purpose of masking the pixels with low coherence. The outputs show the coherent pixels of land subsidence only and the reliability of the coherent pixels is higher than the subsidence information without masking low coherence. SAR images have the potential to inaccurately represent distances as a result of topographical variations within a landscape and the orientation of the satellite sensor. Terrain correction is employed in order to reduce distortions in the image, consequently providing a more precise geometric representation. The use of Range Doppler Terrain Correction was employed for the purpose of geocoding the Sentinel-1 product, with the WGS 1984 geographic coordinate system serving as the designated reference system.
The primary characteristic of the constant phase shift caused by orbital drift is predominantly unpredictable in nature. In general, SAR images obtained from various positions have the capability to determine relative displacement. As a result, it was necessary to calibrate the data using a GPS station. No point within the study area has been identified as having a subsidence rate of 0. Consequently, the interferograms produced during the analysis conducted in this study were calibrated using GPS data acquired from secondary sources. Steckler et al. (Citation2022) offer GPS-based observations of land subsidence. One of the sites was used to calibrate the result.
Following the assessment of land subsidence in the designated study area and the subsequent application of terrain correction, subsidence maps were generated for the mentioned study area. The subsidence bands of all interferometric wide swaths were combined into a mosaic, which was then exported as a GeoTIFF file. The results are finally validated.
4. Results
4.1. Rate of land subsidence
InSAR analysis has been carried out for the study area, and the interferograms have been produced, filtered, and unwrapped. The InSAR analysis processing involved the application of multiple parameters, with the optimal parameter being selected. The utilization of the most optimal results obtained from unwrapped interferograms is both important and logical. Consequently, the optimal output is utilized for the generation of the land subsidence map. The following figure () depicts maps of subsidence for the study area.
Figure 4. Map showing the rate of land subsidence for only coherent pixels in the study area. The map also displays the locations of the GNSS stations that were utilized for validation. Service layer source: ESRI, Garmin, GEBCO, NOAA, and other contributors.
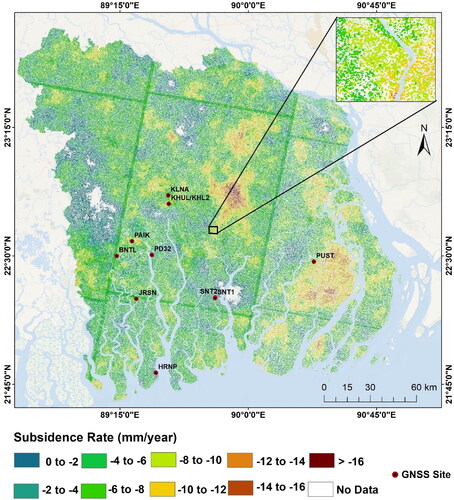
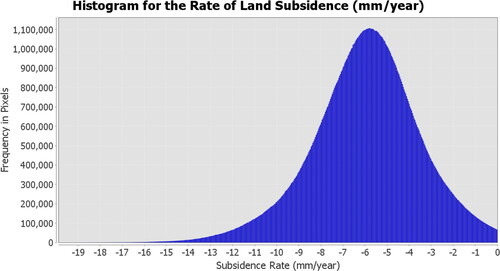
Numerous closed water bodies and rivers are present in the studied area, which primarily indicates areas with less coherent pixels. Due to the fact that delta formation is still active in the study area, temporal decorrelation of pixels in that region may be caused by new sediment deposition and erosion (Schepanski et al. Citation2012). Furthermore, due to the high population density in the study area, it is likely that numerous human influences could potentially decrease the spatial coherence of pixels across different sites (Wang et al. Citation2021). Masking low values of coherence is extremely important for identifying highly coherent pixels. Pixels with a very low coherence value may not always be reliable. Consequently, low-coherent pixels caused by temporal and object decorrelation are masked. The coherent pixels are then used to map the land subsidence for the studied area. The study area exhibits a maximum land subsidence rate of around 20 mm/year for a small number of pixels, whereas the average rate of land subsidence is determined to be approximately 5.98 mm/year. The majority of the pixels indicate subsidence at a rate of between 3 and 10 mm/year, a significant number of pixels exhibit subsidence at a rate of between 10 and 13 mm/year, and only a tiny proportion of pixels show subsidence at a rate of 14 mm/year or higher ().
provides a clearer representation of the frequency of the land subsidence rate, as it presents a histogram depicting the distribution of land subsidence rates. The study area as a whole experienced varying rates of land subsidence, and local variations in land subsidence are also apparent. The lower range of values signifies the predominant subsidence pattern observed in the southwestern region. The observed occurrence of pixels exhibiting a subsidence rate of 14 mm/year or greater could possibly be subject to the influence of local geological conditions, specifically the presence of soft organic clay layers, as well as anthropogenic factors within the region. Further investigation is necessary to gain a comprehensive understanding of the underlying factors that contribute to this intensified rate of land subsidence. In their study, Fahim et al. (Citation2023) analyzed the spatiotemporal variability of ground water level fluctuations in Bangladesh, highlighting the localized and regionalized reduction of water levels in the southwestern region as well. The spatial variations of land subsidence could be influenced by the local and regional variability of ground water level fluctuation.
Figure 5. Histogram showing the frequency of the rate of land subsidence experienced by the entire study area. It is visible that the most frequent rate of land subsidence is very close to 6 mm/year.
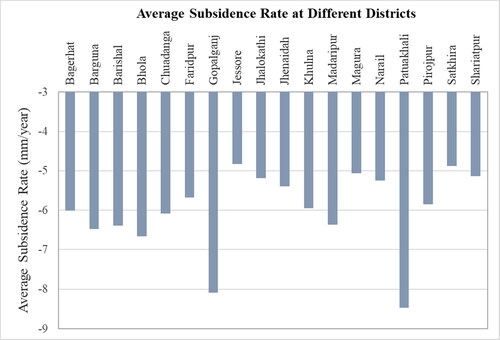
presents a graphic representation of the average rate of land subsidence across various districts in the southwestern region of Bangladesh. With an average rate of land subsidence that surpasses 8 mm/year, Gopalganj and Patuakhali appear to experience a considerably higher rate of subsidence. Bhola, Barishal, Barguna, Madaripur, and Khulna are regions that exhibit a significant number of hotspots characterized by a pronounced occurrence of land subsidence.
Figure 6. Graph showing the average subsidence rate of different districts in the study area.
4.2. Validation
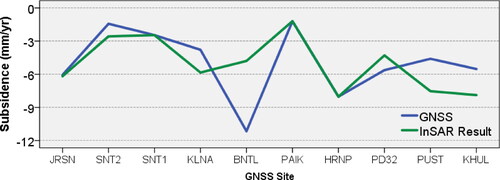
The validation of the results derived from the InSAR analysis was conducted by utilizing GPS data collected from secondary sources relevant to the chosen study area. Steckler et al. (Citation2022) synthesized the subsidence experienced by the GBD using different techniques. The subsidence data of several GNSS locations was collected and plotted with the result obtained using the InSAR technique. There are data for a limited number of locations, some of which are outside the study area. Therefore, only the common points were validated.
The plot illustrates that the subsidence measured by InSAR analysis is almost identical to the subsidence rate measured by GNSS data (). Nonetheless, at a certain point (BNTL), the data are distinctive. Compared to the GNSS data, the measured subsidence rate at this location is significantly lower. According to the geological map of Bangladesh (Persits et al. Citation2001), this site does not fall inside the marsh clay and peat layer coverage. This particular point is situated at the outermost edge of an interferometric wide swath, where the two layers intersect during the process of mosaicking (). The reliability of data obtained from edge regions is generally uncertain. The vertical records of the GNSS site have an important amount of uncertainty as well.
Figure 7. Comparison between the result attained from the InSAR analysis and the GNSS data that are available for the study area.
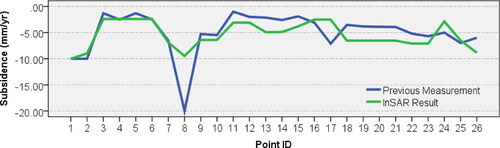
The comparison between the result of this study and the previously measured subsidence rate was also evaluated. Brown and Nicholls (Citation2015) compiled the rate of land subsidence for the GBD from various sources. They are basically different types of point measurements using GPS, carbon dating, gravity survey, archaeological site investigation, boring, geomorphic surveys, tank excavation before. The compiled subsidence data were collected and plotted on a graph against the outcome of the InSAR technique (). Although the subsidence rate obtained in this study differs slightly from previous measurements at a few points, the trend is nearly the same, as shown in . It can be said that the acquired result demonstrates an excellent level of agreement with the previous measurements.
Figure 8. The comparison between the previously measured land subsidence and the InSAR measurement was obtained in this study.
5. Discussion
5.1. Subsidence scenario
The comprehensive InSAR analysis conducted in this study has provided valuable insights into the land subsidence scenario in the southwestern region of Bangladesh. Over a cumulative period of 7.4 years, from 2014 to 2022, detailed subsidence maps were generated, highlighting both the total land subsidence and the annual rates of subsidence. Pixels that have a very low coherence are not guaranteed to be reliable in every situation (Yunjun et al. Citation2019). As a result, pixels with low coherence values caused by temporal and object decorrelation were masked. The result indicates that there is high variability in the rate of land subsidence across the study region. As depicted on the map, the majority of the study area experienced between 0.02 and 0.06 meters of subsidence from 2014 to 2022. Subsidence rates range from 4 to 10 mm/year throughout the vast majority of pixels, with a larger number of pixels showing rates of 10 to 13 mm/year and a small percentage showing rates of 14 mm/year or higher (). These findings are consistent with earlier point measurements of ground subsidence in the study area, which are discussed in the part that focuses on validation ( and ).
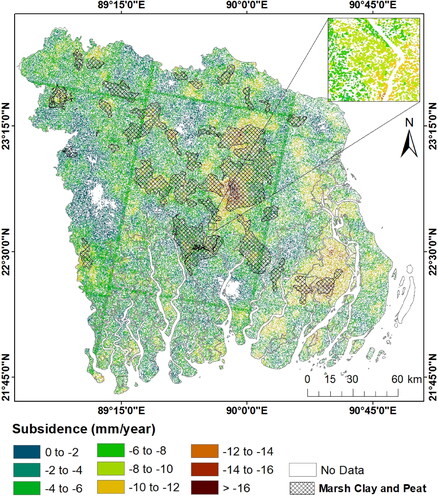
The study area exhibited notable variations in subsidence rates among its different sections. Some district-wise variations are seen when placing the district map with the subsidence map. In the majority of Gopalganj, Patuakhali, Bhola and Barishal districts, as well as in many parts of Khulna, Pirojpur, Madaripurm, Barguna, and Bagerhat, where beel and depression deposits are relatively prevalent, the rate is higher (). Certain areas in Jessore and Satkhira are characterized by a notable occurrence of land subsidence. Many experts have observed that a substantial portion of the southwestern regions of Bangladesh exhibit a high level of organic matter and soft clay, and the presence of peat layers (Ali et al. Citation2004). For the USGS's global energy project, Persits et al. (Citation2001) compiled the spatial coverage of the geologic units of Bangladesh and identified layers of marsh clay and peat in different areas. Both peat layers and marsh clay are present in the study area. These soft organic layers are generally more susceptible to land subsidence. To establish correlations, we extracted the unit of the marsh clay and peat layer for our study area from their map and visualized it alongside the subsidence rate (). The spatial distribution of peat layers, in conjunction with the subsidence rate, was mapped by overlaying one onto the other. The results of study showed a strong spatial correlation: the region characterized by the presence of peat and organic clay layers has significantly greater rates of land subsidence compared to areas without these geological characteristics. This observation was graphically strengthened by the map that displayed the spatial coverage of peat layers and rates of subsidence, emphasizing the significant influence of peat and organic clay layers on the dynamics of land subsidence. The regions characterized by peat and marsh clay layers exhibited an average subsidence rate of 7.31 mm/year. This value significantly exceeds the overall average subsidence rate in the study area, which was determined to be 5.98 mm/year. The connection between the localized subsidence rates associated with peat and marsh clay layers and the overall average subsidence rate provides additional support for the findings.
Figure 9. Map showing the rate of land subsidence from 2014 to 2022 in the entire study area. It is very clearly visible that the rate of land subsidence varies significantly in different districts.
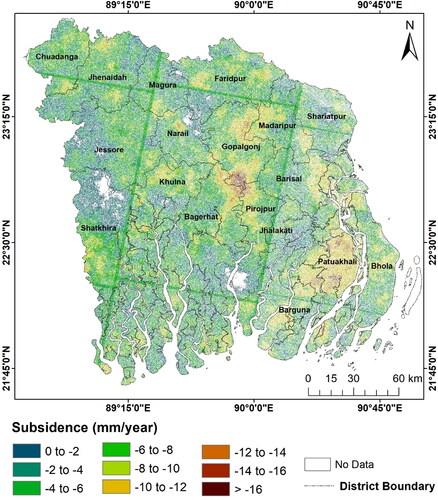
Figure 10. The rate of land subsidence along with the coverage of marsh clay and peat. The black cross lines indicate the marsh clay and peat layer.
5.2. Significance of this study for future development in coastal areas
Bangladesh’s flat, low-lying floodplain, particularly in the southwestern coastal regions, faces heightened vulnerability to the impacts of sea-level rise and related challenges. With the increasing sea levels driven by climate change, the risks of coastal flooding, erosion, and the loss of crucial coastal ecosystems are magnified, particularly during extreme weather events. Prolonged land subsidence exacerbates these perils, further jeopardizing local communities’ resilience to sea-level rise. This phenomenon not only affects their livelihoods but also leads to a reduction in biodiversity. Despite the heightened vulnerability of the southwestern region to sea-level rise, there have been limited accurate assessments of land subsidence. This study thus fills a crucial knowledge gap on this pressing issue.
The overall repercussions of land subsidence in Bangladesh are indeed extensive and severe. They encompass the loss of valuable agricultural land and the potential damage to critical national infrastructure, including roads, bridges, embankments, and utility lines. Factoring in subsidence rates during the construction of such infrastructure is essential for ensuring long-term sustainability and resilience. The Coastal Embankment Improvement Project, a major initiative led by the World Bank, stands as a shining example of the proactive approach required to mitigate the adverse impacts of climate change-induced hazards in Bangladesh’s coastal regions (Forni Citation2015).
Looking ahead, precise land subsidence analysis must be integrated into future development and risk reduction planning. This is pivotal in minimizing the consequences of climate change and sea-level rise. Having accurate measurements of subsidence is paramount for delta planning in our country, ultimately ensuring the long-term sustainability of our communities by reducing vulnerability and mitigating risks.
5.3. Limitation
The current study carries certain limitations and offers room for refinement. There is a lack of coherence throughout the study area. Performing InSAR analysis is always challenging in Asian deltas because of having very dense vegetation, the presence of several aquatic bodies, rapid change of vegetation cover, the presence of cloud coverage and moisture, etc. Due to their short wavelength, C-band images are incapable of penetrating vegetation.
Moreover, the availability of facilities for precise calibration of InSAR results, a critical factor in obtaining more robust data, is hindered by a scarcity of in situ GPS observations in many areas. To comprehensively cover the entire study area, nine pairs of interferometric wide swaths were employed. Yet, it is worth noting that during the process of image mosaicking, some noise is introduced at the peripheries of each interferometric wide swath, as illustrated in . These considerations point to areas where future research and methodological advancements can further refine the accuracy and reliability of land subsidence assessments.
6. Conclusion
In this comprehensive study, an in-depth analysis of land subsidence in the southwestern region of Bangladesh was conducted utilizing advanced InSAR technology. Over a period of 7.4 years, from 2014 to 2022, detailed subsidence maps were generated, offering valuable insights into the evolving landscape. The rate of land subsidence in the study area is determined utilizing InSAR analysis of Sentinels-1 images and the results are validated. The following conclusions can be drawn from the findings of this investigation:
The subsidence map illustrates that a great deal of pixels in the study area experienced subsidence within the range of 3 to 10 mm/year. A considerable proportion of pixels exhibit subsidence rates ranging from 10 to 13 mm/year, while only a small number of pixels demonstrate subsidence rates of 14 mm/year or higher.
The study area demonstrates a peak rate of land subsidence reaching approximately 20 mm/year in certain regions, while the overall average rate of land subsidence is estimated to be approximately 5.98 mm/year.
The southwestern region of Bangladesh revealed significant spatial differences in subsidence rates across its various segments. The rate is high in most of the Gopalganj, Patuakhali, Bhola, and Barishal districts and many parts of Madaripur, Barguna, Khulna, Pirojpur, and Bagerhat. Some places in Jessore and Satkhira have considerable amounts of land subsidence. The regions characterized by peat and organic clay layers have a comparatively accelerated rate of subsidence in comparison to other places.
Even though the subsidence rate found in this study is slightly different at certain locations from the GNSS and other point measurements, the overall pattern is remarkably identical. The obtained result demonstrates a high level of agreement with the other measurements.
Conducting InSAR analysis in delta areas presents inherent difficulties due to factors such as the presence of dense vegetation, numerous aquatic bodies, rapid vegetation cover changes, cloud coverage, and moisture. These factors contribute to temporal decorrelation, further complicating the analysis process. The application PS-InSAR technique in conjunction with L-Band SAR imagery has the potential to enhance the accuracy of subsidence measurements.
The comprehensive mapping of land subsidence undertaken in this study aims to provide significant support to the nation and its government in future development planning and risk mitigation efforts, especially in coastal areas across the entire study area. Furthermore, this study serves as a vital resource for policymakers, urban planners, and environmental scientists in Bangladesh, offering essential insights into the intricate mechanisms of land subsidence. It underscores the pressing need for proactive measures to address the evolving challenges posed by subsidence, sea-level rise, and climate change in Bangladesh’s coastal regions.
Consent for publication
All the authors consented to publish the paper.
Acknowledgments
The authors are grateful to the Department of Disaster Science and Climate Resilience, University of Dhaka for providing research facilities and allowing them to perform this work. Thanks goes to the European Space Agency (ESA) for providing the SAR images for this study and to the researcher who shared the data that were used to validate the result. Grateful acknowledgement is extended to the Alaska Satellite Facility for presenting the data, which were obtained from their website (https://search.asf.alaska.edu/). Finally, we extend our gratitude to the University of Dhaka for covering the Article Processing Charges associated with the publication.
Disclosure statement
No potential conflict of interest was reported by the author(s).
Availability of data and materials
The data can be made available upon request to the corresponding author.
References
- Alam M. 1989. Geology and depositional history of Cenozoic sediments of the Bengal Basin of Bangladesh. Palaeogeogr Palaeoclimatol Palaeoecol. 69:125–139. doi: 10.1016/0031-0182(89)90159-4.
- Alam M. 1996. Subsidence of the Ganges—Brahmaputra Delta of Bangladesh and associated drainage, sedimentation and salinity problems. In: Sea-level rise coast subsid. Springer; p. 169–192.
- Alam M, Alam MM, Curray JR, Chowdhury MLR, Gani MR. 2003. An overview of the sedimentary geology of the Bengal Basin in relation to the regional tectonic framework and basin-fill history. Sediment Geol. 155(3–4):179–208. doi: 10.1016/S0037-0738(02)00180-X.
- Ali RME, Karim MF, Rahman MZ. 2004. Engineering geology of Khulna Metropolitan City area. Bangladesh J Geol. 23:83–92.
- Allison MA. 1998. Historical changes in the Ganges-Brahmaputra delta front. J Coast Res.14(4):1269–1275.
- Aswathi J, Kumar RBB, Oommen T, Bouali EH, Sajinkumar KS. 2022. InSAR as a tool for monitoring hydropower projects: a review. Energy Geosci. 3(2):160–171. doi: 10.1016/j.engeos.2021.12.007.
- Bamler R, Hartl P. 1998. Synthetic aperture radar interferometry. Inverse Probl. 14(4):R1–R54. doi: 10.1088/0266-5611/14/4/001.
- Bandyopadhyay S. 2007. Evolution of the Ganga Brahmaputra delta: a review. Geogr Rev India. 69(3):235–268.
- Brammer H. 2014. Bangladesh’s dynamic coastal regions and sea-level rise. Clim Risk Manag. 1:51–62. doi: 10.1016/j.crm.2013.10.001.
- Brouwer R, Akter S, Brander L, Haque E. 2007. Socioeconomic vulnerability and adaptation to environmental risk: a case study of climate change and flooding in Bangladesh. Risk Anal. 27(2):313–326. doi: 10.1111/j.1539-6924.2007.00884.x.
- Brown S, Nicholls RJ. 2015. Subsidence and human influences in mega deltas: the case of the Ganges–Brahmaputra–Meghna. Sci Total Environ. 527-528:362–374. doi: 10.1016/j.scitotenv.2015.04.124.
- Bürgmann R, Rosen PA, Fielding EJ. 2000. Synthetic aperture radar interferometry to measure Earth’s surface topography and its deformation. Annu Rev Earth Planet Sci. 28(1):169–209. doi: 10.1146/annurev.earth.28.1.169.
- Chaussard E, Wdowinski S, Cabral-Cano E, Amelung F. 2014. Land subsidence in central Mexico detected by ALOS InSAR time-series. Remote Sens Environ. 140:94–106. doi: 10.1016/j.rse.2013.08.038.
- Curray JR. 1991. Possible greenschist metamorphism at the base of a 22-km sedimentary section, Bay of Bengal. Geol. 19(11):1097–1100. doi: 10.1130/0091-7613(1991)019<1097:PGMATB>2.3.CO;2.
- Day JW, Kemp GP, Reed DJ, Cahoon DR, Boumans RM, Suhayda JM, Gambrell R. 2011. Vegetation death and rapid loss of surface elevation in two contrasting Mississippi delta salt marshes: the role of sedimentation, autocompaction and sea-level rise. Ecol Eng. 37(2):229–240. doi: 10.1016/j.ecoleng.2010.11.021.
- Ericson J, Vorosmarty C, Dingman S, Ward L, Meybeck M. 2006. Effective sea-level rise and deltas: causes of change and human dimension implications. Glob Planet Change. 50(1–2):63–82. doi: 10.1016/j.gloplacha.2005.07.004.
- Fahim AKF, Kamal ASMM, Shahid S. 2023. Spatiotemporal change in groundwater sustainability of Bangladesh and its major causes. Stoch Environ Res Risk Assess. 37(2):665–680. doi: 10.1007/s00477-022-02294-z.
- Fan H, Deng K, Ju C, Zhu C, Xue J. 2011. Land subsidence monitoring by D-InSAR technique. Min Sci Technol. 21(6):869–872. doi: 10.1016/j.mstc.2011.05.030.
- Ferretti A, Prati C, Rocca F. 2001. Permanent scatterers in SAR interferometry. IEEE Trans Geosci Remote Sensing. 39(1):8–20. doi: 10.1109/36.898661.
- Forni MS. 2015. Bangladesh-Coastal Embankment Improvement Project-Phase I (CEIP-I): P128276-Implementation Status Results Report: Sequence 05. Washington, D.C.: World Bank Group. https://documents.worldbank.org/en/publication/documents-reports/documentdetail/733161468002358942.
- Gabriel AK, Goldstein RM, Zebker HA. 1989. Mapping small elevation changes over large areas: differential radar interferometry. J Geophys Res. 94(B7):9183–9191. doi: 10.1029/JB094iB07p09183.
- Galloway DL, Burbey TJ. 2011. Regional land subsidence accompanying groundwater extraction. Hydrogeol J. 19(8):1459–1486. doi: 10.1007/s10040-011-0775-5.
- Geudtner D, Torres R, Snoeij P, Davidson M, Rommen B. 2014. Sentinel-1 system capabilities and applications. In: 2014 IEEE Geosci Remote Sens Symp. IEEE; p. 1457–1460.
- Goodbred Jr SL, Kuehl SA. 2000. The significance of large sediment supply, active tectonism, and eustasy on margin sequence development: late Quaternary stratigraphy and evolution of the Ganges–Brahmaputra delta. Sediment Geol. 133(3–4):227–248. doi: 10.1016/S0037-0738(00)00041-5.
- Hanebuth TJJ, Kudrass HR, Linstadter J, Islam B, Zander AM. 2013. Rapid coastal subsidence in the central Ganges-Brahmaputra Delta (Bangladesh) since the 17th century deduced from submerged salt-producing kilns. Geology. 41(9):987–990. doi: 10.1130/G34646.1.
- Higgins SA, Overeem I, Steckler MS, Syvitski JPM, Seeber L, Akhter SH. 2014. InSAR measurements of compaction and subsidence in the Ganges‐Brahmaputra Delta, Bangladesh. JGR Earth Surface. 119(8):1768–1781. doi: 10.1002/2014JF003117.
- Hooper A, Bekaert D, Spaans K, Arıkan M. 2012. Recent advances in SAR interferometry time series analysis for measuring crustal deformation. Tectonophysics. 514-517:1–13. doi: 10.1016/j.tecto.2011.10.013.
- Hooper A, Zebker HA. 2007. Phase unwrapping in three dimensions with application to InSAR time series. J Opt Soc Am A Opt Image Sci Vis. 24(9):2737–2747. doi: 10.1364/josaa.24.002737.
- Hoque M, Alam M. 1997. Subsidence in the lower deltaic areas of Bangladesh. Mar Geod. 20(1):105–120. doi: 10.1080/01490419709388098.
- Hu B, Chen J, Zhang X. 2019. Monitoring the land subsidence area in a coastal urban area with InSAR and GNSS. Sensors. 19(14):3181. doi: 10.3390/s19143181.
- Islam AS, Haque A, Bala SK. 2010. Hydrologic characteristics of floods in Ganges–Brahmaputra–Meghna (GBM) delta. Nat Hazards. 54(3):797–811. doi: 10.1007/s11069-010-9504-y.
- Johnson SY, Nur Alam AM. 1991. Sedimentation and tectonics of the Sylhet trough, Bangladesh. Geol Soc America Bull. 103(11):1513–1527. doi: 10.1130/0016-7606(1991)103<1513:SATOTS>2.3.CO;2.
- Kim J, Lin S-Y, Singh T, Singh RP. 2023. InSAR time series analysis to evaluate subsidence risk of monumental Chandigarh City (India) and surroundings. IEEE Trans Geosci Remote Sens. 61:1–15.
- Kuehl SA, Allison MA, Goodbred SL, Kudrass H. 2005. The Ganges-Brahmaputra Delta. Spec Publ. 83:413.
- Kuehl SA, Levy BM, Moore WS, Allison MA. 1997. Subaqueous delta of the Ganges-Brahmaputra river system. Mar Geol. 144(1-3):81–96. doi: 10.1016/S0025-3227(97)00075-3.
- Lanari R, Casu F, Manzo M, Zeni G, Berardino P, Manunta M, Pepe A. 2007. An overview of the small baseline subset algorithm: a DInSAR technique for surface deformation analysis. Deform Gravity Chang Indic Isostasy, Tectonics, Volcanism. Clim Chang.164(4):637–661.
- Li Z, Bethel J. 2008. Image coregistration in SAR interferometry. Int Arch Photogramm Remote Sens Spat Inf Sci. 37:433–438.
- Lindsay JF, Holliday DW, Hulbert AG. 1991. Sequence stratigraphy and the evolution of the Ganges-Brahmaputra delta complex (1). Am Assoc Pet Geol Bull. 75(7):1233–1254.
- Milliman JD, Broadus JM, Gable F. 1989. Environmental and economic implications of rising sea level and subsiding deltas: the Nile and Bengal examples. Ambio.18(6):340–345.
- Milliman JD, Syvitski JPM. 1992. Geomorphic/tectonic control of sediment discharge to the ocean: the importance of small mountainous rivers. J Geol. 100(5):525–544. doi: 10.1086/629606.
- Mondal MS, Jalal MR, Khan M, Kumar U, Rahman R, Huq H. 2013. Hydro-meteorological trends in southwest coastal Bangladesh: perspectives of climate change and human interventions. Am J Clim Chang. 2(1):62–70.
- Osmanoğlu B, Dixon TH, Wdowinski S, Cabral-Cano E, Jiang Y. 2011. Mexico City subsidence observed with persistent scatterer InSAR. Int J Appl Earth Obs Geoinf. 13(1):1–12. doi: 10.1016/j.jag.2010.05.009.
- Persits FM, Wandrey CJ, Milici RC, Manwar A. 2001. Digital geologic and geophysical data of Bangladesh. U.S. Geological Survey Open-File Report 97-470-H. Reston, VA: U.S. Geological Survey.
- Pethick J, Orford JD. 2013. Rapid rise in effective sea-level in southwest Bangladesh: its causes and contemporary rates. Glob Planet Change. 111:237–245. doi: 10.1016/j.gloplacha.2013.09.019.
- Pratesi F, Nolesini T, Bianchini S, Leva D, Lombardi L, Fanti R, Casagli N. 2015. Early warning GBInSAR-based method for monitoring Volterra (Tuscany, Italy) city walls. IEEE J Sel Top Appl Earth Observ Remote Sens. 8(4):1753–1762. doi: 10.1109/JSTARS.2015.2402290.
- Qing X, Guowang J, Caiying Z, Zhengde W, Yu H, Peizhang Y. 2004. The filtering and phase unwrapping of interferogram. Proc ISPRS XXXV Comm V1/WG4.
- Qu F, Lu Z, Zhang Q, Bawden GW, Kim J-W, Zhao C, Qu W. 2015. Mapping ground deformation over Houston–Galveston, Texas using multi-temporal InSAR. Remote Sens Environ. 169:290–306. doi: 10.1016/j.rse.2015.08.027.
- Raff JL, Goodbred SL, Pickering JL, Sincavage RS, Ayers JC, Hossain MS, Wilson CA, Paola C, Steckler MS, Mondal DR, et al. 2023. Sediment delivery to sustain the Ganges-Brahmaputra delta under climate change and anthropogenic impacts. Nat Commun. 14(1):2429. doi: 10.1038/s41467-023-38057-9.
- Raju A, Nanda R, Singh A, Malik K. 2022. Multi-temporal analysis of groundwater depletion-induced land subsidence in Central Ganga Alluvial plain, Northern India. Geocarto Int. 37(26):11732–11755. doi: 10.1080/10106049.2022.2060322.
- Raju A, Singh RP, Kannojiya PK, Patel A, Singh S, Sinha M. 2024. Declining groundwater and its impacts along Ganga riverfronts using combined Sentinel-1, GRACE, water levels, and rainfall data. Sci Total Environ. 920:170932. doi: 10.1016/j.scitotenv.2024.170932.
- Scheiber R, Moreira A. 2000. Coregistration of interferometric SAR images using spectral diversity. IEEE Trans Geosci Remote Sensing. 38(5):2179–2191. doi: 10.1109/36.868876.
- Schepanski K, Wright TJ, Knippertz P. 2012. Evidence for flash floods over deserts from loss of coherence in InSAR imagery. J Geophys Res. 117(D20). doi: 10.1029/2012JD017580.
- Singh A, Bhushan K, Singh C, Steckler MS, Akhter SH, Seeber L, Kim W-Y, Tiwari AK, Biswas R. 2016. Crustal structure and tectonics of Bangladesh: new constraints from inversion of receiver functions. Tectonophysics. 680:99–112. doi: 10.1016/j.tecto.2016.04.046.
- Steckler MS, Mondal DR, Akhter SH, Seeber L, Feng L, Gale J, Hill EM, Howe M. 2016. Locked and loading megathrust linked to active subduction beneath the Indo-Burman Ranges. Nature Geosci. 9(8):615–618. doi: 10.1038/ngeo2760.
- Steckler MS, Oryan B, Wilson CA, Grall C, Nooner SL, Mondal DR, Akhter SH, DeWolf S, Goodbred SL. 2022. Synthesis of the distribution of subsidence of the lower Ganges-Brahmaputra Delta, Bangladesh. Earth-Science Rev. 224:103887. doi: 10.1016/j.earscirev.2021.103887.
- Syvitski JPM, Kettner AJ, Overeem I, Hutton EWH, Hannon MT, Brakenridge GR, Day J, Vörösmarty C, Saito Y, Giosan L, et al. 2009. Sinking deltas due to human activities. Nature Geosci. 2(10):681–686. doi: 10.1038/ngeo629.
- Tarchi D, Rudolf H, Luzi G, Chiarantini L, Coppo P, Sieber AJ. 1999. SAR interferometry for structural changes detection: a demonstration test on a dam. In: IEEE 1999 Int Geosci Remote Sens Symp IGARSS’99 (Cat No 99CH36293). Vol. 3. IEEE; p. 1522–1524.
- Tomás R, Romero R, Mulas J, Marturià JJ, Mallorquí JJ, Lopez-Sanchez JM, Herrera G, Gutiérrez F, González PJ, Fernández J, et al. 2014. Radar interferometry techniques for the study of ground subsidence phenomena: a review of practical issues through cases in Spain. Environ Earth Sci. 71(1):163–181. doi: 10.1007/s12665-013-2422-z.
- Torres R, Snoeij P, Geudtner D, Bibby D, Davidson M, Attema E, Potin P, Rommen B, Floury N, Brown M, et al. 2012. GMES Sentinel-1 mission. Remote Sens Environ. 120:9–24. doi: 10.1016/j.rse.2011.05.028.
- Wang Y-L, Peng Y-N, Bao Z. 1997. Space–time adaptive processing for airborne radar with various array orientations. IEE Proc, Radar Sonar Navig. 144(6):330–340. doi: 10.1049/ip-rsn:19971606.
- Wang Z, Wang B, Xiang M, Hu X, Song C, Wang S, Wang Y. 2021. A coherence improvement method based on sub-aperture InSAR for human activity detection. Sensors. 21(4):1424. doi: 10.3390/s21041424.
- Wilson CA, Goodbred SL. 2015. Construction and maintenance of the Ganges-Brahmaputra-Meghna delta: linking process, morphology, and stratigraphy. Ann Rev Mar Sci. 7(1):67–88. doi: 10.1146/annurev-marine-010213-135032.
- Yan Y, Doin M-P, Lopez-Quiroz P, Tupin F, Fruneau B, Pinel V, Trouve E. 2012. Mexico City subsidence measured by InSAR time series: joint analysis using PS and SBAS approaches. IEEE J Sel Top Appl Earth Observations Remote Sensing. 5(4):1312–1326. doi: 10.1109/JSTARS.2012.2191146.
- Yunjun Z, Fattahi H, Amelung F. 2019. Small baseline InSAR time series analysis: unwrapping error correction and noise reduction. Comput Geosci. 133:104331. doi: 10.1016/j.cageo.2019.104331.
- Zhao J, Yang X, Zhang Z, Niu Y, Zhao Z. 2023. Mine subsidence monitoring integrating DS-InSAR with UAV photogrammetry products: case Studies on Hebei and Inner Mongolia. Remote Sens. 15(20):4998. doi: 10.3390/rs15204998.