
 ?Mathematical formulae have been encoded as MathML and are displayed in this HTML version using MathJax in order to improve their display. Uncheck the box to turn MathJax off. This feature requires Javascript. Click on a formula to zoom.
Abstract
The Fushun West Open-pit Mine, recognized as Asia’s largest open-pit coal mine, transitioned to a closure management phase following the cessation of operations in 2019. This study presents a quantitative analysis of the water inflow sources by meticulously reviewing historical data on the mine’s drainage system and the hydrogeological conditions of the mining area. A numerical model representing the unsaturated-saturated groundwater dynamics was constructed to illustrate the spatial distribution of the groundwater flow. Employing the water storage analysis module within the WebGIS system, projections were made regarding the natural water accumulation process at varying water levels. The results indicate that, under natural conditions, an estimated 48 years would be required to reach a water level elevation of 50 m. However, this timeframe could be drastically reduced to approximately 3.3 years by implementing an accelerated filling strategy that channels water from the Hun River. Numerical simulations elucidate the failure mechanism of the water-sensitive slope on the northern bank during the water storage process, as well as the potential impact on the slopes above the water level. This comprehensive approach provides critical insights for managing decommissioned open-pit mines and optimizing water storage schemes.
1. Introduction
China has 262 resource-based cities (State Council of the PRC Citation2013), which have made historic contributions to China’s economic development. However, after long-term and large-scale resource exploitation, many of these cities have entered a period of resource exhaustion. This has led to economic stagnation, severe ecological damage, and the emergence of new geological disaster risks, severely affecting the safety of residents’ lives and exacerbating the pressure for transformation in declining cities (Yu et al. Citation2019). Meanwhile, in China, the reduction and substitution of coal consumption is a pivotal strategy for achieving the goal of peaking carbon emissions by 2030 and attaining carbon neutrality by 2060 (Elzen et al. Citation2016; Liu Z et al. Citation2021). In this context, numerous open-pit coal mines, including the Fushun West Open-pit Mine, have been designated by the State Council as key projects for large-scale open pit remediation. The ecological restoration and disaster management of open-pit mines have become critical issues that urgently need to be addressed (Lu et al. Citation2020; Zhou A et al. Citation2020; Jia and Lin Citation2021).
Throughout the open-pit mining cycle, the surrounding groundwater converged into the mine pit, naturally overflowing and discharging along the steep edges of the pits. After long-term drainage, the groundwater level significantly drops, and a groundwater funnel forms with the mine pit at its center (Li H et al. Citation2021). Following the cessation of mining operations and production, the drainage facilities became ineffective, and the groundwater level will recover (Bozan et al. Citation2022), which is a feasible and low-cost closure plan that balances ecology and aesthetics (Soni et al. Citation2014; Blanchette and Lund Citation2016; McCullough and Vandenberg Citation2020). However, the formation of pit lake can lead to the collapse or landslide of the pit wall (Al Heib et al. Citation2023; He et al. Citation2024). During the process of pit closure and water storage, alterations in boundary conditions exert a direct influence on the stability of the slope: the restoration of the groundwater level increases the pore water pressure in the slope rock mass, rock joint surfaces may be submerged, thereby reducing their shear strength (Read and Beale Citation2013; Liu F et al. Citation2022; Li J et al. Citation2023a). The safety of slope is a time-sensitive dynamic process, and the deterioration of the slope rock mass is a significant factor in slope instability (Xu et al. Citation2012; Citation2014; Cui et al. Citation2022). The unloading effect of open-pit mining leads to the redistribution of internal stress in the upper slope rock mass, resulting in the loosening and expansion of rock joint (cracks) (Ma et al. Citation2023; Li J et al. Citation2023b). During the process of pit closure and water storage, the effects of the stress and seepage, coupled together, will further deteriorate the slope rock mass, directly affecting the stability of slope (Renaud et al. Citation2022). The overall effect is that the pit walls may ravel or fail over time, which are prone to occur under the driving forces of glacial melt, rainfall, water level changes, surface runoff, and groundwater activities, pose risks to infrastructure or natural landscapes located above the pit (Huang Citation2012; Nian et al. Citation2022). Slope instability can lead to additional mineral acidity and other oxidation products entering the pit lake, causing water pollution (Zhang et al. Citation2019). In extreme cases, significant damage to the slope can generate surges waves in the pit lake (Zhou J-w et al. Citation2016; Peng et al. Citation2021), which may even overflow from the mining area and move downstream. Some mines have built permeable retaining walls at the outlet to drain the overflowing lake water, controlling the massive surge waves produced after the closure of the mine pit (Read and Stacey Citation2009).
Investigating the process of pit lake formation subsequent to the closure of an open-pit mine is paramount for conducting a comprehensive stability analysis of the pit wall (Bruyn et al. Citation2019; East and Fernandez Citation2021), as well as for planning the post-use of the mine (Delgado-Martin et al. Citation2013; Xia et al. Citation2021). Outflowing groundwater, together with precipitation and surface runoff, contributes to the formation of a pit lake, the interaction between pit lake water and groundwater subsequently determines the groundwater downgradient, which in turn dictates whether the pit lake water infiltrates or recharges from the groundwater (Unsal and Yazicigil Citation2016). Both analytical models and numerical approaches are available to study the groundwater flow of pit lake formation processes. Analytical models can be categorized into two types: the Equivalent Well Approach and the Two-Dimensional Groundwater Inflows, both are simple and easy to use, but it requires model simplification and is usually used for preliminary estimates (Marinelli and Niccoli Citation2000). Numerical methods, due to their convenience and feasibility, are widely used in groundwater assessment, however, the accuracy of their calculations relies on precise parameter acquisition through detailed hydrogeological surveys, and the coupling effect between groundwater and surface flow presents a significant challenge that needs to be overcome (Zhao et al. Citation2017).
This research focuses on the Fushun West Open-pit Coal Mine, examining the balance and dynamic interplay between surface water and groundwater in terms of recharge, runoff, and discharge within the mining area. The objective is to predict the natural water accumulation process following the cessation of mining operations and to compare this with a rapid filling approach. Additionally, an evaluation of slope stability was performed to elucidate the failure mechanisms and their impact on the slope sections above the water level. Based on these findings, targeted remediation strategies were proposed to mitigate potential problems.
2. Hydrogeological settings of the study area
2.1. Study area
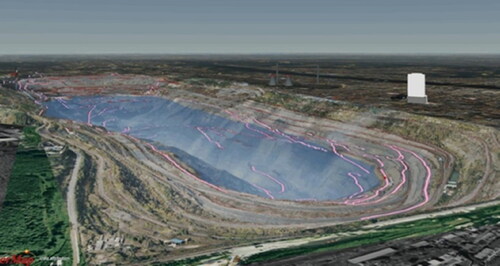
The Fushun West Open-pit Mine (as shown in ) is located at the foot of Qiantai Mountain in the southern part of Fushun City. The mine spans across the Xinfu and Wanghua districts of Fushun City, with a length of 6.6 km from east to west and a width of 2.2 km from north to south. It covers an area about 11 km2 and has a final mining depth of −368 m. The overall slope angle of the south slope ranges from 19° to 27°, while the north slope maintains an angle of approximately 30°. The open pit is situated in a narrow and elongated plain between the North Hun River and the southern hilly terrain. The northern wing of the Qiantai Mountain exhibits a ground elevation ranging from 102.9 to 204.9 m, with a relative height difference of 102 m and a natural slope angle of 20°-30°. The topography on the north side of the open pit is relatively gentler and lower, with a ground elevation ranging from +70 to +80 m, with a terrain slope of about 2°, slightly higher in the northeast direction.
Figure 1. The location and the over view of the study area.
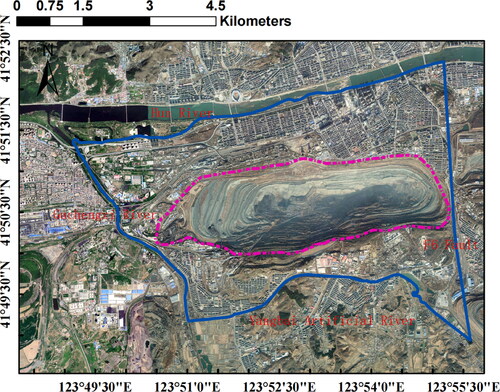
The Hun River is the main river in the Fushun area, flowing from east to west through Fushun city. The hydraulic gradient is approximately 1.2‰. The water level elevation in the north side of the mining area is usually between +68 and +69 m. During flood season, the water level can reach up to +75 m. The maximum flow rate is 2700 m3/s, while the minimum flow rate is 350 m3/s. The Guchengzi River is one of the main tributaries of the Hun River, located in the southwest part of the Xilutian mining area. It flows from south to north, with the closest distance between the riverbed and the mining area being 150 meters. The riverbed has a width of 50 m, with a maximum flow rate of 6.6 m3/s and a minimum flow rate of 0.8 m3/s. The Yangbai artificial canal is located on the south side of Qianshantai. In 1936, during the excavation of the open pit, the original Yangbai and Liushan rivers were diverted and connected to the Guchengzi River.
The climate in the Fushun region is influenced by wind direction, with a continental climate prevailing during northwest winds and a maritime climate during southeast winds. The mining area is located in the northern temperate zone, with an annual average temperature of 8.3 °C. The lowest temperature in winter can reach −35.2 °C, while the highest temperature in summer can reach +40.3 °C. The annual rainfall ranges from a minimum of 460 mm to a maximum of 1135 mm, with an average of 773.6 mm. Rainfall is concentrated in the months of July and August, with the maximum daily rainfall recorded at 185.9 mm and the maximum continuous rainfall reaching 263.5 mm. The maximum snow depth can reach 305 mm, and the average annual evaporation is 945.5 mm.
2.2. Hydrogeology of the Fushun West Open-pit Mine
The alluvial layer of Quaternary in the northern and western slopes of the mining area has a bottom elevation ranging from +58 to +66 m, while the top of the bedrock decreases gradually from northeast to southwest. The thickness of the alluvial layer ranges from 11 to 35 m, with an average of 17.5 m. The permeability coefficient K of the alluvial layer in the northern slope is 3 × 10⁻³ m/s, the unit water inflow Q is 17.67 to 24.77 L/(s·m), and the influence radius R is 51.7 to 254 m. The nearest point between the ancient Chengzi River bed and the western slope of the mining area is 150 m. The groundwater in the river bed can infiltrate the mining a rea through the alluvial layer or the old channel of the Chengzi River. In the southern and eastern parts of the mining area, the old channels of the Yangbai River and the Liushan River have a water-bearing layer thickness of 5 to 6 m, with a permeability coefficient of 31.04 to 112.14 m/d and a unit water inflow of 0.403 to 2.85 L/(s·m). The recharge sources mainly include the South Garden Lake and precipitation, which replenish the mining area through these old river channels. The overall groundwater flow direction in the alluvial layer of the north slope is consistent with the gentle slope of the bedrock, pointing from northeast to southwest. The discharges include natural overflow along the pit slope, leaking recharge to the underlying bedrock, and natural evaporation on the surface.
The hydraulic connection between the alluvial layer and the bedrock aquifer, as well as the overland recharge to the bedrock aquifer, are influenced by factors such as the thickness of the bedrock weathering zone, the development degree of structural fractures, and the elevation of the bedrock roof. The bedrock units, from old to new, mainly consists of: Archean Anshan Group gneiss, Mesozoic Lower Cretaceous Longfengkan Formation’s sandstone, conglomerate, tuffaceous sandstone, as well as Lower Tertiary basalt, tuff, coal, oil shale, and interbedded green mudstone and brown shale. There is no complete and stable aquiclude between each bedrock aquifer, and the hydraulic connection between the pore groundwater and the bedrock fracture water, as well as among each bedrock aquifer, is very close. The basaltic aquifer is with an average thickness of 90 m, this fractured aquifer is primarily located in the southern part of the mine. Its influence radius R is 34 m, and its permeability coefficient K is 4 × 10⁻⁸ m/s. The tuffaceous aquifer has an average thickness ranging from 30 to 120 m and is mainly distributed in the southern and western boundaries of the mining field. Its influence radius R is 28 m, and its permeability coefficient K is 1 × 10⁻⁷ m/s. The coal seam is the main mining layer, with well-developed fractures. Its permeability coefficient K is 10−6 m/s in the direction parallel to the bedding, and 10−7 m/s in the direction perpendicular to the bedding. Its influence radius R is 27 m. The oil shale layer’s permeability coefficient K is 10−7 m/s in the direction parallel to the bedding, and 10−9 m/s in the direction perpendicular to the bedding. The interbedded green mudstone and brown shale’s permeability coefficient K ranges from 2 × 10⁻⁷ to 2 × 10⁻⁶ m/s.
3. Methodology
3.1. Water inflow statistics
To effectively intercept and divert surface water and groundwater, seven ground pump stations and one well drainage pump station have been installed at different elevations. These stations have a total drainage capacity of 31,923 m3/h, with an average annual drainage cost estimated to be 50 million CNY. Statistical analysis of the water inflow data from various pump stations from 2016 to 2019 () shows that the annual average drainage volume of the open pit is 24.48 million m3. Among them, the +9 pump station located at the western end has an annual average drainage volume of 5.8 million m3, accounting for approximately 24% of the total drainage volume, the highest proportion, which is followed by the + 67 pump station on the southern side, two pit bottom pump stations, and the Majiazi pump station in the southwest, with an annual average drainage volume of 3.5 to 4 million m3, accounting for about 15%. The proportion of the rest pump stations is less than 10%, among which the smallest drainage volume is the 15th pump station located at the eastern end, with an annual average drainage volume of about 300,000 m3, accounting for only 1%.
Figure 2. Zoning map of the drainage system.
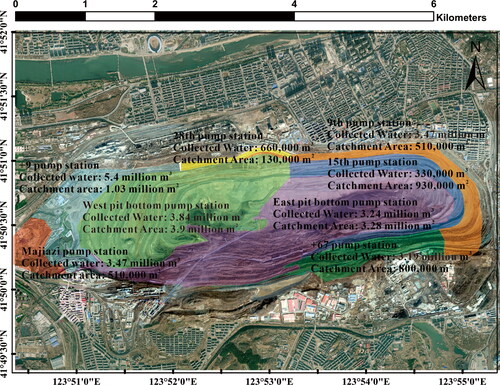
The drainage volume of the eight pump stations represents the groundwater recharge volume from different sources to a certain extent. According to the design scheme of the mine pit drainage system, the annual water inflow volume of the open pit is divided by the recharge source: northwest side (+9 pump station) with 5.81 million m3, north side (+28 pump station, 9th pump station, 15th pump station) with 3.27 million m3, south side (+67 pump station) 3.28 million m3, southwest (Majiazi pump station, Nanchang pump station) with 4.72 million m3, bedrock groundwater seepage (two pit bottom pump stations) with 7.4 million m3. The groundwater, replenished by the Hun River, flows in a north-to-south direction, permeating through the sand and gravel stratum, and eventually seeping out on the northern slope. The Yangbai artificial river, hindered by the low permeability bedrock along its southern bank, contributes minimally to the inflow of the open pit. However, as the artificial river reaches the western end of the open pit and enters the plain area, the permeability of the Quaternary strata improves, leading to an increase in the pit’s inflow from the western side. The location of the former river channel is rich in sand and gravel, despite the river’s course alteration, the direction of the groundwater flow remains unchanged.
The rainfall infiltration recharge rate was calculated using the following formula which can be expressed as:
(1)
(1)
where
is the infiltration coefficient, and
is the annual precipitation.
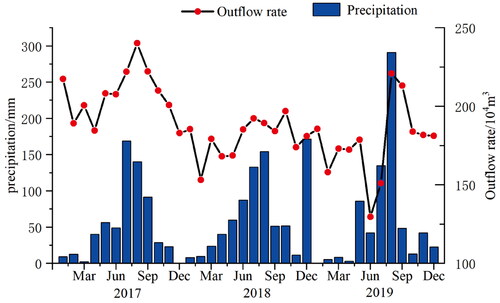
The annual precipitation in the study area varies significantly, and by comparing the rainfall data with the water inflow data from 2017 to 2019 (), it was revealed that there is not a strictly positive correlation between the water inflow and the regional rainfall. The discrepancy in trends is attributed to factors such as the lag effect of infiltration from the alluvial layer of Quaternary to the bedrock fractures and the disturbance of groundwater caused by open-pit mining activities. Therefore, the rainfall recharge was taken as the regional average annual precipitation of 773.6 mm, and the infiltration coefficient was set at 0.15. The calculated rainfall infiltration recharge rate was 3.2 × 10⁻⁴ m/d.
Figure 3. Comparison between outflow rate and precipitation.
3.2. Groundwater flow model
3.2.1. Conceptual model of the study area
A conceptual model acts as a descriptive representation of a groundwater system, which encapsulates the hydrogeological characterization of the site and forms the foundation for the numerical groundwater flow model (Maliva Citation2016). In the mining region, the alluvial layer of Quaternary directly overlies the bedrock, with no complete, stable aquiclude present between the bedrock’s aquifers. The hydraulic connectivity between the pore water and the bedrock fracture water, as well as among the bedrock’s aquifers, is notably strong. Open-pit mining operations have led to the convergence of surrounding groundwater into the pit, which naturally overflows and discharges along the pit’s steep edges. Prolonged pumping has significantly reduced the groundwater level and increased the thickness of the gas-bearing zone. Consequently, the groundwater in the study area can be characterized as a saturated-unsaturated system with a unified water table.
Aquifers were delineated based on the geometric characteristics of the faults and rock strata. Models were developed for primary aquifers with substantial thickness, including granite gneiss, green mudstone, oil shale, coal seam and basalt. Thinner strata, such as tuff, were generalized and amalgamated into adjacent rock layers, with the corresponding hydrogeological parameters represented by composite values.
The model’s upper surface was replenished vertically by precipitation. The bottom constituted an aquiclude boundary. The north, west, and south boundaries, defined by the Hun River, Guchengzi River, and Yangbai Artificial River respectively, contributed to the open-pit mine’s inflow through lateral runoff. The eastern boundary was defined by the aquiclude F5 fault, serving as a hydrological barrier.
3.2.2. Numerical model approach
The model was implemented numerically using the DHI-WASY code FEFLOW (Finite Element subsurface FLOW system) applying the Richards formulation Van Genuchten-Mualem model (Diersch Citation2014). Through water budget analysis and fitting the actual groundwater flow, hydrogeological parameters, boundary values, and other equilibrium items were identified, thus the spatial distribution of the groundwater flow in the mining area was simulated.
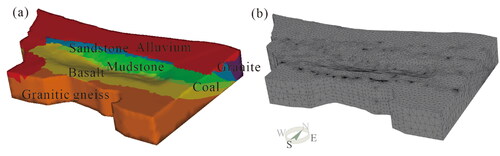
The model domain covers an area of 31.63 km2. The construction process is as follows: Firstly, the model boundaries mentioned in the previous section were extracted to generate the extent of the two-dimensional model plane. From the detailed three-dimensional geological model established in the early stages of the project (Gao et al. Citation2023), the Digital Terrain Model (DTM), faults, and strata interfaces were extracted and converted into a three-dimensional point cloud. Based on the stratigraphic superposition sequence, and using the Kriging interpolation method, these are sequentially imported into FEFLOW for fully unstructured meshing to create a three-dimensional numerical model, comprising 238,562 elements and 45934 nodes. The maximum length, width, and height of the model are respectively 9973, 5558, and 1131 m. The model setup and the mesh are depicted in .
Figure 4. Model setup for the groundwater flow model. (a) hydrogeological units. (b) Overview of the mesh model.
In open-pit mining under drainage conditions, there was little water accumulation at the bottom of the pit. It was assumed that the groundwater around the mine flowed out through the slope and was entirely drained by the pump station. Therefore, a free seepage boundary condition was applied to the slope of the pit through hydraulic head boundary with constraints (Diersch Citation2014): a fixed head boundary condition was set, with the head value equal to the elevation of each node. The boundary conditions were constrained by a maximum flux = 0 m3/d, which means that the head boundary condition was only active in case of water flowing out.
The Hun River to the north and the Guchengzi River to the west were modeled with a general head boundary condition. The head at each node was determined through linear interpolation based on the river water levels and the hydraulic gradient. The Yangbai artificial river, situated on the southern flank of Qiantai mountain, has a relatively small flow and its riverbed exhibits certain impermeable characteristics, providing limited recharge to the groundwater, hence it was treated as third-type boundary conditions. The eastern part is a watertight fault F6, considered as no-flow boundary.
3.3. Water storage analysis
The B/S frameworks based WebGIS system of Fushun West Open-pit Mine has been developed on the cloud GIS network client development platform, SuperMap iClient. The SuperMap iServer was used as the 3D GIS map server, with a combination of MySQL database and Apache Web server WAMP for website development.
The platform is capable of displaying and managing a wide variety of heterogeneous data from the open-pit mine, achieved through format conversion and integration. This significantly enhances the efficiency of mine management and engineering analysis. A high-precision topographic model was obtained by utilizing unmanned aerial vehicle (UAV) tilt photography for the entire open pit, and the digital terrain model (DTM) was generated through surface fitting of point cloud data, thereby enabling the precise prediction of the volume and pit lake area under different water storage levels. Thus, a water storage analysis module was developed, as shown in , which can compute the time required to attain a specified water level, and produce a curve representing the time-water level and volume, thereby illustrating the water storage process.
Figure 5. Water storage analysis module of the Fushun West Open-pit Mine WebGIS system.
For different water levels (from 50 m at the pit top to −300 m at the pit bottom), the inflow of groundwater into the mine pit was calculated every 20 m. The boundary conditions of the pit surface below the water level were set as fixed hydraulic head boundaries corresponding to different water levels. The remaining part of the pit surface was still set as seepage surface.
The water storage process leads to water accumulation in the pit. Due to the geometric shape of the mine pit, which is narrow at the bottom and wide at the top, the lake surface area increases as the water level rises, leading to an increase in evaporation. The estimated groundwater influx into the open pit, when aggregated with surface runoff and adjusted for evaporation losses at the corresponding water level, results in the revised water accumulation rate.
The hydrological observation station within the study area has recorded an average annual evaporation of 945.5 mm using a 20 cm diameter evaporation pan in recent years. To obtain a value that more accurately reflects the evaporation conditions of a natural water surface, this measurement should be adjusted using EquationEquation (2)(2)
(2) to correspond to the observations from an E601-type evaporator.
(2)
(2)
Where represents the observed value of the evaporator, while
stands for the observed value of the 20 cm diameter evaporation pan. The conversion factor for the local area, denoted by
is 0.57. The adjusted annual evaporation is 539 mm.
3.4. Analysis of slope stability after water storage
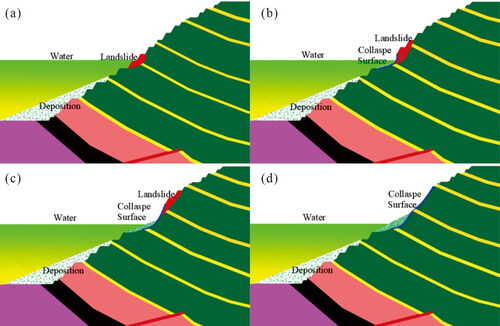
Mining activities have resulted in a 40 to 50-meter unloading zone in the north slope of the Fushun West Open-pit Mine. This has triggered the development of rock mass fractures, leading to a decrease in strength and redistribution of stress, thus reduction in confining pressure which means diminished constraints. These developed fractures have subsequently formed water-conducting channels. The north slope is predominantly composed of interbedded green mudstone and brown shale. Analysis of the mineral composition reveals that the green mudstone contains clay minerals such as montmorillonite. Upon hydration, these minerals expand and disintegrate, resulting in significant degrade of the mechanical property. The average UCS of saturated specimens were reduced by 86% after soaking for ten minutes (Li J et al. Citation2023a). Consequently, the slope becomes susceptible to failure during water saturation, the failure process of the slope is illustrated in . As the formation of the pit lake, the fragmented slope rock mass of interbedded green mudstone and brown shale slides to the pit bottom (), while the underlying oil shale layer generally can maintain stability, due to its higher strength and lower sensitivity to water. Water further erodes the slope’s interior, seeping inwards, continuously weakening the rock mass strength and leading to additional damage, resulting in the formation of a steep underwater scarp above the water level (). This process induces landslides above the water level, and the slide deposits fill the voids, ultimately leading to the stabilization of the slope ().
Figure 6. Schematic diagram of slope failure after water storage.
This paper aims to reveal the failure mechanism of water-sensitive slope on the north bank during the water storage process and the extent of impact on the slopes above the water level, thus we employed the Rocscience Phase2 finite element code, adopting the Mohr-Column constitutive model and strength reduction method, to conduct a landslide risk analysis in the representative profile E1000 of the north slope. Given that the slopes are gentle on top and steep at the bottom, there is a risk that damage may occur concurrently with water storage. Therefore, a water storage level of −100 meters was selected. Moreover, to investigate the landslide risk under the most unfavorable conditions, we considered that during numerical simulation, the rock mass within the slope’s unloading zone was totally weakened. The zero pressure isosurface from the previous groundwater flow simulation was extracted and then imported to the 2D model as the water level line. The bottom boundary was fixed and the lateral boundaries were fixed in the normal direction but the z-direction was free. The slope surface below water level was subjected to an equivalent hydrostatic pressure, while the other part was set as free boundary. The physical and mechanical parameters utilized in the numerical model (as listed in ) were determined through laboratory experiments and the back analysis approach of landslide events. Additionally, recommendations from other scholars’ articles were taken into consideration when selecting these parameters (Yang TH et al. Citation2014; Yuan et al. Citation2021; Sun et al. Citation2022). The slope model was subjected to gravity loading in order to determine the initial stress field.
Table 1. Physical and mechanical parameters used in this study.
Through the simulation, the unstable slope was identified and then excavated, and recalculations were performed and the excavations of the unstable rock mass were repeated until the stability of the slope was achieved, the angle of the stable slope was finally determined.
4. Results
4.1. Water balance analysis of the actual open pit
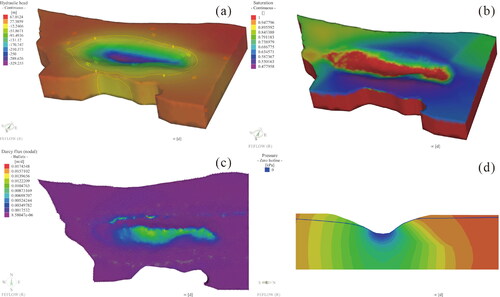
The distribution of hydraulic head is shown in . The hydraulic head gradually decreases from the end of the model towards the pit, forming a groundwater depression funnel centered around the pit due to pit drainage and slope seepage. The hydraulic head is higher on the northern and southwestern sides of the pit, and lower on the southern and eastern sides. The results align well with the actual distribution of the groundwater level. The Darcy velocity along streamline is shown in . It can be observed that groundwater flows towards the pit from the north, west, and south, with greater flow rates in the northwest direction, within the pit and at the northern bank, adjacent to the crest of the slope. illustrates the degree of saturation. As can be overserved, the terrain at the western end of the model is relatively low and its groundwater is recharged by the Guchengzi River, approaching fully saturated. The depth to the phreatic surface increases gradually from the northwest to the southeast. A representative E1000 profile was sliced through the pit in a north to south direction, demonstrating the water table and hydraulic head contour, as depicted in . The blue curve represents the zero hydraulic head pressure contour line, i.e. the phreatic surface, which is essentially consistent with the actual groundwater level revealed by borehole. The surrounding groundwater converges towards the pit and naturally overflows and drains along the steep edges of the pit. The phreatic surface in the south is lower than in the north due to less recharge in the south. Moreover, as the depth of the pit increases, the effect of the groundwater depression funnel becomes more pronounced.
Figure 7. Simulation results. (a) Distribution of hydraulic head. (b) Degree of saturation. (c) Darcy flux. (d) Water table and hydraulic head of the E1000 profile.
The actual drainage rate of a mine pit includes not only the discharge from various aquifers into the mine pit but also surface runoff of precipitation. The formula for calculating the surface runoff volume is as follows:
(3)
(3)
where
represents the surface runoff volume,
is the runoff coefficient, which is taken as 0.35, and
stands for the precipitation. The calculated average annual runoff volume is 270 mm. The catchment area of the mine pit is 11.41 million m2, hence the average annual surface runoff volume within the mine pit area is 3.08 million m³. The annual average inflow volume to the mine pit is 24.48 million m³. After separating the surface runoff volume, the annual average outflow volume of groundwater into the mine pit is determined to be 21.40 million m³.
The results of the water balance calculations obtained from the numerical simulation are shown in . According to the table, the model calculates the outflow rate (inflow rate to the open pit) to be 6.1315 × 10⁴ m3/d, which is equivalent to 22.37 million m3. This value differs by only 4.5% from the actual the annual average inflow volume of groundwater into the mine pit. Furthermore, it can be observed that the main source of groundwater recharge to the mine pit comes from the north, accounting for 46% of the total recharge. The western boundary contributes the second largest portion, accounting for 20% of the total recharge. The southern boundary provides 25.6% of the recharge, while precipitation recharge accounts for a mere 5.4%.
Table 2. Simulated rate budget of the actual open pit.
4.2. Prediction of pit lake formation process
shows trends of inflow rate and cumulative volume with changes in pit water level. The red curve represents the volume of the mine pit at different elevations, corresponding to the red vertical axis; the blue curve represents the natural inflow rate at different water levels, corresponding to the blue vertical axis. At an elevation of −300 m, the mine pit volume is 1 million m³; at −200 m, the volume is 31.31 million m³; at −100 m, the volume is 18.6 million m³; at 0 m, the volume is 10.01 million m³; and at 50 m, the volume is 867.27 million m³. Due to the geometric shape of the mine pit being narrower at the bottom and wider at the top, the volume increment with elevation increases as the water level rises.
Figure 8. Pit Lake formation. (a) Inflow rate and cumulative volume with elevation. (b) Comparison of constant recharge rate and simulated water storage process.
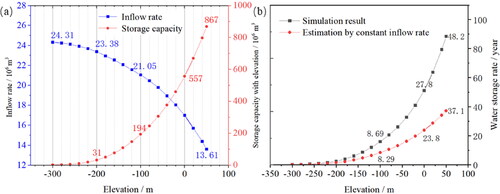
As the water level rises, the inflow rate of the mine pit shows an accelerating downward trend. This phenomenon is partly attributed to the accumulation of water in the pit leading to an increase in the hydraulic head on the slope surface, thereby reducing the hydraulic gradient from outside to inside the pit. On the other hand, due to the geometric shape of the mine pit being narrower at the bottom and wider at the top, as the water level rises, the surface area of the water also increases, leading to an increase in evaporation. In summary, the inflow volume inside the pit will gradually decrease as the water level rises.
The comparison of the inundation time between the simulation (red curve) and the constant inflow rate (blue curve) is shown in . The results indicate that from the pit bottom elevation of −300 m, to the elevation of −100 m, the time required is essentially consistent; inundation to an elevation of 50 m takes about 48.2 years, which is nearly 1.3 times the time required by the constant inflow rate (35 years). When the water level is low, since the submerged volume is small and the attenuation effect of the inflow volume is not significant, the simulated results and the uniform rate estimated submersion time do not differ much. However, as the water surface rises, the simulated inundation time significantly increases. Compared to the results estimated by constant inflow rate, the simulation can more accurately reflect the dynamic submersion process of the mine pit.
4.3. Risk assessment of slope failure caused by water storage
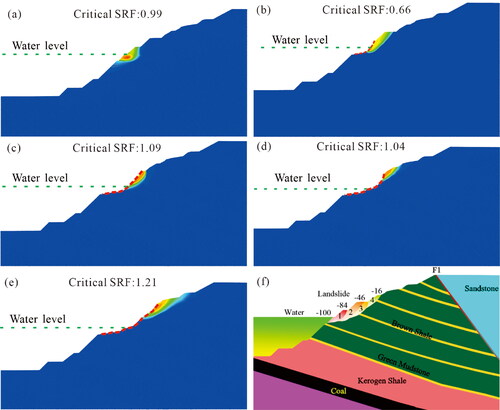
The numerical simulation results indicate that upon the water level attaining −100 m, there ensues a sequence of four cumulative failures initiating from the bottom and progressing upwards. Subsequent to the impoundment, the extant slope is rendered unstable, exhibiting a critical strength reduction factor (SRF) of 0.99, which precipitates the initial landslide, as depicted in . The landslide’s rear edge is situated at an elevation of −84 m, with the extent of slope failure, directly attributable to the basal weakening and disintegration, spanning 16 m. The subsidence occurring beneath the −84 m elevation alters the slope’s geometric contour, engendering a precipitous escarpment at the base with a diminished critical SRF of 0.66, and consequently, a second landslide eventuates. The rear edge of this subsequent landslide is located at an elevation of −46 m, as illustrated in . In the aftermath of the initial two collapses, the upper strata of the rock mass predominantly remain unsubmerged, leading to an increment in the slope’s critical SRF, albeit insufficient for assuring long-term stability. This deficiency necessitates a continual reduction in the slope angle until a state of equilibrium is approached. Post the second landslide, the slope’s critical SRF is recorded at 1.09. Ensuing landslides perpetuate the rear edge at the −46 m elevation, as evidenced in , with a critical SRF of 1.04 post-collapse. Further landslides transpire with the rear edge at an elevation of −16 m, as delineated in , culminating in the gradual stabilization of the slope and an ultimate safety critical SRF of 1.24. Consequently, the impoundment up to an elevation of −100 m induces a cumulative failure height of 84 m above the water level on the slope.
Figure 9. Evaluation of slope stability under water storage conditions. (a-d) Cumulative slope failures caused by water storage. (e) Stabilization of the slope with an critical SRF of 1.24. (f) Schematic diagram of the slope failure process and the affected area.
5. Discussion
This study conducted a detailed investigation into the water storage process after mine closure and the potential landslide risks at the Fushun West Open Pit Mine. The research presented here more closely aligns with the actual hydrogeological conditions, compared to the estimation methods employed in the conventional design of pit closure plans, the method proposed in this paper can assess the water storage process with enhanced accuracy and efficiency.
The evaluation of the slope failure mechanism herein presents insight in the risk of the water-sensitive slope on the north bank during the water storage process and the extent of impact on the slopes above the water level. In response to the destabilization risks of the slopes after water storage, we recommended a backfilling scheme before water storage (Gao et al. Citation2023). The overall scheme refers to: complete backfilling below the −148 m, followed by a stepped backfilling from −148 to −40 m towards the north slope to provide stabilization. In addition to this, we recommend regarding the upper slopes at an angle of 16 degrees and covering the slope surface with waterproof materials to ensure adequate anti-seepage measures are in place.
During mining activities at the Fushun West Open Pit Mine, internal dumping projects progressed from west to east. Although the slopes of the internal waste dumps are relatively gentle, they are composed of loosely deposited materials. These slopes are susceptible to debris flows due to the influence of unsteady seepage and surface runoff induced by rainfall. (Lv et al. Citation2014) investigated the coupling effects of seepage and damage on the stability of inner dump slopes. (Wang et al. Citation2020) employed FLAC3D and Slope/W to assess the impact of groundwater on the factor of safety of inner dump slopes. (Yang Z et al. Citation2003) examined the stability of the internal dumping site at the western end of the Fushun West Open-pit in relation to rainfall, concluding that the overall slope angle of the internal dumping site of less than 18°∼20° can ensure stability under a centennial rainfall event. Previous studies provide us with insights for the backfilling projects preceding water impoundment. Special attention should be given to the stability of the inner dump slopes and the anti-seepage measures for the backfill materials. Further research on these aspects is expected to be carried out in the next phase of our work.
Generally, a reservoir’s water storage level is regulated by the dams upstream and downstream, and the groundwater level within the slope rock mass is primarily affected by fluctuations in the storage water level. However, for pit lake, during the mining period, long-term dewatering activities create a groundwater depression funnel centered around the mine. When drainage system ceases after mine closure, the groundwater level within the slope will rebound prior to the water level in the pit, leading to an increase in pore water pressure within the slope rock mass, a decrease in effective stress, and a reduction in resistance to sliding, which can adversely affect slope stability. The natural accumulation of water in the pit is a slow process, so it is recommended to adopt a rapid water-filling scheme that channels water from the Hun River to the mine pit through a culvert. This approach utilizes culvert inflow combined with water pipe distribution, the latter of which can disrupt thermal stratification and promote uniform hydrodynamics in the pit lake.
The recharge capacity of different culvert sections is calculated based on the Manning formula:
(4)
(4)
where
represents the peak discharge, measured in m³/s;
denotes the channel roughness;
is the hydraulic gradient;
stands for the effective cross-sectional area of the flow, measured in m2;
is the hydraulic radius, measured in meters m.
Building upon the results of the previous natural water storage process analysis, taking into account the natural inflow of water into the mine pit, rainfall, and evaporation from the pit lake, to accumulate water up to 50 m, for a concrete circular pipe with a diameter of 1 m, it would take approximately 4 years at a hydraulic gradient of 2‰, and about 3.3 years at a hydraulic gradient of 3‰. In the case of a rectangular concrete section with a height of 1 m and a width of 1.5 m, the estimated time required would be approximately 8.3 years at a hydraulic gradient of 2‰, and around 7 years at a hydraulic gradient of 3‰.
After the formation of the pit lake, it can meet the needs for flood control and drought mitigation. Utilizing the reservoir capacity of over one hundred million m3, it can regulate floodwaters, enhance the flood and urban waterlogging resistance capacity. Through the implementation of environmental measures such as lakebed covering, constructing sedimentation basins, intercepting surrounding sewage, and fostering an ecosystem, the water quality of the pit lake can be maintained, making it a viable emergency water reserve for urban use. Simultaneously, the lake’s ecological and scenic value, including the expansion of man-made wetland areas, offers recreational and leisure opportunities for residents, enhancing the overall quality of the urban living environment. Nonetheless, the lake’s hydrodynamic circulation and the potential negative impacts stemming from the water storage, such as thermal stratification and prolonged water stagnation, warrant further investigation.
6. Conclusions
This paper integrated a numerical simulation of groundwater with a water storage analysis module within the WebGIS system to predict the water accumulation process in the Fushun West Open-Pit Mine after its closure. Additionally, the study employed the strength reduction method within the finite element framework to investigate the mechanism of landslides after water storage and their impact range, leading to the following conclusions:
Through a statistical analysis of the drainage volume of the Fushun West Open-pit Mine’s drainage system in recent years, it was determined that the groundwater recharge to the mine pit amounts to 21.40 million m³.
The inflow rate before water storage determined by numerical simulation was 6.1315 × 10⁴ m3/d, which was equivalent to 22.37 million m3, differed by only 4.5% from the actual the annual average inflow volume of groundwater into the mine pit.
Under natural conditions, an estimated 48 years would be required to reach a water level elevation of 50 m. However, this timeframe could be drastically reduced to approximately 3.3 years through the implementation of an accelerated filling strategy that channels water from the Hun River.
The storage of water can result in multiple progressive failures of the interbedded green mudstone and brown shale slopes on the northern bank, extending upward from the water surface. The impoundment reaching an elevation of -100 meters could induce a cumulative failure extending 84 m above the water level.
Acknowledgements
We would like to express our deepest gratitude to the editors and reviewers for their invaluable insights and suggestions, which have significantly enhanced the quality of our manuscript.
Disclosure statement
No potential conflict of interest was reported by the authors.
Data availability statement
The data that support the findings of this study are available from the corresponding authors, upon reasonable request.
Additional information
Funding
References
- Al Heib M, Varouchakis EA, Galetakis M, Renaud V, Burda J. 2023. A framework for assessing hazards related to pit lakes: application on European case studies. Environ Earth Sci. 82(14):365. doi:10.1007/s12665-023-11045-4.
- Blanchette ML, Lund MA. 2016. Pit lakes are a global legacy of mining: an integrated approach to achieving sustainable ecosystems and value for communities. Curr Opinion Environ Sustain. 23:28–34. doi:10.1016/j.cosust.2016.11.012.
- Bozan C, Wallis I, Cook PG, Dogramaci S. 2022. Groundwater-level recovery following closure of open-pit mines. Hydrogeol J. 30(6):1819–1832. doi:10.1007/s10040-022-02508-2.
- Bruyn I, Prado D, Mylvaganam J, Walker D. 2019. Geotechnical considerations for the stability of open pit excavations at mine closure: some scenarios. 13th International Conference on Mine Closure; Perth. doi:10.36487/ACG_rep/1915_19_de_Bruyn.
- Cui F, Li B, Xiong C, Yang Z, Peng J, Li J, Li H. 2022. Dynamic triggering mechanism of the Pusa mining-induced landslide in Nayong County, Guizhou Province, China. Geomatics Nat Hazards Risk. 13(1):123–147. doi:10.1080/19475705.2021.2017020.
- Delgado-Martin J, Juncosa-Rivera R, Falcón-Suárez I, Canal-Vila J. 2013. Four years of continuous monitoring of the Meirama end-pit lake and its impact in the definition of future uses. Environ Sci Pollut Res Int. 20(11):7520–7533. doi:10.1007/s11356-013-1618-9.
- Diersch H-JG. 2014. FEFLOW: finite element modeling of flow, mass and heat transport in porous and fractured media. Berlin, Germany: Springer. doi:10.1007/978-3-642-38739-5.
- East D, Fernandez R. 2021. Managing water to minimize risk in tailings storage facility design, construction, and operation. Mine Water Environ. 40(1):36–41. doi:10.1007/s10230-020-00720-8.
- Elzen M d, Fekete H, Höhne N, Admiraal A, Forsell N, Hof AF, Olivier JGJ, Roelfsema M, van Soest H. 2016. Greenhouse gas emissions from current and enhanced policies of China until 2030: can emissions peak before 2030? Energy Policy. 89:224–236. doi:10.1016/j.enpol.2015.11.030.
- Gao Y, Li J, Yang T, Deng W, Wang D, Cheng H, Ma K. 2023. Stability analysis of a deep and large open pit based on fine geological modeling and large-scale parallel computing: a case study of Fushun West Open-pit Mine. Geomatics Nat Hazards Risk. 14(1):2266663. doi:10.1080/19475705.2023.2266663.
- He R-J, Jiang N, Zhang K, Zhao L, Zhou J-w 2024. Susceptibility assessment method for reservoir landslides considering the effect of reservoir impoundment. Geomatics Nat Hazards Risk. 15(1):2302563. doi:10.1080/19475705.2024.2302563.
- Huang R. 2012. Mechanisms of large-scale landslides in China. Bull Eng Geol Environ. 71(1):161–170. doi:10.1007/s10064-011-0403-6.
- Jia Z, Lin B. 2021. How to achieve the first step of the carbon-neutrality 2060 target in China: the coal substitution perspective. Energy. 233:121179. doi:10.1016/j.energy.2021.121179.
- Li H, Gao D, Wu J, Zhao D, Zhang L. 2021. Determination method of water gushing runoff zones in the open pit mining area. Bull Eng Geol Environ. 80(5):3953–3971. doi:10.1007/s10064-021-02186-6.
- Li J, Gao Y, Yang T, Zhang P, Deng W, Liu F. 2023a. Effect of water on the rock strength and creep behavior of green mudstone. Geomech Geophys Geo-Energ Geo-Resour. 9(1):101. doi:10.1007/s40948-023-00638-9.
- Li J, Gao Y, Yang T, Zhang P, Zhao Y, Deng W, Liu H, Liu F. 2023b. Integrated simulation and monitoring to analyze failure mechanism of the anti-dip layered slope with soft and hard rock interbedding. Int J Min Sci Technol. 33(9):1147–1164. doi:10.1016/j.ijmst.2023.06.006.
- Liu F, Yang K, Yang T, Gao Y, Li J, Liu Q, Fu Q. 2022. Pumped storage hydropower in an abandoned open-pit coal mine: slope stability analysis under different water levels. Front Earth Sci. 10:1–12. doi:10.3389/feart.2022.941119.
- Liu Z, Deng Z, He G, Wang H, Zhang X, Lin J, Qi Y, Liang X. 2021. Challenges and opportunities for carbon neutrality in China. Nat Rev Earth Environ. 3(2):141–155. doi:10.1038/s43017-021-00244-x.
- Lu P, Zhou L, Cheng S, Zhu X, Yuan T, Chen D, Feng Q. 2020. Main challenges of closed/abandoned coal mine resource utilization in China. Energy Sources Part A. 42(22):2822–2830. doi:10.1080/15567036.2019.1618992.
- Lv X, Wang Z, Wang J. 2014. Seepage–damage coupling study of the stability of water-filled dump slope. Eng Anal Boundary Elem. 42:77–83. doi:10.1016/j.enganabound.2013.08.010.
- Ma Q, Liu X, Tan Y, Elsworth D, Shang J, Song D, Liu X, Yan F. 2023. Numerical study of mechanical properties and microcrack evolution of double-layer composite rock specimens with fissures under uniaxial compression. Eng Fract Mech. 289:109403. doi:10.1016/j.engfracmech.2023.109403.
- Maliva RG. 2016. Aquifer characterization techniques. Cham, Switzerland: Springer. doi:10.1007/978-3-319-32137-0.
- Marinelli F, Niccoli WL. 2000. Simple Analytical Equations for Estimating Ground Water Inflow to a Mine Pit. Groundwater. 38(2):311–314. doi:10.1111/j.1745-6584.2000.tb00342.x.
- McCullough CD, Vandenberg J. 2020. Studying mine pit lake systems across multiple scales. Mine Water Environ. 39(2):173–194. doi:10.1007/s10230-020-00678-7.
- Nian G, Chen Z, Bao M, Zhang L, Zhou Z. 2022. Rainfall infiltration boundary conditions and stability of a fractured-rock slope based on a dual-continuum model. Hydrogeol J. 30(3):829–847. doi:10.1007/s10040-022-02468-7.
- Peng M, Ma C-Y, Chen H-X, Zhang P, Zhang L-M, Jiang M-Z, Zhang Q-Z, Shi Z-M. 2021. Experimental study on breaching mechanisms of landslide dams composed of different materials under surge waves. Eng Geol. 291:106242. doi:10.1016/j.enggeo.2021.106242.
- Read J, Beale G. 2013. Guidelines for evaluating water in pit slope stability. Collingwood, Australia: CSRIO Publishing. doi:10.1071/9780643108363.
- Read J, Stacey P. 2009. Guidelines for Open Pit Slope Design. Leiden, Netherlands: CSRIO Publishing. doi:10.1071/9780643101104.
- Renaud V, Al Heib M, Burda J. 2022. 3D large-scale numerical model of open-pit lake slope stability—case study of Lake Most. Bull Eng Geol Environ. 81(7):282. doi:10.1007/s10064-022-02771-3.
- Soni A, Mishra B, Singh S. 2014. Pit lakes as an end use of mining: a review. J Mining Environ. 5(2):99–111. doi:10.22044/JME.2014.326.
- State Council of the PRC. 2013. The national sustainable development plan for resource-based cities (2013–2020). [accessed]. https://www.gov.cn/zwgk/2013-12/03/content_2540070.htm.
- Sun S, Liu L, Hu J, Ding H. 2022. Failure characteristics and mechanism of a rain-triggered landslide in the northern longwall of Fushun west open pit, China. Landslides. 19(10):2439–2458. doi:10.1007/s10346-022-01926-3.
- Unsal B, Yazicigil H. 2016. Assessment of open pit dewatering requirements and pit lake formation for the Kışladağ gold mine, Uşak, Turkey. Mine Water Environ. 35(2):180–198. doi:10.1007/s10230-015-0345-5.
- Wang Z, Liu B, Han Y, Wang J, Yao B, Zhang P. 2020. Stability of inner dump slope and analytical solution based on circular failure: illustrated with a case study. Comput Geotech. 117:103241. doi:10.1016/j.compgeo.2019.103241.
- Xia M, Dong S, Chen Y, Liu H. 2021. Study on evolution of groundwater-lake system in typical prairie open-pit coal mine area. Environ Geochem Health. 43(10):4075–4087. doi:10.1007/s10653-021-00890-6.
- Xu T, Tang C-a, Zhao J, Li L, Heap MJ. 2012. Modelling the time-dependent rheological behaviour of heterogeneous brittle rocks. Geophys J Int. 189(3):1781–1796. doi:10.1111/j.1365-246X.2012.05460.x.
- Xu T, Xu Q, Deng M, Ma T, Yang T, Tang C-a. 2014. A numerical analysis of rock creep-induced slide: a case study from Jiweishan Mountain, China. Environ Earth Sci. 72(6):2111–2128. doi:10.1007/s12665-014-3119-7.
- Yang TH, Xu T, Liu HY, Zhang CM, Wang SY, Rui YQ, Shen L. 2014. Rheological characteristics of weak rock mass and effects on the long-term stability of slopes. Rock Mech Rock Eng. 47(6):2253–2263. doi:10.1007/s00603-013-0527-z.
- Yang Z, Lv J, ZHu J. 2003. Relation between stability of inner dump and rainfall in Fushun west open-pit coal mine. Opencast Mining. Technology(4):11–13. (in chinese). doi:10.3969/j.issn.1671-9816.2003.04.006.
- Yu J, Li J, Zhang W. 2019. Identification and classification of resource-based cities in China. J Geogr Sci. 29(8):1300–1314. doi:10.1007/s11442-019-1660-8.
- Yuan Y, Xu T, Heap MJ, Meredith PG, Yang T, Zhou G. 2021. A three-dimensional mesoscale model for progressive time-dependent deformation and fracturing of brittle rock with application to slope stability. Comput Geotech. 135:104160. doi:10.1016/j.compgeo.2021.104160.
- Zhang B, Zheng X, Zheng T, Xin J, Sui S, Zhang D. 2019. The influence of slope collapse on water exchange between a pit lake and a heterogeneous aquifer. Front Environ Sci Eng. 13(2):20. doi:10.1007/s11783-019-1104-9.
- Zhao L, Ren T, Wang N. 2017. Groundwater impact of open cut coal mine and an assessment methodology: a case study in NSW. Int J Min Sci Technol. 27(5):861–866. doi:10.1016/j.ijmst.2017.07.008.
- Zhou A, Hu J, Wang K. 2020. Carbon emission assessment and control measures for coal mining in China. Environ Earth Sci. 79(19):461. doi:10.1007/s12665-020-09189-8.
- Zhou J-w, Xu F-g, Yang X-g, Yang Y-c, Lu P-y. 2016. Comprehensive analyses of the initiation and landslide-generated wave processes of the 24 June 2015 Hongyanzi landslide at the Three Gorges Reservoir, China. Landslides. 13(3):589–601. doi:10.1007/s10346-016-0704-8.