
 ?Mathematical formulae have been encoded as MathML and are displayed in this HTML version using MathJax in order to improve their display. Uncheck the box to turn MathJax off. This feature requires Javascript. Click on a formula to zoom.
Abstract
When the working face of a steeply dipping coal seam crosses a fault, the dynamic disturbance caused by the mining load induces fault activation, causing large deformation and failure of the roadway. In this study, a physical similarity simulation and numerical calculation method were used to determine the main factors that the deformation and failure of fault zone roadway and reveal the underlying mechanisms. The results show that when crosses a fault, the high static load formed by the coupling of mining stress and fault pillar stress induces mining stress-type fault activation, which leads to large deformation and damage to the roadway in the fault zone. The main controlling factors are the fault location and mining load intensity. In terms of fault location, the vertical stress concentration away from the roadway side of the fault surface was high, the principal stress deflection angle was large, and the surface deformation of the fault on the roadway left side was the greatest. In terms of mining load intensity, the deflection angle of the principal stress of the surrounding rock initially increased and then decreased, and tensile failure easily occurred near the fault surface. These results provide a reference for roadway support.
1. Introduction
Steeply dipping coal seams are widely distributed in Sichuan, Guizhou, Gansu, Xinjiang, and other provinces in China. Such seams mainly contain scarce coal resources with important industrial uses, such as coking coal and anthracite, and have been internationally recognized as difficult coal seams to mine. Ensuring the safety and efficiency of mining operations represents a major engineering problem that must be resolved to ensure national energy security and regional economic and social development (Wu et al. Citation2017, Citation2020; Deng et al. Citation2023).
Because of the gravity dip effect, the movement of the surrounding rock in the mining face of a steeply dipping coal seam is more complicated than that in a general dip angle seam. The deformation and failure characteristics of roadways under the dynamic transmission of mining loads are unique and manifest as asymmetrical stress distribution and deformation in the surrounding rock under the dip angle effect (Chi and Yang Citation2019; Han et al. Citation2019; Zhang et al. Citation2021). Considering the site construction requirements, roadways of steeply dipping seam working faces mostly adopt a special-shaped section, which leads to a significant difference in the surrounding rock deformation. When a roadway passes through a fault fracture zone, the surrounding rock is broken, and the bearing capacity and deformation resistance are weakened (Wu et al. Citation2012; Cao et al. Citation2017; Jia et al. Citation2018). At the same time, the mining of the working face induces fault activation that leads to differences in the mining load transfer path of the rock surrounding the roadway. The surrounding rock is prone to large deformation damage and support structure failure, which endanger the safe production of mines (Gou and Xin Citation2011; Zhang et al. Citation2011).
Currently, scholars both domestically and internationally have conducted extensive research on the characteristics and mechanisms of fault activation. Pan and Dai (Citation2021) proposed a criterion for disturbance response and suggested that an increase in shear stress or a decrease in normal stress is the main factor underlying fault activation. Cai et al. (Citation2021) proposed a mechanical mechanism for two types of fault activation dominated by mining stress and mine vibration load and a mechanism for dynamic and static load superposition impact. Wang et al. (Citation2019) studied the influence of mining disturbances on the activation of reverse faults in the Qianqiu Coal Mine and indicated that larger fault drop and dip angle correspond to a greater likelihood that mining along the footwall will induce fault slips and even rock bursts. The abutment pressure increases gradually before passing through the fault and remains stable when passing through the fault. After passing through the fault, it gradually decreases and then gradually increases. Zhang et al. (Citation2019) established a multi-slider-spring mechanical model of thrust faults under dynamic and static loads and revealed the zoning characteristics of fault disturbances caused by mining activities and the local-overall instability process of faults. Jiang et al. (Citation2014) and Zuo et al. (Citation2009) analysed the evolution characteristics of mining stress near normal faults and found that faults have a significant barrier effect on mining stress transfer. The roof fault zone was in a low-stress state, and the floor fault zone was in a stress concentration state. Sjöberg et al. (Citation2012) used the discrete element software 3DEC to analyse the influence of different mining stages on the fault slip and mechanical properties of a near-fault rock mass in the LKAB Kiirunavaara mine and suggested that shear displacement of the orebody geological structure causes fault slip and may lead to mine earthquakes. Sainoki and Mitri (Citation2016) proposed three potential mechanisms of fault slip based on the finite difference software FLAC3D and indicated that asperity shear causes large area slip in faults while stope extraction causes fault slip near the stope. Islam and Shinjo (Citation2009) used BEM to simulate the fault activation law induced by mining the Barapukuria coal mine and found that the redistribution of mining stress led to evident deformation inside and around the fault and a high stress concentration at the end of the fault. At the same time, some scholars have analysed the mechanical behaviour of surrounding rock in complex geological conditions through the microseismic monitoring method, achieving the identification and relevant data extraction of hazardous areas such as coal seams and overlying rocks, which can provide new ideas and methods for the study of fault activation characteristics (Khan et al. Citation2021; Khan, He, et al. Citation2022; Khan, Xueqiu, et al. Citation2022; Khan et al. Citation2024).
Under the influence of mining, faults are easily activated, which hinders the ability to control the surrounding rock, and large deformation support problems occur when the roadway passes through the fault fracture zone. Zhang et al. (Citation2017) and Chen et al. (Citation2018) found that the displacement and approaching velocity of the coal and rock mass in the footwall of a fault under the influence of mining were significantly greater than those in the hanging wall of the fault. During the fault slip activation process, the deformation of the roadway floor heave was the most serious, followed by that of the right side, while roof subsidence and damage to the left side were less serious. Gou and Hu (Citation2006) studied the failure of the roadway surrounding rock in an asymmetrical fault zone, in which uneven deformation occurred on the two sides, and observed serious failure of the fault coal pillar and roof and floor close to the fault. In addition, Chen and Wu (Citation2018) analysed the large deformation mechanism of roadways in fault fracture zones under the combined action of tectonic stress, gravity, and random joints.
In summary, research on faults mainly focuses on the mechanisms underlying fault activation and rock bursts, deformation and damage characteristics of roadways in fault zones, and improving support technology, and such work has preliminarily revealed the stress and displacement characteristics of different types of fault zones under mining disturbance and the large deformation characteristics of roadways. However, few studies have focused on the problem of large deformations and failures of roadways of steeply dipping seam working faces that cross faults (Du et al. Citation2022; Tan et al. Citation2023). Based on the engineering background of the roadway of the 3115−14 working face of the Taiping Coal Mine, this study comprehensively analyses the deformation and damage characteristics and main controlling factors of the surrounding rock of the fault zone under the action of mining disturbance based on physical similarity simulation experiments and numerical calculations and provides a reference for the reasonable support of such roadways.
2. Engineering background
The Taiping Coal Mine of the Sichuan Coal Huarong Energy Company is located on Taiping South Road, Renhe District, Panzhihua City, Sichuan Province. The mining range extends from the Jinsha River in the north to the A48 exploration line in the south and from the Mosuo River in the east to the F22 fault in the west. The strike length of the mine is 8.5 km, the east-west width is 1.47 km, and the mine area is 12.5 km2. The 15# coal seam is the main mining coal seam, the average thickness is 4.91 m, Protodyakonov coefficient (f) is less than 1.5, the density is 1.35 t/m3, and the dip angle is 35°–49°, which belongs to the steeply dipping thick coal seam. The immediate roof of the coal seam is siltstone, while the main roof is fine sandstone and coarse sandstone. The immediate floor consists of argillaceous siltstone, siltstone, fine sandstone, and coal line, while the main floor is coarse sandstone. The columnar and mechanical parameters of the coal and rock strata are presented in .
Table 1. The columnar and mechanical parameters of coal and rock strata.
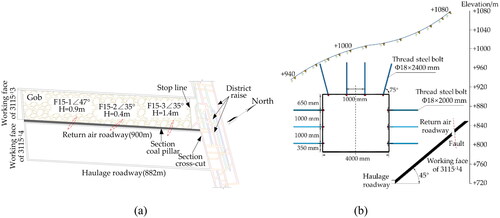
The maximum burial depth of the 3115−14 working face is 522 m, the minimum burial depth is 355 m, the strike length is 900 m, and the inclined length is 145 m. A fully mechanized longwall mining method was adopted, and the advancing speed was 6 m/d. The working face is exposed and advanced from the footwall, and three groups of reverse faults, F15-1, F15-2, and F15-3, were encountered when mining from southwest to northeast. The formation spacing of the reverse faults is 0.2–2.3 m, the dip angles are 47°, 35°, and 85°, and the drop is 0.9, 0.4, and 4.5 m. The fault zone is filled with mud, and the lithology is mixed. The main components include mudstone, siltstone, and a small amount of sandstone. The F15-3 fault fracture zone caused significant damage to the roof and floor of the coal seam, which significantly impacted the mining of the working face. The relationship between the layout of the roadway and the location of the F15-3 fault is shown in . The elevation of the 3115−14 return air roadway is + 820 m, and the depth from the surface is 350 m. The cross-section is rectangular and has a length of 4000 mm, width of 3000 mm, and net area of 12 m2. The support of the roadway was a bolt, metal mesh, tray, and anchoring agent. The layout of the roadway and the support section of the working face are shown in .
Figure 1. Layout and support section of the roadway: (a) relationship between the roadway layout and fault location and (b) roadway position and support section.
3. Law of mining load transfer and fault activation in working face
3.1. Design of the physical simulation experiment
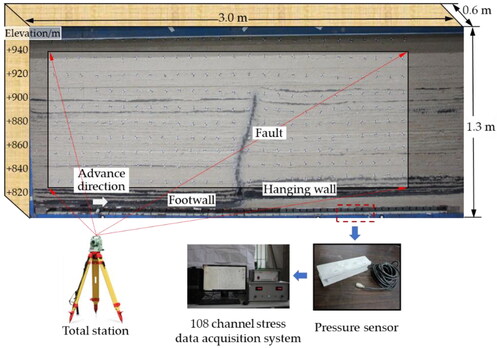
According to the geological and mining conditions of the 3115−14 working face in the Taiping Coal Mine, an experimental model was built using a two-dimensional physical similarity simulation experiment platform. The model length is 3.0 m, width is 0.6 m, and height is 1.3 m. The dynamic load transfer law and its influence on fault activation during mining were studied.
3.1.1. Similar proportion design
The physical similarity simulation experiment is to use similar materials to reduce the on-site engineering research object into an experimental model according to geometric similarity constant based on the field coal and rock strata columnar chart and physical and mechanical parameters. As the three laws of similarity, the physical and mechanical parameters of the experimental model were determined, including: (1) physical and mechanical parameters of the surrounding rock, namely bulk density (γ), elastic modulus (E), cohesion (C), uniaxial compressive strength (Rc), friction angle (φ); (2) the size parameters of surrounding rock, namely the coal and rock strata strike length (L) and vertical height (H).
Based on a combination of the laboratory experiment platform size and similarity theory, the similarity condition of the model was determined as follows:
(1)
(1)
(2)
(2)
(3)
(3)
(4)
(4)
(5)
(5)
where Cl is the geometric similarity constant; Cγ is the stress similarity constant; Cσ is the stress similarity constant; CF is the load similarity constant; Cτ is the time similarity constant; p is the prototype parameter; and m is the model parameter.
3.1.2. Similar material selection
Based on the characteristics and mechanical parameters of the coal and rock layers, river sand and pulverized coal were selected as aggregates, gypsum and calcium carbonate were selected as cementing materials, and mica powder was selected as the coal-coal and coal-rock layered materials. In addition, the fault zone was filled with coarse sand and water.
3.1.3. Similar model pavement
When paving the model, firstly, the pressure sensors were lay at the bottom of the model. Secondly, the aggregates and cementing materials were mixed evenly according to the ratio of similar materials. After adding an appropriate amount of water, the mixture was fully stirred and then loaded into the model to pave. After tamping the material with a heavy object, the layered material was evenly distributed. Repeat the above steps until the model paving was completed. After the experiment began, using a 108-channel stress data acquisition system, the stress change data during the mining process of the working face were recorded in real time, and the dynamic transmission law of the mining load was analysed. The completed model and monitoring equipment are shown in .
Figure 2. Physical similarity simulation experimental model and monitoring equipment.
3.2. Experimental phenomenon
With the advancement of the working face, periodic collapse of the roof, and bending and sinking of the upper rock strata, the advanced abutment pressure continued to move forward, the surrounding rock at the advanced working face position became deformed, and the internal joints and fissures of the coal and rock mass continued to develop and expand, eventually inducing fault activation. In the experiment, five periodic weightings were located near the fault. The distances from the fault were 53, 33, 9, −6, and −24 m; the periodic weighting intervals were 22, 20, 24, 15, and 18 m; the caving heights of the roof were 42, 68, 94, 123, and 132 m; the caving angles in front of the working face were 43, 48, 48, 58, and 67°; and the caving angles behind the goaf were 38, 53, 63, 64, and 64°. The roof periodically collapsed, the surrounding rock stress was redistributed, and abutment pressure was formed at the front of the working face and rear of the goaf ( and ).
Figure 3. Mining load transfer law of the working face: (a) roof caving form of the working face crossing a fault and (b) distribution characteristics of the abutment pressure in the working face.
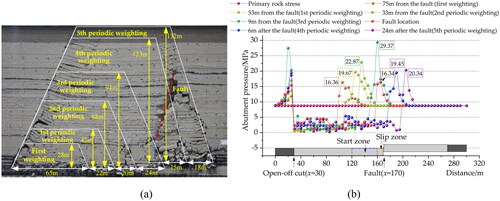
Table 2. Characteristic parameters of ground pressure behaviour in working face.
As the working face entered the fault zone, the roof periodic caving interval decreased, the caving angle increased, and the caving height increment increased. When the distance from the fault was 50–10 m, the advance abutment pressure continuously increased, reaching a maximum value of 29.37 MPa. As the influence range of the advanced abutment pressure increased, the mining fracture continued to expand, and the fault continued to deform. This area corresponded to the fault activation start zone. In the range of 10 m from the fault, the peak value of the abutment pressure was obviously reduced, the mining fracture was connected to the weak plane of the fault, and the fault began to activate, that is, the continuity of the displacement and the coordination of the deformation in the hanging wall and footwall of the fault were destroyed, and shear slip movement along the fault plane occurred. This area is known as the fault-activation slip zone (Wang et al. Citation2023).
3.3. Analysis of the experimental results
The working face advanced perpendicular to the strike of the fault, and the stress of the fault coal pillar and mining stress were superimposed and coupled to form a high static load. Simultaneously, the mining stress was characterized by unloading at the horizontal goaf side and loading in the vertical direction, which caused a local adjustment of the fault stress field and unlocking activation, that is, fault activation dominated by mining stress occurred. The minimum critical value of the fault activation is determined as follows (Cai et al. Citation2021):
(6)
(6)
where (δ1−δ3)slip-min is the minimum critical value of fault activation, c is the fault cohesion, φf is the fault friction angle, δ3 is the minimum principal stress, and p is the pore pressure. Among them, (δ1−δ3)slip-min is positively correlated with c, φf, and δ3 and negatively correlated with p.
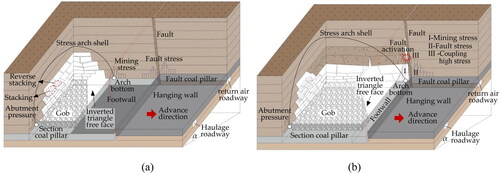
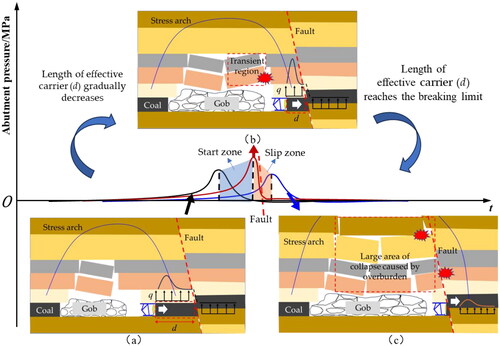
Combined with a similar simulation experiment phenomenon, in the initial stage of the steeply dipping working face advancing along the strike, the mining activity was far from the fault, and the roof of the mining space became broken and collapsed along the strike to form a three-hinged arch or a similar three-hinged arch masonry structure. Affected by the gravity dip effect, a multilevel stepped structure of reverse stacking in the middle and upper regions and stacking in the middle and lower regions was formed along the tendency. The strike and tendency rock mass structure interacted with the mining load to form a three-dimensional asymmetric stress arch shell in the rock surrounding the stope. The mining stress formed in the coal pillar at the position of the arch bottom was not affected by the stress of the faulty coal pillar, and the possibility of fault activation was low (). With the advancement of the working face, mining activity occurred closer to the fault, and the position of the arch bottom migrated. The coupling of mining stress with fault coal pillar stress led to the formation of concentrated stress in the coal pillar. Roof subsidence decreased the horizontal stress in the upper part of the fault and led to a tensile stress state, resulting in a decrease in the lateral pressure coefficient of the fault surface. Thus, the minimum principal stress (δ3) and critical value of fault activation ((δ1−δ3)slip) decreased, which inevitably led to local adjustments in the fault stress field and promoted fault activation. These changes induced large deformation and failure of the roadway in this area ().
Figure 4. Load transfer path of the working face crossing a fault: (a) working face away from the fault and (b) working face near the fault.
Furthermore, during the advancement of the working face, due to the blocking effect of the fault on stress transfer, the effective bearing length (d) decreases continuously and the mining load intensity in front of the working face increases, which induces fault activation. When the working face continues to advance in the direction of the fault due to the weak shear force of the fault, it is easy to cause the chain collapse reaction of the overlying rock along the fault, and a large area of the transient region collapses to form a strong dynamic load. The superposition of high static load and strong dynamic load forms a fault activation slip zone. Therefore, as the mining load intensity increases, fault activation is induced, strong dynamic load is formed in the transient region of overburden rock, and fault slip is caused by the superposition of the mining load (high static load), as shown in .
Figure 5. Characteristic impacts of mining load strength.
In summary, the transmission of mining load is blocked by fault, resulting in obvious differences in stress states at different positions of the fault fracture zone. When the roadway is located at different positions of the fault, the non-equilibrium of surrounding rock deformation of roadway is significant, leading to the failure of surrounding rock-support structure at different positions of roadway, and inducing roof caving, rib spalling and other instability disasters of roadway in fault zone. Therefore, the mining load strength and the relationship between the roadway and the fault affect the minimum principal stress (δ3), which are the two main factors that control roadway damage when a steeply dipping coal seam crosses a fault.
4. Discussion of the main factors controlling roadway deformation and damage
The mining dynamic behaviour of the steeply dipping coal and rock masses is a full-cycle space-time evolution process (Wu et al. Citation2023). The above physical simulation experiment results show the mechanical behaviour response characteristics of the deformation and failure of the roadway. In order to illustrate the mechanical behaviour characteristics of the evolution process of the surrounding rock stress field, further discussion on the specific characteristics of the two main factors that led to large deformation and failure of the roadway crossing the fault, FLAC3D finite difference software was used to calculate and analyse the stress and displacement evolution law of the roadway surrounding rock passing through a fault in a steeply dipping working face under different fault positions and mining load intensities.
4.1. Numerical calculation scheme
To reveal how fault location leads to large deformations of roadways, the dip angle of the coal seam was set to 45°, the lateral pressure coefficient (λ) was 0.25, and the evolution law of stress and displacement of the surrounding rock of the roadway in the fault zone was studied under six working conditions: no fault, fault 1 m from the left side of roadway, fault 1 m from the right side, fault located on the left side, fault located in the middle of roadway, and fault located on the right side.
To reveal the mechanism underlying the effects of mining action on large deformation of roadways, the dip angle of the coal seam was set to 45°, and the lateral pressure coefficient (λ) was 0.25. Then, according to the law of ground pressure behaviour of the 3115−14 working face crossing the fault, the evolution law of stress and displacement of the roadway surrounding rock was studied under four working conditions, with the second periodic weighting, third periodic weighting, fault position, and fourth periodic weighting stage of the working face, namely, the peak value of the abutment pressure, set to 22.87, 29.37, 16.34, and 19.45 MPa, respectively, and load strength coefficient set to 2.61, 3.36, 1.87, and 2.22, respectively.
4.2. Numerical modelling
Considering the roadway of the 3115−14 working face as the engineering background, a stratum model was established according to the engineering geological and production conditions using rhino three-dimensional modelling software, and the grid was divided by Griddle. The results were then imported into FLAC3D software to generate a 3D numerical calculation model (). The model length (X) was 50 m, the width (Y) was 20 m, and the height (Z) was 50 m, and it included 202,890 grids and 37,997 nodes. The buried depth of the roadway was 350 m; therefore, a compensation load of 7.5 MPa should be applied to the model roof. When the lateral pressure coefficient (λ) was 0.25, a horizontal stress of 2.5 MPa was applied to the model. An interface command was used to establish the F15-3 fault plane with a dip angle of 85° and a drop of 4.5 m.
Figure 6. 3D numerical calculation model.
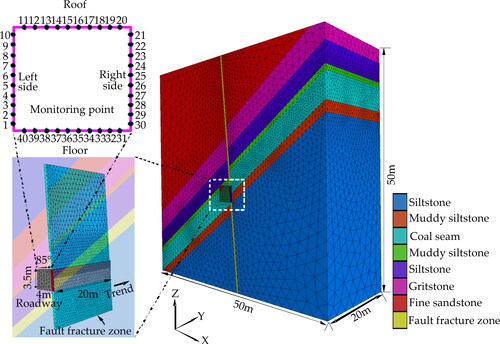
The model adopted the Mohr–Coulomb constitutive model and large-deformation stress mode. The physical and mechanical parameters of the rock strata are listed in . The fault normal stiffness, tangential stiffness, internal friction angle, and cohesion were 20 GPa, 10 GPa, 20°, and 0.7 MPa, respectively. Considering the impact of the boundary effect, 20 m boundary coal pillars were reserved on both sides of the model, and 5 m boundary coal pillars were reserved in the front and rear. After the calculation was completed according to the numerical experimental scheme, the elastic-plastic theory was used to map the calculation results using Fish language, and the principal stress evolution characteristics of the surrounding rock of the reverse fault activation roadway were obtained.
4.3. Influence of fault location on deformation and failure of the roadway
4.3.1. Stress transfer characteristics of roadway surrounding rock
The stress distribution characteristics of the roadway under different working conditions are shown in .
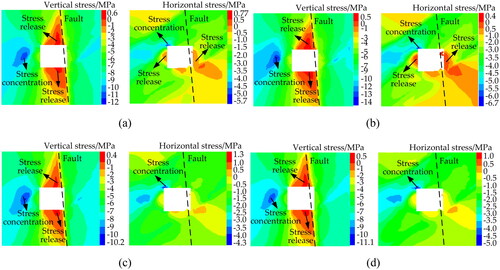
Figure 7. Stress distribution characteristics of roadway surrounding rock at different fault locations: (a) no fault, (b) fault 1 m from the left side, (c) fault 1 m from the right side, (d) fault located on the left side, (e) fault located in the middle of the roadway, and (f) fault located on the right side.
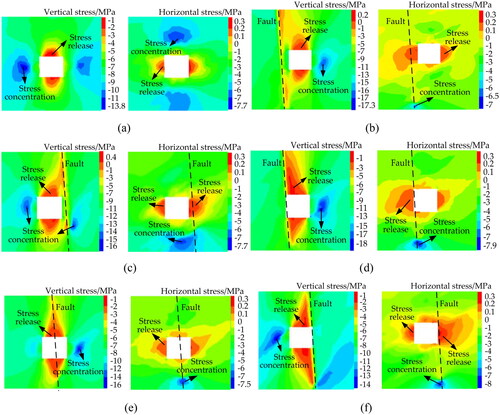
Under the no fault condition, vertical stress is released and horizontal stress is concentrated in the roadway roof and floor, and vertical stress is concentrated and horizontal stress is released on the two sides (). Affected by the dip angle of the coal seam, the vertical stress peaks of the left and right sides were 13.6 and 12.6 MPa, respectively, and the concentration coefficients were 1.55 and 1.44, respectively. The degree of vertical stress concentration on the left side was greater than that on the right side. The horizontal stress peak values of the roof and floor were 7.7 and 6.5 MPa, respectively, and the degree of horizontal stress concentration in the roof was greater than that in the floor.
When the fault was 1 m away from the left side of the roadway, the vertical stress release range of the roadway roof and floor increased and formed a connection with the fault zone (). The vertical stress concentration ranged from 1.7 m to 2.7 m from the right side, with a peak stress of 17.3 MPa and a concentration coefficient of 1.97. The horizontal stress release range on the left side of the fault zone was larger than that on the right side, and stress became concentrated at the lower end of the fault. The fault had an obvious blocking effect on vertical stress transfer.
When the fault was 1 m from the right side of the roadway, the vertical stress concentration area of the left side of the roadway was large, the stress peak was 15.7 MPa, and the concentration coefficient was 1.79 (). Moreover, the vertical stress concentration area of the right side was transferred along the fault towards the deep part. The degree of horizontal stress release on the right side was greater than that on the left side, and the horizontal stress concentration occurred at a fault position 2.7 m from the floor, with a peak stress of 7.3 MPa.
When the fault was located on the left side of the roadway, it was connected to the vertical stress release area of the roof and floor, and the vertical stress release range of the roof was larger than that of the floor (). Vertical stress became concentrated within the range of 1.3 m to 3.2 m from the right side, the peak stress was 14.3 MPa, and the concentration coefficient was 1.63. The horizontal stress release range on the left side was greater than that on the right side. The horizontal stress concentration in the fault zone was 4.2 m from the floor, and the peak stress was 7.9 MPa.
When the fault was located in the middle of the roadway, the vertical stress release zones of the roof and floor extended in the direction of the fault zone (). The vertical stress peaks of the left and right sides were 14.1 and 12.4 MPa, respectively, and the concentration coefficients were 1.41 and 1.61, respectively. The horizontal stress release degrees on the two sides were similar, and the horizontal stress concentration was 4 m from the floor, with a peak value of 7.5 MPa.
When the fault was located on the right side of the roadway, the stress release range of the roof and floor along the fault zone increased (). The vertical stress concentration peak of the left side was 14.5 MPa, and the concentration coefficient was 1.65. The horizontal stress release range on the right side was larger than that on the left side, and horizontal stress concentrated at the lower end of the fault, with a peak value of 7.7 MPa.
The principal stress state of the surrounding rock changes during roadway excavation in fault zones. Near the excavation space, the surrounding rock was in a unidirectional tension state. With further excavation to deep parts, the surrounding rock changed to a bidirectional compressive state. The direction of the first principal stress of the surrounding rock at different positions deflected to varying degrees, and its angle with the Z axis was θ (). Under different fault location conditions, the maximum values of the first principal stress deflection angle (θmax) of the roadway roof, floor, and two sides of the survey line are shown in . The cloud atlas of the first principal stress deflection angle was similar to that of the vertical stress release zone. The first principal stress deflection angles of the roof and floor were larger than those of the two sides, and the angle of the side close to the fault was greater than that far from the fault.
Figure 8. Deflection characteristics of the first principal stress in the roadway surrounding rock at different fault positions: (a) no fault, (b) fault 1 m from the left side, (c) fault 1 m from the right side, (d) fault located on the left side, (e) fault located in the middle of the roadway, and (f) fault located on the right side.
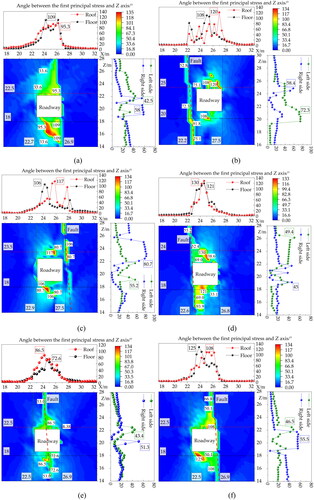
Table 3. The maximum deflection angle (θmax) of the first principal stress in surrounding rock at different fault locations.
The above analysis shows that fault location had a significant impact on the stress distribution in the roadway surrounding rock. The degree of vertical stress release in the fault zone also differed, and the fault had an obvious barrier effect on vertical stress transmission, resulting in a large degree of vertical stress concentration on the roadway side far away from the fault. The fault had a weak barrier effect on horizontal stress transmission, the degree of horizontal stress release of the roadway side at the fault position was large, and the horizontal stress concentration phenomenon was obvious in the floor. When the fault was located on the left side of the roadway, the vertical stress of the roof and floor and horizontal stress of the two sides were significantly released, the vertical stress of the two sides and horizontal stress of the floor were significantly concentrated, and deformation of the roadway surrounding rock was difficult to control.
4.3.2. Displacement distribution characteristics of roadway surrounding rock
When the roadway was not in the fault zone (), the surface deformation of the roadway roof and floor was large, while the surface deformation of the two sides was small. Affected by the dip angle of the coal seam, the top corner area on the right side of the roadway and the bottom corner area on the left side were large deformation areas of the roadway surrounding rock. Along the direction of the coal seam dip angle, the deep displacement contour of the roadway surrounding rock was symmetrically arched.
Figure 9. Roadway surrounding rock displacement distribution at different fault positions: (a) no fault, (b) fault 1 m from left side, (c) fault 1 m from right side, (d) fault located on left side, (e) fault located in the middle of roadway, and (f) fault located on the right side.
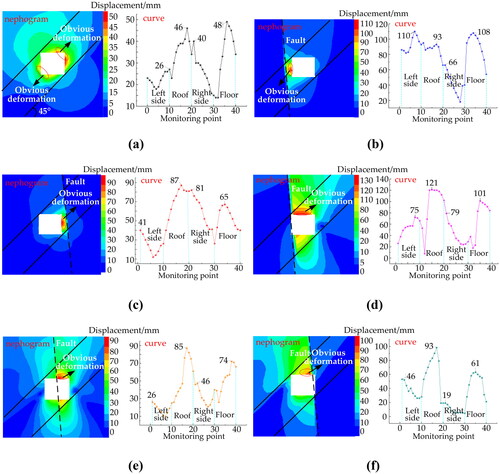
When the fault did not penetrate the roadway (), the deformation near the fault zone was large. Taking the fault surface as the dividing line and dip angle of the coal seam as the axis, the displacement contour of the roadway surrounding rock was approximately symmetrical. Greater surface deformation was observed when the roadway was located in the hanging wall of the fault (the fault was 1 m from the left side) than when it was located in the footwall (the fault was 1 m from the right side).
When the fault passed through the roadway roof and floor (), mining induced fault slip deformation owing to the weak lithology and low bearing capacity of the fault. Obvious displacement change occurred at the fault zone, resulting in a large deformation of the roof and floor. The surface deformation of the surrounding rock was the largest when the fault is located on the left side of the roadway. Specific displacement values were obtained from the roadway-surrounding rock surface monitoring points ().
Table 4. Surface deformation of roadway surrounding rock at different fault locations. (unit: mm).
4.4. Influence of mining load strength on deformation and failure of the roadway
4.4.1. Stress transfer characteristics of roadway surrounding rock
The stress distribution characteristics of the roadway surrounding rock under different load strengths are shown in .
Figure 10. Stress distribution characteristics of roadway surrounding rock under different load strengths: (a) load strength coefficient of 2.61, (b) load strength coefficient of 3.36, (c) load strength coefficient of 1.87, and (d) load strength coefficient of 2.22.
After excavating the roadway, vertical stress of the roof and floor of the roadway was released under different load intensities. The release area was connected with the fault zone, and vertical stress was concentrated at 2.2 to 3.5 m from the left side. As the load intensity increased, the vertical stress release range of the roof and floor along the fault direction increased, and the degree of vertical stress concentration on the left side also increased. When the load strength coefficients were 2.61, 3.36, 1.87, and 2.22, the corresponding vertical stress concentration peaks on the left side were 12, 14, 10.2, and 11.1 MPa, respectively, and the concentration coefficients were 1.37, 1.6, 1.17, and 1.27, respectively.
Under the action of different load intensities, the horizontal stresses on the two sides of the roadway were released, and the stress-release range on the right side was larger than that on the left. The horizontal stress concentration phenomenon was evident at the shoulder corner of the roof and on the left side. As the load strength increased, the horizontal stress release range of the two sides and degree of horizontal stress concentration at the shoulder corner increased. When the load strength coefficients were 2.61, 3.36, 1.87, and 2.22, the horizontal stress concentration peaks at the shoulder corners were 5.7, 6.7, 4.3, and 5.0 MPa, respectively.
The deflection characteristics of the first principal stress direction of the roadway surrounding rock in the fault zone under different load intensities are shown in , and the maximum deflection angles (θmax) of the surrounding rock are shown in . The cloud atlas of the first principal stress deflection angle for different load strengths was similar, indicating that the first principal stress deflection angle of the floor was larger than that of the roof and the first principal stress deflection angle of the right side was larger than that of the left side. With an increase in load strength, the two-way and one-way tension states of the roof and floor increase, and the deflection angle of the first principal stress increases. The two sides show that the deflection angle of the first principal stress of the left side increased while that of the right side remained unchanged. As the load strength decreased, the deflection angle of the first principal stress of the roof, floor, and left side decreased significantly, the changes of the floor and left side were significant, and the deflection angle of the first principal stress on the right side was unchanged.
Figure 11. Deflection characteristics of the first principal stress of the roadway surrounding rock under different load strengths: (a) load strength coefficient of 2.61, (b) load strength coefficient of 3.36, (c) load strength coefficient of 1.87, and (d) load strength coefficient of 2.22.
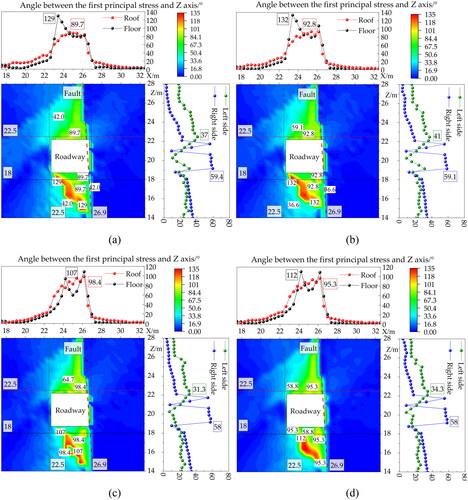
Table 5. The maximum deflection angle (θmax) of the first principal stress in surrounding rock with different load strength.
The above analysis shows that because of the blocking effect of the fault zone, the vertical stress concentration degree of the left side of the roadway was large, the horizontal stress release degree of the right side near the fault zone was large, and the horizontal stress concentrated at the shoulder corner of the roof and left side was obvious. As the load intensity increased, the vertical stress on the left side and the horizontal stress concentration of the shoulder corner increased, while the horizontal stress release range of the right side increased. The deflection angles of the first principal stresses of the roadway roof and floor were greater than those of the two sides; the angle of the floor was greater than that of the roof, and the angle of the left side was greater than that of the right side. When the load intensity coefficient was 3.36, the vertical stress of the left side and horizontal stress concentration of the shoulder corner were the largest, the horizontal stress release of the right side was obvious, and the deflection angles of the first principal stress between the roof, floor, and left side were large. Thus, the roadway surrounding rock was prone to deformation and failure.
4.4.2. Displacement distribution characteristics of roadway surrounding rock
Changes in mining load intensity had a significant effect on the deformation of the rock surrounding the roadway in the fault zone (). Under different load intensities, the roadway was affected by the fault zone and dip angle of the coal seam, which indicated that the deformation of the roof area near the fault zone was large and prone to tensile failure. Moreover, deformation of the right side of the roadway was greater than that of the left side.
Figure 12. Roadway surrounding rock displacement distribution under different load strengths: (a) load strength coefficient of 2.61, (b) load strength coefficient of 3.36, (c) load strength coefficient of 1.87, and (d) load strength coefficient of 2.22.
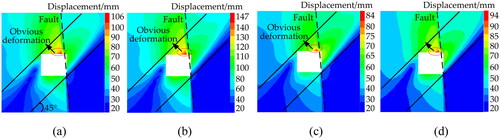
When the load strength coefficient increased from 2.61 to 3.36, the deformation of the surrounding rock increased obviously under an increase in load strength, and the displacements of roof and right side near the fault zone also increased significantly by 38.6% and 64.1%, respectively.
When the load strength coefficient decreased from 3.36 to 1.87, the deformation of the surrounding rock decreased under a decrease in load strength, and the displacements of roof and right side near the fault zone decreased greatly by 42.8% and 62.9%, respectively. Under the action of the mining dynamic load, the deformation of the surrounding rock of the roadway crossing the fault was ordered from largest to smallest as the roof, right side, left side, and floor. The specific displacement values are listed in .
Table 6. Surface deformation of roadway surrounding rock with different load strength. (unit: mm).
4.5. Comparison with existing research
In this study, the influence of the main factors controlling the large deformation and failure of roadways when the working face crosses a fault is revealed via physical simulation experiments and numerical calculations. In terms of fault location, the vertical stress concentration of the roadway far away from the fault surface is large and the horizontal stress release of the roadway near the fault surface is large. The deflection angle of the principal stress of the roof and floor of the roadway in the fault zone is larger than that of the two sides, while the deflection angle of the main stress of the roadway far away from the fault surface is also large. The surface deformation of the fault located on the left side of the roadway is the largest, and that of the fault passing through the centre of the roadway is the smallest. In terms of load intensity, when the load intensity increases, the vertical stress of the left side and horizontal stress concentration of the shoulder angle increase, the horizontal stress release range of the right side near the fault plane increases, and the displacement of the roof and right side changes significantly, with increases of 38.6% and 64.1%, respectively. When the load intensity decreases, the stress concentration of the roadway side decreases and the displacement of the roof and right side decreases by 42.8% and 62.9%, respectively. The roof of the fault area is prone to tensile failure.
The deformation and failure mechanisms of the surrounding rock of the roadway in the fault zone under similar conditions are compared. Previous research (Li et al. Citation2023) indicated that the principal stress deflection of the shallow fault plane overlying the roof of the roadway is significantly affected by mining disturbance of the working face and significantly decreases as the distance between the roadway and working face increases. Zhao, Lu, et al. (Citation2018) and Zhao, Wang, et al. (Citation2018) suggested that mining-induced principal stress deflection increases the shear stress along the fault plane and decreases the normal stress. When the working face of the reverse fault footwall is mined in the direction of the fault, the principal stress of the floor near the fault plane is initially deflected, and the risk of bed separation or shear-slip instability on the fault plane increases.
In the above studies, the stability of the roadway in the fault zone is investigated according to the degree of principal stress deflection and the mutual position of the roadway and fault. The characteristics that influence the fault position and load strength on the deformation and failure of the roadway are explained from the side, which further shows the rationality of the research content and validity of the research results.
It should be noted that this article adopted the research methods of physical similarity simulation experiments and numerical calculations, and its main characteristics were reflected in: First, the main controlling factors underlying large deformation and failure of the surrounding rock and supporting structures of roadways in the fault fracture zone are the fault position (or roadway position) and mining load strength. Second, the deformation and failure mechanisms of roadways under different factors are analysed in detail. When the fault is located on the left side of the roadway, more obvious deformation and failure of the roadway will occur under a greater mining load. This finding can provide guidance for determining the roadway layout and support.
Meanwhile, due to space limitations, the article based on the deformation and failure characteristics of the surrounding rock of roadways of underground sites, and mainly carried out relevant work to explain and verify the concept of this article. However, corresponding roadway support technology has not been further proposed to effectively control the deformation and failure characteristics of underground roadways under current layout conditions. Such technology should be investigated in future work.
5. Conclusions
During the process of approaching the fault in the working face, the distance from the fault was 50–10 m in the fault activation start zone and the distance from the fault was 10 m into the fault activation slip zone. The mining stress and fault stress were superimposed and coupled to form a high static load, thus causing mining stress-type fault activation. The fault location and mining load intensity affected the minimum principal stress, which was the main controlling factor leading to the large deformation and damage of the roadway.
The blocking effect of the fault on vertical stress transfer was stronger than that on horizontal stress transfer. The degree of vertical stress concentrated on the roadway side away from the fault and degree of horizontal stress released on the roadway side near the fault were high. The principal stress deflection angles of the roof and floor of the roadway in the fault zone were larger than those on the two sides. The surface deformation of the fault on the left side was the largest, while the surface deformation of the fault passing through the centre of the roadway was the smallest.
With an increase in the mining load intensity, the degree of vertical stress concentrated on the left side and horizontal stress concentrated at the shoulder corner increased. The displacement of the roof and right side near the fault zone increased significantly by 38.6% and 64.1%, respectively. During the process of load strength reduction, the degree of stress concentration decreased, and displacements of the roof and right side decreased by 42.8% and 62.9%, respectively. The deflection angle of the first principal stress of the surrounding rock initially increased and then decreased, and the roof area on the fault side was prone to tensile failure.
Acknowledgments
The authors thank the editors and staff for their assistance. The authors thank the anonymous reviewers for their comments and suggestions for improving the manuscript.
Disclosure statement
No potential conflict of interest was reported by the author(s).
Data availability statement
Relevant data are listed in the paper.
Additional information
Funding
References
- Cai W, Dou LM, Si GY, Hu YW. 2021. Fault-induced coal burst mechanism under mining-induced static and dynamic stresses. Engineering. 7(5):687–700. doi:10.1016/j.eng.2020.03.017.
- Cao SG, Wang S, Wang SQ, Yang HY. 2017. Adaptability of roadway section shape in deep inclined seam. J Northeast Univ (Nat Sci). 38(03):436–441. doi:10.3969/j.issn.1005-3026.2017.03.027.
- Chen H, Jiang YD, Deng DX, Shao MM, Feng JM, Di JH. 2018. Study on deformation characteristics and support optimization of weak surrounding rock in fault zone. Min Sci Technol. 3(06):543–552. doi:10.19606/j.cnki.jmst.2018.06.005.
- Chen XX, Wu JP. 2018. Study on the mechanism and control technology of large deformation of roadway surrounding rock in the fault fracture zone. J Min Saf Eng. 35(05):885–892. doi:10.13545/j.cnki.jmse.2018.05.002.
- Chi XL, Yang K. 2019. Roadway surrounding rock failure mechanism and support technology of revolving mining stage in steeply inclined coal seam. Chin J Undergr Space Eng. 15(05):1504–1510.
- Deng DX, Wang HW, Xie LL, Wang ZL, Song JQ. 2023. Experimental study on the interrelation of multiple mechanical parameters in overburden rock caving process during coal mining in longwall panel. Int J Coal Sci Technol. 10(1):47. doi:10.1007/s40789-023-00608-2.
- Du F, Ma J, Guo XF, Wang TF, Dong XH, Li JS, He SL, Nuerjuma D. 2022. Rockburst mechanism and the law of energy accumulation and release in mining roadway: a case study. Int J Coal Sci Technol. 9(1):67. doi:10.1007/s40789-022-00521-0.
- Gou PF, Hu YG. 2006. Effect of faults on movement of roof rock strata in gate way. J Min Saf Eng. 03:285–288.
- Gou PF, Xin YJ. 2011. Stability analysis of roof structure in pitched seam gateway. J China Coal Soc. 36(10):1607–1611. doi:10.13225/j.cnki.jccs.2011.10.014.
- Han ZP, Dou LM, Wang ZY, Qiao ZD. 2019. Research on stress distribution law of two ribs in large dip angle working face under influence of dynamic and static loads. Coal Sci Technol. 47(9):183–188. doi:10.13199/j.cnki.cst.2019.09.022.
- Islam MR, Shinjo R. 2009. Mining-induced fault reactivation associated with the main conveyor belt roadway and safety of the Barapukuria Coal Mine in Bangladesh: constraints from BEM simulations. Int J Coal Geol. 79(4):115–130. doi:10.1016/j.coal.2009.06.007.
- Jia ZK, Wang JC, Dai XF. 2018. Roadway surrounding rock deformation and failure mechanism and supporting research in inclined seam. Coal Sci Technol. 46(1):68–71 + 126.
- Jiang JQ, Wu QL, Qu H. 2014. Evolutionary characteristics of mining stress near the hard-thick overburden normal faults. J Min Saf Eng. 31(06):881–887. doi:10.13545/j.issn1673-3363.2014.06.009.
- Khan M, He XQ, Farid A, Song DZ, Li ZL, Tian XH, Ni MQ. 2021. A novel geophysical method for fractures mapping and risk zones identification in a coalmine, Northeast, China. Energy Rep. 7:3785–3804. doi:10.1016/j.egyr.2021.06.071.
- Khan M, He XQ, Song DZ, Tian XH, Li ZL, Xue YR, Aslam KS. 2022. Extracting and predicting rock mechanical behavior based on microseismic spatio‑temporal response in an ultra‑thick coal Seam Mine. Rock Mech Rock Eng. 56(5):3725–3754. doi:10.1007/s00603-023-03247-w.
- Khan M, Xueqiu H, Farid A, Jianqiang C, Honglei W, Dazhao S, Chao Z. 2022. Geophysical characterization of mining-induced complex geological deformations in a deep coalmine. Lithosphere. 2021(Special 4):7564984. doi:10.2113/2022/7564984.
- Khan M, He XQ, Guo J, Song DZ. 2024. Accurate prediction of indicators for engineering failures in complex mining environments. Eng Fail Anal. 155:107736. doi:10.1016/j.engfailanal.2023.107736.
- Li J, Zhang RG, Yu Y, Yu JD, Xie PS, Lang D. 2023. Risk assessment of roof fault activation induced by mining stress deflection in mining roadway. Chin J Rock Mech Eng. 42(supp.2):4109–4120. doi:10.13722/j.cnki.jrme.2022.1135.
- Pan YS, Dai LP. 2021. Theoretical formula of rock burst in coal mines. J China Coal Soc. 46(03):789–799. doi:10.13225/j.cnki.jccs.yt20.1946.
- Sainoki A, Mitri HS. 2016. Effect of fault-slip source mechanism on seismic source parameters. Arab J Geosci. 9(1):1–12. doi:10.1007/s12517-015-2027-9.
- Sjöberg J, Perman F, Quinteiro C, Malmgren L, Dahnér-Lindkvist C, Boskovic M. 2012. Numerical analysis of alternative mining sequences to minimise potential for fault slip rockbursting. Min Technol. 121(4):226–235. doi:10.1179/1743286312Y.0000000016.
- Tan YL, Ma Q, Liu XL, Liu XS, Elsworth D, Qian RP, Shang JL. 2023. Study on the disaster caused by the linkage failure of the residual coal pillar and rock stratum during multiple coal seam mining: mechanism of progressive and dynamic failure. Int J Coal Sci Technol. 10(1):45. doi:10.1007/s40789-023-00603-7.
- Wang HW, Wang G, Zhang Y, Cui S, Xu J. 2019. Stress field and energy field distribution characteristics of faults under dynamic pressure. Coal Sci Technol. 47(10):183–189. doi:10.13199/j.cnki.cst.2019.10.024.
- Wang HW, Tian Z, Wang Q, Liu WG, Jiang YD, Shi RM. 2023. Investigation on the mutation effect induced by the coupled destabilization of fault and overburden rock strata during coal mining. J China Coal Soc. 48(8):2961–2975. doi:10.13225/j.cnki.jccs.2022.1158.
- Wu YP, Xie P S, Yun DF, Wang HW, Luo SH, Gao XC, Lang D, Hu BS, Yan ZZ, Wang T. 2023. Gravity-dip effect and strata control in mining of the steeply dipping coal seam. J China Coal Soc. 48(1): 100–113. doi: 10.13225/j.cnki.jccs.2022.0648.
- Wu YP, Yun DF, Xie PS, Wang HW, Lang D, Hu BS. 2020. Progress, practice and scientific issues in steeply dipping coal seams fully-mechanized mining. J China Coal Soc. 45(01):24–34. doi:10.13225/j.cnki.jccs.YG19.0494.
- Wu YP, Yun DF, Xie PS, Wang HW, Luo SH. 2017. Theory and technology of fully mechanized longwall mining in steeply inclined seam. Beijing: Science Press.
- Wu YP, Zeng YF, Xie PS. 2012. Analysis of unstable failure of soft rock roadway in steep coal seam during repeat mining. Xi’An Univ Sci Technol. 32(04):403–408 + 414. doi:10.13800/j.cnki.xakjdxxb.2012.04.011.
- Zhang B, Cao SG, Wang LG, Lu YL. 2011. Deformation failure mechanism and support measurements in roadway of steeply inclined coal seam. J Min Saf Eng. 28(02):214–219.
- Zhang JP, Liu LM, Liu CX, Zhao YP, Sun DL, Shao J. 2021. Cross-section shape and coupling support of deep and large inclined coal and rock roadway. J Central S Univ (Sci Technol). 52(11):4074–4087. doi:10.11817/j.issn.1672-7207.2021.11.028.
- Zhang KX, He MC, Jiang YD. 2017. Mechanism research of roadway pressure bump induced by fault slip and activation. Coal Sci Technol. 45(02):12–20 + 64. doi:10.13199/j.cnki.cst.2017.02.003.
- Zhang NB, Zhao SK, Deng ZG, Li HT, Wang Y, Qin K. 2019. Mechanical instability mechanism of thrust fault under static and dynamic loading. J Min Saf Eng. 36(06):1186–1192. doi:10.13545/j.cnki.jmse.2019.06.015.
- Zhao YX, Lu GZ, Zhu GP, Jiao ZH, Wang H, Gao N. 2018. Fault reactive induced by the principal stress rotation for the underground coal mining. J China Univ Min Technol. 47(1):73–80. doi:10.13247/j.cnki.jcumt.000794.
- Zhao YX, Wang H, Jiao ZH, Lu ZG, Zhang X. 2018. Experimental study of the activities of reverse fault induced by footwall coal mining. J China Coal Soc. 43(04):914–922. doi:10.13225/j.cnki.jccs.2017.0595.
- Zuo JP, Chen ZH, Wang HW. 2009. Experimental investigation on fault activation pattern under deep mining. J China Coal Soc. 34(03):305–309. doi:10.13225/j.cnki.jccs.2009.03.006.