
Abstract
Climate changes in increasing at alarming rates which caused outward changes in the hydrological cycle parameters such as temperature and precipitation. The spatial and temporal distribution of rainfall has changed all over the world. Rainfall forecasting is considered an important tool that could help decisionmakers for managing water resources. Syria is facing several drought events that may affect its water resources. Due to the lack of available rainfall data from land stations in Syria after the civil war started in 2010 till now, one of the aims of this study is to depend on rainfall data from satellite images after correcting these data using the available land stations data. This study also aims to assess rainfall trends in Syria due to climate change and forecasting rainfall. The rainfall data were collected from 71 land stations from 1991 to 2009. Satellite images from Climate Data Record (CDR) were downloaded from 1983 to 2020 and ArcMap was used to extract rainfall data at locations of land stations. The extracted rainfall data from satellite images were corrected by land stations data from 1991 to 2009. Then Statistical Package for the Social Sciences (SPSS) program with Auto-Regressive Integrated Moving Average (ARIMA) models are used to fit and forecasting rainfall in Syria. The rainfall trends at the studied stations were analyzed for 40 years (1983–2022) and a forecast of one year is conducted. The results showed decreasing trends at all the stations that lead to a decrease the quantity of water received every year which could affect the water resources in Syria and agriculture and food security will be also affected. The results are consistent with Intergovernmental Panel on Climate Change (IPCC) reports that concluded a decrease in rainfall at southern and eastern Mediterranean regions. The results of the current study could help in the management of water resources in Syria and forecasting using ARIMA is recommended for rainfall predictions.
1. Introduction
Climate change refers to variations in weather conditions on the long-term due to changes in biotic processes, variations in the amount of solar energy that Earth receives, plate tectonics, and volcanic eruptions. Climate change has affected the natural and human systems on all continents and across the oceans (IPCC Citation2014). Global warming is predicted to have significant, long-lasting effects on the Earth. Human activities such as burning fossil fuels has resulted in increasing the concentration of greenhouse gases that could increase the warming of the planet’s surface, oceans, and atmosphere. The higher increase in the climate change is expected due to the continuous increase in global warming (IPCC. Citation2021). 80% of this increase can be attributed to the rise in carbon dioxide emissions. Other factors contributing to global warming include power plants, transportation, agriculture, deforestation, fertilizers, oil drilling, naturally quick drilling, permafrost, waste, and volcanic eruption (Kelly Citation2019).
The average global surface temperature will rise from 2.6 °C to 4.8 °C, over the course of the next 100 years, according to RCP 8.5 (high emission scenario), and from 0.3 °C to 1.7 °C under RCP 2.6 (low emission scenario). As a result, the forecasts and measures indicated that the average global surface temperature will undoubtedly rise in the future (IPCC. Citation2021). The characteristics of the hydrologic cycle may be directly impacted by rising the temperature. As a result of climate change, the earth’s temperature, wind, and precipitation patterns may change. Consequently, climate change may have an impact on hydrological regimes and increase the likelihood of extreme hydrological events like drought and flooding in the future.
Despite rising global temperature trends, changes in precipitation will not be consistent (Whitehead et al. Citation2009). Previous research’s results revealed that the equatorial Pacific and some high-latitude regions might experience an increase in annual precipitation. However, in many mid-latitude, dry regions and some mid-latitude subtropical dry regions, precipitation is predicted to decline. As a result, there is still a chance that extreme precipitation events will increase in intensity and frequency throughout most of the mid-latitude land masses and wet tropical regions (Adam and Lettenmaier Citation2003). The effects of precipitation are anticipated to be extensive on hydrological regimes, such as hydraulic characteristics, flow rate, water level, inundation pattern, and water cycles. Also, the likelihood of hydrological extremes like drought and flooding occurrences will rise (Adam and Lettenmaier Citation2003).
Most the world’s arid regions are impacted by climate change, and numerous countries will experience water shortage problems. Water scarcity is a problem in the Middle Eastern and climate change with the rapid population growth may increase the possibility of drought and conflicts over water. This deficiency results from both socioeconomic and climate change. Syria is an example of a Middle Eastern country that suffer from water shortage. Syria is located in hyper aridic, semi-aridic, and arid regions. The area is categorized by rapidly population growth rates, which over the past few decades has caused a steep drop in the annual per capita share.
Few studies have been done for the integrated management of water resources in Syria. The long-term management of water in Hawran, southern Syria, was examined by Braemer et al. (Citation2009). The management and development of the Euphrates and Tigris basins were investigated by Altõnbilek (Citation2004). The hydrological and watershed parameters of the El-Kabir River that located between Syria and Lebanon were evaluated by Shaaban (Citation2009). In the Barada and Awaj basins, Kattan (Citation1997) evaluated the hydrological and environmental features of surface and groundwater. Salameh and Fallah (Citation2018) analyzed the changes in the annual and seasonal averages of air temperature and precipitation over the Lattakia Governorate during the period 1970–2016. The results revealed that the annual temperature averages significantly increased, and precipitation significantly decreased.
Analysis of spatial and temporal variability of rainfall trends in Syria from 1991 to 2009, based on land station data was done by Zeleňáková et al. (Citation2022). The results showed that rainfall has decreased in the studied period (1991–2009). Abd‐Elhamid et al. (Citation2024) used standardized precipitation index (SPI) for drought and flood analysis in Syria based on satellite images for monthly precipitation from 1983 to 2020. The results showed extreme flood events in 1988, 2002, 2012, and 2019 and extreme drought events in 1990, 2014, and 2016. The results demonstrated that SPI is a useful tool to predict the time of occurrence of both flood and drought.
Rainfall trend analysis is a subject of interest and several studies have been conducted in different regions using different methods. Haylock et al. (Citation2006) used the daily rainfall data to determine the changes in rainfall from 1960 to 2000 in the region of southern Brazil, Paraguay, Uruguay, and northern and central Argentina. The decline in rainfall was observed in the studied regions. The daily data from Southeast Asian countries from 1950 to 2000 were used by Endo et al. (Citation2009) to investigate precipitation trends. The results revealed that stations with increasing trend are more than stations with decreasing trend. The spatial variability of rainfall trends for the period (1989–2019) was presented as an indication of climate change in Sri Lanka by Alahacoon and Edirisinghe (Citation2021). The results showed a substantial increase in rainfall trends at all climatic zones from 1989 to 2019. Moreover, Sabattini and Rafael (Citation2021) used daily precipitation data to evaluate the long-term changes in the rainfall trends between 1945 and 2019 in the central north region of Entre Ríos. Alahacoon et al. (Citation2021) used rainfall data from 1983 to 2020 to investigate the rainfall variability and trends in the African continent.
Rainfall forecasting is one of the major problems facing decisionmakers in water resources management. Management of water resources at the regional scale that has consequences for agriculture, climate change, and natural disasters like floods and droughts, requires an accurate analysis and forecasting of rainfall. Natural phenomena are extremely challenging to predict because of random patterns and seasonal characteristics. A variety of techniques have been used for rainfall forecasting including liners and non-liners methods. One of the models that have been used by a number of researchers for drought and precipitation forecasting is the Auto-Regressive Integrated Moving Average (ARIMA) that was used to fit and forecasting rainfall data. The advantages and disadvantages of ARIMA and the regression model with seasonal latent variable in predicting precipitation demand were discussed by Wang et al. (Citation2013). They revealed that the seasonal ARIMA model has a high degree of model fitting when it comes to irrigation decisions for agriculture. ARIMA is one of the most time series models that has been widely used to calculate monthly time series data formed by inter annual variations of monthly data or inter-monthly variation (Wang et al. Citation2014).
Over the years, ARIMA has been used by a number of researchers for forecasting draught and rainfall. Zakaria et al. (Citation2012) used ARIMA for weekly rainfall data from four rainfall stations in the northwest of Iraq for the period 1990–2011 then ARIMA was used for forecasting the weekly rainfall data for the upcoming years (2012–2016). The study revealed that the ARIMA model is an appropriate tool for rainfall forecasting in semi-arid region like Iraq. Mossad and Alazba (Citation2015) applied ARIMA for drought forecasting in Al-Qassim and Hail regions in the kingdom of Saudi Arabia and indicated that all the developed ARIMA models showed potential capability to forecast drought across a range of time scales. Bari et al. (Citation2015) applied a seasonal ARIMA model to forecast long term rainfall at Sylhet in Bangladesh based on rainfall data from 1980 to 2010. They used rainfall data from 1980 to 2006 to develop the model while data from 2007 to 2010 were used to verify the prediction. Likewise, Khan et al. (Citation2018) used the seasonal SARIMA model for rainfall forecasting in Bangladesh as an example of a semi-tropical country.
ARIMA was also used for forecasting drought in the Bundelkhand region (India) for the period (1989–2018) by Iksha (Citation2019). Islam and Imteaz (Citation2020) used the ARIMAX Model for seasonal rainfall prediction in Western Australian. They concluded that ARIMAX could help to overcome the difficulty in seasonal rainfall prediction. Tadesse and Dink (Citation2022) used seasonal SARIMA for forecasting monthly rainfall for the Turksvygbult station at the Magoebaskloof Dam in South Africa. They concluded that ARIMA forecasting procedure can be used for forecasting rainfall and other time series in different areas. Gowri et al. (Citation2022) applied ARIMA for rainfall forecasting at Thanjavur in South India based on 17 years of historical rainfall data from 2000 to 2016.
ARIMA was applied to predict drought based on SPI in southern Taiwan by Yeh and Hsu (Citation2019). They used data from 1967 to 2006 for model training and data from 2007 to 2017 for model validation. They concluded that ARIMA is an effective and adequate tool for drought forecasting. Then they applied ARIMA to forecast SPI for drought analysis from 2019 to 2022. Al Balasmeh et al. (Citation2019) used daily precipitation data from five stations to find the trend and forecasting precipitation for the area of the Wadi Shueib catchment in Jordan. ARIMA was used to forecast precipitation for 10 years till 2026 based on data from 2007 to 2016. El-Dakak et al. (Citation2021) used ARIMA to fit and forecasting SPI data with application to land stations in Ethiopia.
Over the years, satellite precipitation data have been used for analysis of floods and drought. Hinge et al. (Citation2022) presented an overview of using satellite precipitation data for simulation and prediction of flood. The result showed that the accuracy of the prediction depends on different factors including the effect of climate zone, topographical features, used hydrological models, and calibration. Satellite precipitation data offer great potential for flood simulation and prediction, but the performance needs to be enhanced after accurate model recalibration. Dehaghani et al. (Citation2023) evaluate the accuracy of satellite precipitation products over different return periods and performance in different climates and altitudes. They evaluated three satellite precipitation products, including PERSIANN-CCS and TRMM-3B42RT (near real-time satellites) and CMOROH (post real-time satellite), on hourly, daily, monthly, and annual time scales in 52 synoptic stations over Iran. The results showed that IDF curves derived from the CMORPH satellite gave the highest accuracy compared to synoptic stations. The TRMM and CMORPH underestimated precipitation by 56% and 8%, respectively, while PERSIANN-CCS overestimated precipitation by 143%.
Water resources management in Syria have only received a little amount of research (Mourad and Berndtsson Citation2012). Additionally, the impact of climate change on water resources was not taken into account in the earlier research. Another main problem is how climate change may affect Syria’s rainfall distribution and intensity in Syria. Rainfall is a crucial meteorological element that must be precisely observed and assessed. Due to the lack of available rainfall data from land stations in Syria after the year 2010 where the civil war has started. One of the aims of this study is to rely on rainfall data from satellite images after correcting these data using the available rainfall data from land stations. The main aims of the study are to evaluate rainfall changes in Syria in response to expected climate change. Also, forecasting rainfall is included to assess the impact of climate change on rainfall variability in the future. The available data were collected at 71 land stations from the Agrarian Reform and Meteorological Centre in Syria for the period (1991–2009). Remote sensing (RS) and geographic information system (ArcMap GIS 10.8) are used to get rainfall data for longer period. Satellite images were collected from 1983 to 2020 in Syria then corrected with the land station data. The corrected data for 38 years (1983–2020) are used as base data for forecasting rainfall using Statistical Package for the Social Sciences (SPSS) with the ARIMA method.
2. Materials and methods
2.1. Study area
Syria is located on the eastern of the Mediterranean Sea coast in southwestern Asia and north of the Arabian Peninsula between longitudes (35°43′–42°25′ E) and latitudes (32°19′–37°20′ N). The total area of Syria is 185,180 km2 and inhabitants is 21.13 million. It is bordered by Turkey from the north, Jordan from the south, Iraq from the east, Lebanon, and the Mediterranean Sea from the west (see ).
Figure 1. Location map of Syria.
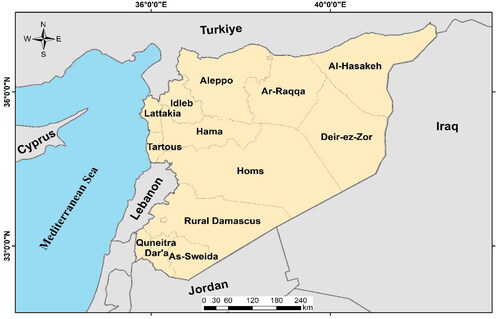
The climate is mostly desert; it has hot, dry, sunny summers from June to August and mild, rainy winters from December to February along the coast. Syria is divided into a coastal zone with a narrow belt on the west, a double mountain belt enclosing a depression in the west and a much larger eastern plateau (Nations Online Countries of the World Citation2021). Syria has five agroecological zones depending on rainfall intensity, humid zones in the west, arid and semi-arid zones in the east, north and south and more than 70% of the country is classified as Arid zones.
Rainfall and rivers are the main water source in Syria which is ever more affected by climate change. Water management has a significant impact on agriculture. Agriculture is considered the largest consumer of water and urban development along the coast and tourism are increasing the demand for water. There is a big seasonal variation in water availability due to changes in rainfall as the main rainfall occurring in the winter from December to March and no rain during the summer from June to September. The climate in Syria is predominantly dry, about three-fifths of the country has less than 250 mm of rain per year which makes the country suffering from water shortage. Most of the rainfall occurs by winds from the Mediterranean between November and May. The annual mean temperature ranges from 7 °C to 27 °C (Almazroui (Citation2011) and Almazroui et al. (Citation2012). The potential evaporation rate is high and reaches to 1300 mm/year in the western parts and 3000 mm/year in the eastern and south-eastern parts of Syria. The rainfall is rare and highly variable from year to year which causing periodic droughts. The averages precipitation is 250 mm per year but falls below 200 mm in a large belt along the southern desert area (Alkolibi Citation2002).
2.2. Data set
Data from 71 land stations in Syria were obtained from Aleppo University in Syria with collaboration of the Ministry of Agriculture and Agrarian Reform and Meteorological Centre for the period (1991–2009). This study analyzed the data from 71 stations spread over Syria (see ). The annual rainfall at the 71 stations for the period (1991–2009) is shown in . The maximum annual rainfall is 1200 mm, and the minimum is 100 mm.
Figure 2. Annual rainfall and location of rainfall stations in Syria.
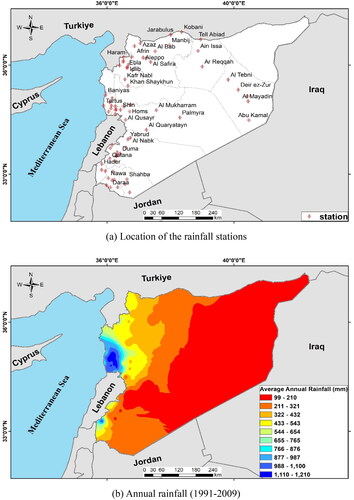
The highest rainfall during the period (1991–2009) was recorded in the eastern part on the Mediterranean coast. The stations in Tartous Governorate recorded the highest values of rainfall. This governate has been selected in this study for analysis of rainfall trends and forecasting of rainfall. The annual rainfall and location of six land stations in the Tartous governorate are presented in . The location of the selected rainfall stations is shown in . The spatial distribution of annual rainfall (1991–2009) in the Tartous governorate is shown in .
Figure 3. Location and annual rainfall at land stations in Tartous governorate.
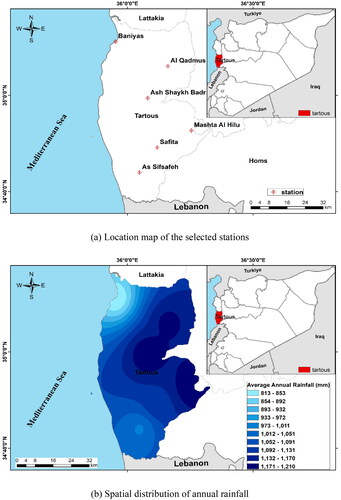
Table 1. Data of land stations in Tartous Governorate, Syria.
2.3. Methodology
SPSS and ARIMA are used for forecasting the monthly rainfall at the chosen stations based on the corrected rainfall data extracted from satellite images using GIS. shows a flow chart of the methodology, and the steps are described in detail as following:
Figure 4. Flow chart of methodology used for rainfall forecasting using ARIMA models.
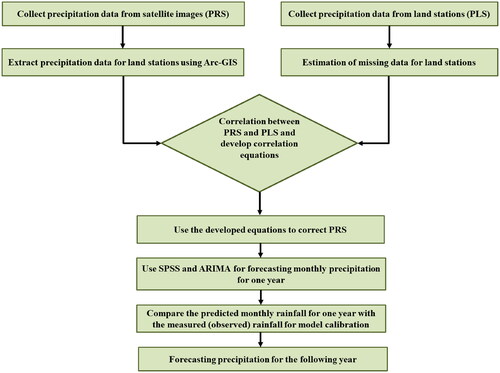
Monthly precipitation data were collected from precipitation land stations (PLS) from the Ministry of Agriculture and Agrarian Reform and Meteorological Centre for 19 years (1991–2009).
Any missing data were estimated through the calculation of the mean precipitation for the same month at all the stations.
Satellite image for monthly precipitation from remote sensing (PRS) from October 1983 to September 2020 were collected (38 years) from the Centre for Hydrometeorology and Remote Sensing (CHRS) using the Precipitation Estimation from Remotely Sensed Information using Artificial Neural Networks (PERSIANN) - Climate Data Record (CDR) (version 5) product that is available to the public as an operational climate data record via NOAA National Climatic Data (NCDC) and NOAA Center Climate Data Records (CDR) program website under the Atmospheric CDRs category.
The precipitation data were extracted from satellite images (PRS) using ArcMap (version 8) for all the stations for 38 years.
The precipitation data obtained from the satellite image (PRS) were corrected by the precipitation data from land stations (PLS) for the period (1991–2009) and a correlation equation was developed for all the stations.
The developed equations at all stations were used to correct the precipitation data obtained from satellite image for (38) years.
Rainfall data for the period (October 1983 up to September 2020) is used as base data for SPSS and ARIMA to predict monthly rainfall for one year (October 2020 to September 2021).
The predicted monthly rainfall for one year (October 2020 to September 2021) is compared with the measured (observed) rainfall for the same period for model calibration.
Monthly rainfall is predicted using ARIMA for the upcoming year (October 2021 to September 2022).
Step 8 and 9 can be repeated for upcoming years which enables to have a prediction of one year after verification of one year data.
3. Results
The available rainfall data form land stations were collected for the period 1991 to 2009 but after 2010 the data are not available due to the war started in Syria. To overcome the shortage of data, monthly precipitation data were collected from remote sensing through satellite images for 38 years from 1983 to 2020. RS data were corrected by the land station data from 1991 to 2009 then used by SPSS and ARIMA models to forecasting rainfall at six stations in Tartous Governorate for one year for validation and then forecasting the upcoming year.
3.1. Correction of RS data using land stations data for the period (1991–2009)
Available rainfall data form land stations were collected for the period (1991–2009) and monthly precipitation data from satellite images were collected for the period (1983–2020). shows an example of a satellite image for precipitation in January 2020 downloaded from CDR. The satellite images data need correction by field dat. The correction was done between the land stations data and remote sensing data for the period 1991 to 2009 and a correlation equation was developed for each station. shows an example of the developed correlation equations at Ash Shaykh Badr station. Then the developed equation is used to correct the monthly remote sensing data for the period (1983–2020) (38 years).
Figure 5. Satellite image for precipitation in January 2020 in Syria.
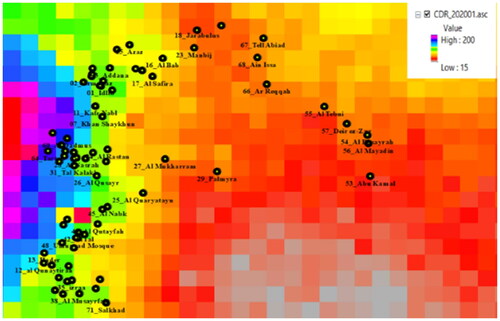
Figure 6. Correlation between RS data and land station data at ash Shaykh Badr station (1991–2009).
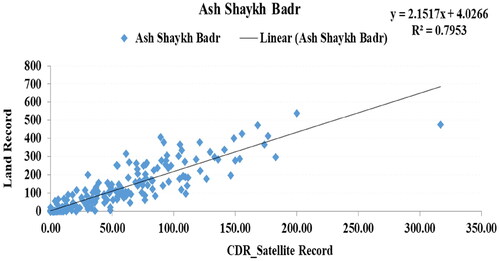
The root mean square (R2) has been calculated for all stations and stations of low (R2) have been excluded from the study. The stations with the highest root mean square (R2) have been selected for hydrological analysis. shows the selected stations, where the least root mean square (R2) is 0.75. Also, a linear equation was developed for each station that was used to correlate RS data at different times. The location of the selected stations is shown in . All stations are in the western part of Syria on the Mediterranean coast in Tartous Governorate. The recorded annual precipitation is high at this area and ranged between 813 and 1210 mm (). The precipitation at the selected stations is collected, corrected, and analyzed from 1983 to 2020 and then used to forecast for the years 2021 and 2022.
Table 2. Correlation equation and R2 at main stations in Tartous Governorate, Syria.
3.2. Rainfall forecasting in Tartous Governorate
For forecasting rainfall in the Tartous Governorate, six stations have been selected on the Mediterranean coasts in the Tartous Governorate. The corrected monthly rainfall (mm/month) for 38 years for the period (October 1983 to September 2020) were used as base data in SPSS and ARIMA for forecasting monthly precipitation for one year. The forecasting by ARIMA was done using two methods, forecasting one year (monthly) and forecasting one year from October 2020 to September 2021. In order to examine the predicted data, the available satellite images from October 2020 to September 2021 were downloaded and corrected using the developed correction equation for each station. Then the predicted year is compared with the corrected data from October 2020 to September 2021 for model validation. After the model is validated with observed data for one year, it is used to predict the rainfall for the upcoming year from October 2021 to September 2022.
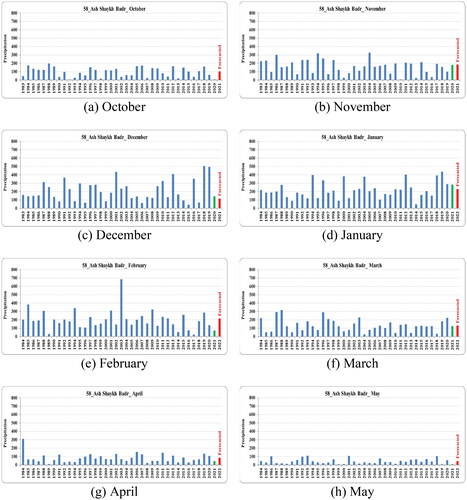
The results of one station (Ash Shaykh Badr) are presented in this section to show the monthly forecast of precipitation using SPSS and ARIMA models. However, the same steps were done for all stations. shows the predicted monthly precipitation for one year (October 2020 to September 2021) in green color and the forecasted monthly precipitation for one year (October 2021–September 2022) in red color. The results of precipitation are presented for 8 months (October to June) because there is no rain during the summer months (June, July, August, and September). The results show a variation of precipitation in the months, but the results reveal that decreasing trends are occurring in precipitation at all the stations.
Figure 7. Forecast of monthly precipitation at Ash Shaykh Badr station (2021–2022).
The analysis of results at the six stations is explained in detail in the following subsections. The analysis includes rainfall forecasting for one year from October 2020 to September 2021 for model validation. SPSS and ARIMA will use data from October 1983 to September 2020 for forecasting. The predicted results will be compared with the observed data for validation. Then the models will be used to predict the precipitation for the upcoming year from October 2021 to September 2022. The results of the six stations in Tartous Governorate are shown in .
Figure 8. Forecast and validation of rainfall at Ash Shaykh Badr station.
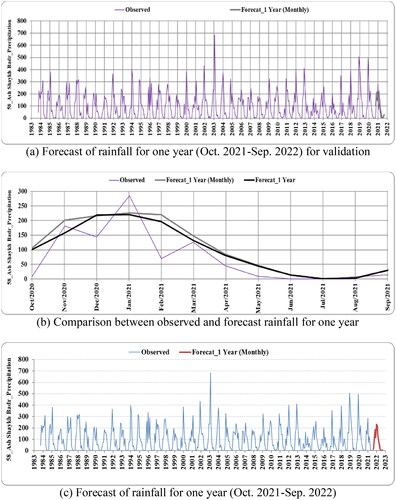
Figure 9. Forecast and validation of rainfall at as Sifsafeh station.
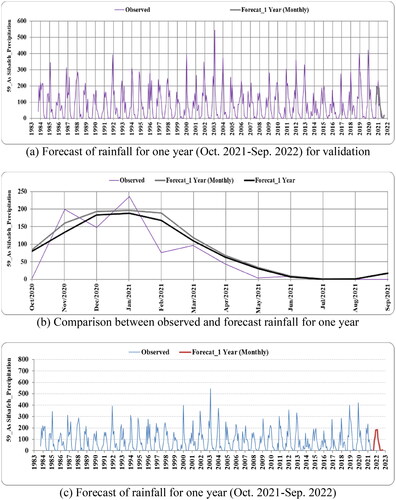
Figure 10. Forecast and validation of rainfall at Al-Qadmus station.

Figure 11. Forecast and validation of rainfall at baniyas station.
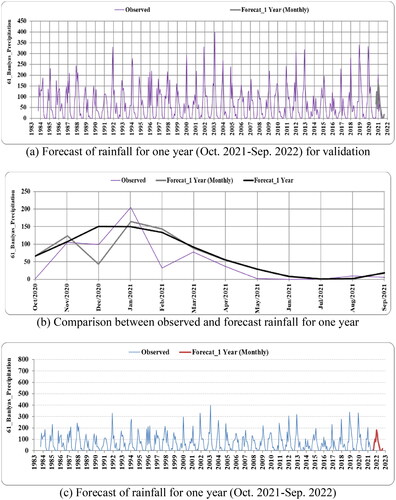
Figure 12. Forecast and validation of rainfall at Safita station.
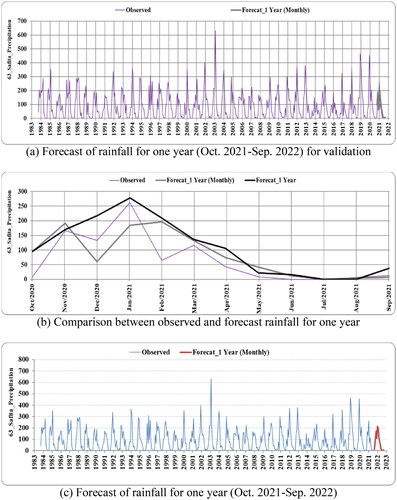
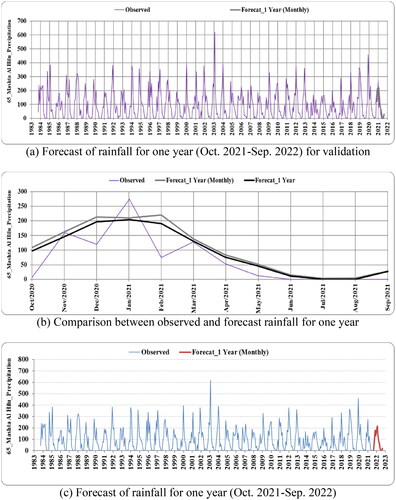
Figure 13. Forecast and validation of rainfall at Mashta Al Hilu station.
3.2.1. Rainfall forecasting at Ash Shaykh Badr station
The forecast one year from October 2020 to September 2021 at Ash Shaykh Badr station is shown in . Moreover, shows the comparison between the observed data with the forecast one year (monthly) and the forecast one year for the same period. The comparison shows good agreement between the two methods of forecasting compared with the observed data. shows the predicted precipitation at Ash Shaykh Badr station from October 2021 to September 2022. The result reveal that the precipitation has decreased in the predicted year (2022) than in the previous years which also indicated decrease in precipitation. At Ash Shaykh Badr station, the highest precipitation (700 mm) was recorded in 2003. The precipitation in 2019 and 2020 was about 500 mm and decreased to 290 and 225 mm in 2021 and 2022, respectively.
3.2.2. Rainfall forecasting at Sifsafeh station
At Sifsafeh station the forecast one year from October 2020 to September 2021is shown in with the base data from October 1983 to September 2020. A comparison between the observed data for the same period with the forecast one year (monthly) and forecast one year is shown in . From it can be noticed that the results of the forecast using the two methods are very close to the observed data. The predicted precipitation for one year (Monthly) in the period October 2021 to September 2022 is shown in . The highest precipitation was recorded in 2003, about 550 mm. The precipitation in 2019 and 2020 was about 400 mm and decreased to 220 and 190 mm in 2021 and 2022, respectively. The result reveal that the precipitation has decreased in the predicted year (2022).
3.2.3. Rainfall forecasting at Al Qadmus station
shows the forecast for one year from October 1983 to September 2020 at Al Qadmus station. A comparison between the observed data for the period from October 1983 to September 2020 with the forecast one year (monthly) and forecast one year is shown in , which shows good agreement between the observed and forecasted data. The predicted precipitation for one year (Monthly) in the period October 2021 to September 2022 is shown in . The result reveal that the precipitation has decreased in the predicted year (2022) as shown in . In 2003 the highest precipitation was recorded of about 600 mm. The precipitation in 2020 was about 500 mm and decreased to 300 in 2021 and 200 mm in 2022.
3.2.4. Rainfall forecasting at Baniyas station
At Baniyas station the base data from October 1983 to September 2020 with the forecast one year from October 2020 to September 2021 is shown and a comparison between the observed data with the forecast one year (monthly) and forecast one year is shown in . However, shows the predicted precipitation for one year (Monthly) in the period October 2021 to September 2022. Baniyas station has less precipitation values in the studied period compared with other station. The highest precipitation (400 mm) was recorded in 2003. The precipitation has decreased in 2019 and 2020 to about 325 mm and decreased to 200 mm in 2021 and 2022. The result reveal that the precipitation has decreased in the predicted year (2022).
3.2.5. Rainfall forecasting at Safita station
The results of forecast one year (October 2020–September 2021) at Safita station is shown in with the base data from October 1983 to September 2020. shows comparison between the observed data for the same period with the forecast one year (monthly) and forecast one year. reveal that the results of the forecast using the two methods are very close to the observed data. Moreover, shows the predicted precipitation at Safita station for the period October 2021 to September 2022. The results show that the precipitation has decreased in the predicted year (2022) than in the previous year. At Safita station, the highest precipitation was recorded in 2003, about 620 mm. The precipitation in 2019 and 2020 was about 450 mm and decreased to 250 and 210 mm in 2021 and 2022, respectively.
3.2.6. Rainfall forecasting at Mashta Al Hilu station
The forecast one year from October 2020 to September 2021 at Mashta Al Hilu station is shown in . shows comparison between the observed data with the forecast one year (monthly) and forecast one year for the same period. The comparison shows high agreement between the two methods of forecasting compared with the observed data. The predicted precipitation for one year (Monthly) in the period October 2021 to September 2022 is shown in . The highest precipitation was recorded in 2003, about 615 mm. The precipitation in 220 was about 450 mm and decreased to 270 and 210 mm in 2021 and 2022, respectively. The result reveal that the precipitation has decreased in the predicted year (2022).
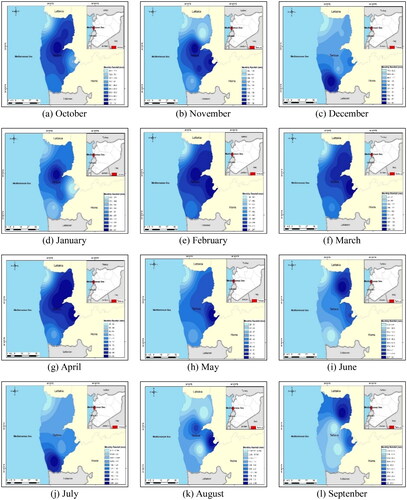
3.3. Spatial distribution of forecast monthly rainfall at Tartous Governorate
The spatial distribution of monthly rainfall at Tartous Governorate for 12 months (October 2021–September 2022 is shown in . The results reveal that this area receives very small rainfall in the summer months (June, July, August) and September as well. However, the highest rainfall was recorded in the Winter months (December, January, and February).
Figure 14. Spatial distribution of rainfall in Tartous governate (October 2021–September 2022).
3.4. Rainfall trend analysis in Tartous Governate for 40 years for the period (1983–2022)
The historical data from (1983–2020) with the predicted data (2021, 2022) are used to analyze the data and get the precipitation trends at the six major stations in Tartous Governate. The results of the precipitation trend for 40 years from 1983 to 2022 are shown in . In the two predicted years (2021 and 2022), the decreasing trend of rainfall is observed at all stations. Also, the general rainfall trend at the studied stations reveals decreasing trends at all the stations. For each station an equation is developed to show the rainfall trends that can be used to predict the rainfall at any year based on the data base for 40 years.
Figure 15. Rainfall trends at the six major stations in Tartous for the period (1983–2022).
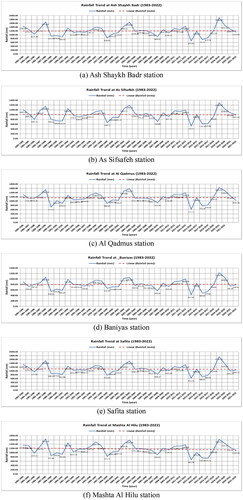
The results of precipitation trend analysis for 40 years from 1983 to 2022, showed that decreasing trend is observed at all stations. This means decreasing the quantity of water received every year which could affect the water resources in Syria and agriculture and food security will be also affected. This could be considered carefully in water resources management planning.
4. Discussion
SPSS with ARIMA models were used to forecast the rainfall at the six major stations in Tartous Governate based on the corrected data for 38 years that collected from RS (October 1983 to September 2020). The models were used to predict one year (October 2020–September 2021) for model validation then used to forecast rainfall for the following year (October 2021–September 2022). The rainfall trends at the six stations were analyzed for 40 years (1983–2022). The rainfall trends showed decreasing trends at all the stations which is consistent with other studies that has have been carried out in Syria such as Salameh and Fallah (Citation2018) who used the data from 1970 to 2016 at Lattakia Governorate in Syria to analyze changes in annual temperature and rainfall. They revealed that the annual temperature significantly increased, and precipitation significantly declined.
Standardized precipitation index (SPI) was used for drought analysis in Syria based on satellite images for the period 1983 to 2020. The results showed extreme drought events in 1990, 2014, and 2016 (Abd‐Elhamid et al. Citation2024). The highest severity and intensity of drought were recorded in 2014 and 2016 respectively. Satellite images could help be a useful source of data for drought analysis. The study revealed that a number of drought events have occurred in Syria and predicted to increase in the upcoming years due to climate change.
The Mediterranean region is more vulnerable to climate change due to its current water shortage and high population growth rate (Al-Qinna et al. Citation2011; Lelieveld et al. Citation2012; Terink et al. Citation2013). Over the twenty first century, the rate of warming in the southern and eastern Mediterranean will be higher than the global average warming, and annual precipitation will almost certainly decline (IPCC Citation2007; IPCC Citation2013; IPCC Citation2021). Additionally, there is a serious water deficit in the southern and eastern Mediterranean regions (Simonet Citation2011). Through the second half of the twentieth century, the Mediterranean witnessed a declining trend in precipitation (Xoplaki et al. Citation2004), this tendency is anticipated to continue, with a reduction in total annual rainfall of up to 20% by the year 2050 (Black Citation2009). Finally, the results of the current study reveal that a decline in rainfall is expected in this area, which is consistent with other studies, but forecasting is vital for future predictions that could help in managing such changes.
5. Conclusion
The recent increase in global warming caused by increasing greenhouse gas emissions has affected the hydrologic cycle’s parameters, particularly precipitation patterns that could increase the likelihood of floods and droughts around the world. Arid regions are among the hardest hit by climate change. Syria as a Middle East country is exposed to extreme climate events such as drought that may affect the available water resources. Changes in rainfall pattern should be assessed carefully and forecasting methods should be used to help decision makers for putting water resources management plans. This study analysed the rainfall trends in Syria due to the likely climate change. Available rainfall data were collected from 71 land stations for 19 years from 1991 to 2009 but after the civil war started in 2010, there is a lack of data from land stations. Therefore, this study relies on rainfall data from satellite images. Satellite images from (CDR) were downloaded for 38 years (1983–2020). Rainfall data at land station locations was extracted from satellite images using ArcMap. To correct the deviation in the satellite image data, the extracted rainfall data from satellite images were corrected using land stations data from 1991 to 2009. The SPSS program is then used to fit and forecast rainfall using ARIMA models. The analysis of rainfall trends revealed that:
Decreasing trends have been observed at all the stations which prove that Syria will be extremely affected by climate change and more droughts are probable to occur.
The reports released by IPCC concluded a decline in rainfall at the southern and eastern Mediterranean which is consistent with the results of the current study.
Rainfall forecasting is a critical parameter in water resource management and crucial in agriculture and could affect food security.
ARIMA model is an appropriate tool for rainfall forecasting in arid and semi-arid region.
The results of this research could help Syria to manage its water resources and adapt to climate change.
Acknowledgments
This work was supported by the Slovak Research and Development Agency under the Contract no. APVV-20-0281, and a project funded by the Ministry of Education of the Slovak Republic VEGA1/0308/20 ‘Mitigation of hydrological hazards, floods, and droughts by exploring extreme hydroclimatic phenomena in river basins’.
Disclosure statement
No potential conflict of interest was reported by the author(s).
References
- Abd‐Elhamid HF, Zeleňáková M, Soľáková T, Saleh OK, El‐Dakak AM. 2024. Monitoring flood and drought risks in arid and semi-arid regions using remote sensing data and standardized precipitation index: a case study of Syria. J Flood Risk Manag. 17(1):e12961. doi: 10.1111/jfr3.12961.
- Adam JC, Lettenmaier DP. 2003. Adjustment of global gridded precipitation for systematic bias. J Geophys Res. 108(D9):4257. doi: 10.1029/2002JD002499.
- Al Balasmeh O, Babbar R, Karmaker T. 2019. Trend analysis and ARIMA modeling for forecasting precipitation pattern in Wadi Shueib catchment area in Jordan. Arab J Geosci. 12(2):1–19. doi: 10.1007/s12517-018-4205-z.
- Alahacoon N, Edirisinghe M, Simwanda M, Perera E, Nyirenda VR, Ranagalage M. 2021. Rainfall variability and trends over the African continent using TAMSAT Data (1983–2020): towards climate change resilience and adaptation. Remote Sens. 14(1):96. doi: 10.3390/rs14010096.
- Alahacoon N, Edirisinghe M. 2021. Spatial variability of rainfall trends in Sri Lanka from 1989 to 2019 as an indication of climate change. IJGI. 10(2):84. doi: 10.3390/ijgi10020084.
- Alkolibi FM. 2002. Possible effects of global warming on agriculture and water resources in Saudi Arabia: impacts and responses. Climate Change. 54(1/2):225–245. doi: 10.1023/A:1015777403153.
- Almazroui M. 2011. Calibration of TRMM rainfall climatology over Saudi Arabia during 1998-2009. Atmos Res. 99:400–414.
- Almazroui M, Islam N, Jones P, Athar H, Rahman MA. 2012. Recent climate change in the Arabian Peninsula: seasonal rainfall and temperature climatology of Saudi Arabia for 1979–2009. Atmos Res. 111:29–45. doi: 10.1016/j.atmosres.2012.02.013.
- Al-Qinna MI, Hammouri NA, Obeidat M, Ahmad F. 2011. Drought analysis in Jordan under current and future climates. Clim Change. 106(3):421–440. doi: 10.1007/s10584-010-9954-y.
- Altõnbilek D. 2004. Development and management of the Euphrates-Tigris basin. Int J Water Resour Dev. 20(1):15–33.
- Bari SH, Rahman MT, Hussain MM, Ray S. 2015. Forecasting monthly precipitation in Sylhet City using ARIMA model. Civil Environ Res. 7(1):69–78.
- Black E. 2009. The impact of climate change on daily precipitation statistics in Jordan and Israel. Atmos Sci Lett. 10(3):192–200. doi: 10.1002/asl.233.
- Braemer F, Genequand D, Dumond M, C, Blanc PM, Dentzer JM, Gazagne D, Wech P. 2009. Long-term management of water in the Central Levant: the Hawran case (Syria). World Archaeol. 41(1):36–57. doi: 10.1080/00438240802666424.
- Dehaghani A, Gohari A, Zareian M, Haghighi A. 2023. A comprehensive evaluation of the satellite precipitation products across Iran. J Hydrol. 46(2023):101360.
- El-Dakak AM, O. K S, Elnikhely EA. 2021. Drought forecast using ARIMA model for the standardized precipitation index (SPI) and precipitation data. IJCIET. 12(1):63–79. doi: 10.34218/IJCIET.12.1.2021.005.
- Endo N, Matsumoto J, Lwin T. 2009. Trends in precipitation extremes over Southeast Asia. SOLA. 5:168–171. doi: 10.2151/sola.2009-043.
- Gowri L, Manjula KR, Sasireka K, Deepa D. 2022. Assessment of statistical models for rainfall forecasting using machine learning technique. J Soft Comput Civil Eng. 6(2):51–67.
- Haylock MR, Peterson TC, Alves LM, Ambrizzi T, Anunciação YMT, Baez J, Barros VR, Berlato MA, Bidegain M, Coronel G, et al. 2006. Trends in total and extreme South American rainfall in 1960-2000 and links with sea surface temperature. J. Clim. 19(8):1490–1512. doi: 10.1175/JCLI3695.1.
- Hinge G, Hamouda M, Long D, Mohamed M. 2022. Hydrologic utility of satellite precipitation products in flood prediction: a meta-data analysis and lessons learnt. J Hydrol. 612(2022):128103. doi: 10.1016/j.jhydrol.2022.128103.
- Iksha PKS. 2019. Forecast of drought in Bundelkhand region using the standardized precipitation index (SPI) and ARIMA model [M.Sc. thesis]. Sam Higginbottom University of Agriculture, Technology and Sciences.
- IPCC. 2007. Adaptation and vulnerability. Fourth assessment report: working group II report. Cambridg: Cambridge University Press.
- IPCC. 2013. Summary for policymakers. In: Stocker TF, Qin D, Plattner G-K, Tignor M, Allen SK, Boschung J, Nauels A, Xia Y, Bex V and Midgley P.M, editors. Climate change 2013: the Physical science basis. Contribution of Working Group I to the Fifth Assessment Report of the Intergovernmental Panel on Climate Change. Cambridge: Cambridge University Press.
- IPCC. 2014. AR5 climate change 2014: impacts, adaptation, and vulnerability. https://www.ipcc.ch/report/ar5/wg2/.
- IPCC. 2021. Climate change 2021: the physical science basis. Contribution of Working Group I to the Sixth Assessment Report of the Intergovernmental Panel on Climate Change. Cambridge, UK: Cambridge University Press. https://www.ipcc.ch/report/sixth-assessment-report-working-group-i/.
- Islam F, Imteaz MA. 2020. Use of teleconnections to predict Western Australian seasonal rainfall using ARIMAX model. Hydrology. 7(3):52. doi: 10.3390/hydrology7030052.
- Mourad KA, Berndtsson R. 2012. Water status in the Syrian Water Basins. OJMH. 02(01):15–20. doi: 10.4236/ojmh.2012.21003.
- Kattan Z. 1997. Environmental isotope study of the major karst springs in Damascus limestone aquifer systems: case of the Figeh and Barada springs. J Hydrol. 193(1–4):161–182. doi: 10.1016/S0022-1694(96)03137-X.
- Kelly J. 2019. The top 10 causes of global warming. sciencing.com. https://sciencing.com/the-top-10-causes-of-global-warming-12512484.html\
- Khan MS, Islam M, Adhikary S, Hossain MM, Afroja S. 2018. Analysis and predictions of seasonal affected weather variables of Bangladesh: SARIMA models vs. Traditional models. IJBM. 13(12):70–80. doi: 10.5539/ijbm.v13n12p70.
- Lelieveld J, Hadjinicolaou P, Kostopoulou E, Chenoweth J, El Maayar M, Giannakopoulos C, Hannides C, Lange M, Tanarhte M, Tyrlis E, et al. 2012. Climate change and impacts in the Eastern Mediterranean and the Middle East. Clim Change. 114(3-4):667–687. doi: 10.1007/s10584-012-0418-4.
- Mossad A, Alazba AA. 2015. Drought forecasting using stochastic models in a hyper-arid climate. Water. 6(4):410–430. doi: 10.3390/atmos6040410.
- Nations Online Countries of the World. 2021. https://www.nationsonline.org/oneworld/press_freedom.htm.
- Sabattini JA, Rafael AS. 2021. Rainfall trends in humid temperate climate in south America: possible effects in ecosystems of Espinal ecoregion. In: Stuart AH, editor. The nature, causes, effects and mitigation of climate change on the environment. London, UK: Intech Open.
- Salameh A, Fallah R. 2018. Changes in air temperature and precipitation over the Syrian coastal region. Cuadernos Geográficos. 57(3):140–151.
- Shaaban A. 2009. Indicators and aspects of hydrological drought in Lebanon. Water Resour Manage. 23:1875–1891.
- Simonet S. 2011. Adapting to climate change in the water sector in the Mediterranean: situation and prospects. Les Cahiers du Plan Bleu 10. https://planbleu.org/en/publications/adapting-to-climate-change-in-the-water-sector-in-the-mediterranean-situation-and-prospects/.
- Tadesse KB, Dink MO. 2022. The SARIMA model-based monthly rainfall forecasting for the Turksvygbult station at the Magoebaskloof Dam in South Africa. J Water Land Dev. 53:100–107. doi: 10.24425/jwld.2022.140785.
- Terink W, Immerzeel W, Droogers P. 2013. Climate change projections of precipitation and reference evapotranspiration for the Middle East and Northern Africa until 2050. Intl J Climatol. 33(14):3055–3072. doi: 10.1002/joc.3650.
- Wang HR, Wang C, Lin X, Kang J. 2014. An improved ARIMA model for precipitation simulations. Nonlin Processes Geophys. 21(6):1159–1168. doi: 10.5194/npg-21-1159-2014.
- Wang S, Feng J, Liu G. 2013. Application of seasonal time series model in the precipitation forecast. Math Comput Modell. 58(3-4):677–683. doi: 10.1016/j.mcm.2011.10.034.
- Whitehead PG, Wilby RL, Battarbee RW, Kernan M, Wade AJ. 2009. A review of the potential impacts of climate change on surface water quality. Hydrol Sci J. 54(1):101–123., doi: 10.1623/hysj.54.1.101.
- Xoplaki E, González-Rouco JF, Luterbacher J, Wanner H. 2004. Wet season mediterranean precipitation variability: influence of large-scale dynamics and trends. Clim Dyn. 23(1):63–78., doi: 10.1007/s00382-004-0422-0.
- Yeh H, Hsu H. 2019. Stochastic model for drought forecasting in the southern Taiwan Basin. Water. 11(10):2041. doi: 10.3390/w11102041.
- Zakaria S, Al-Ansari N, Knutsson S, Al-Badrany T. 2012. ARIMA Models for weekly rainfall in the semi-arid Sinjar District at Iraq. J Earth Sci Geotech Eng. 3:25–55.
- Zeleňáková M, Abd-Elhamid HF, Krajníková K, Smetanková J, Purcz P, Alkhalaf I., 2022. Spatial and temporal variability of rainfall trends in response to climate change, A case study: Syria. Water. 14(10):1670. doi: 10.3390/w14101670.