
 ?Mathematical formulae have been encoded as MathML and are displayed in this HTML version using MathJax in order to improve their display. Uncheck the box to turn MathJax off. This feature requires Javascript. Click on a formula to zoom.
Abstract
When the fault in a focal area enters the critical state, nonlinear accelerated deformation and disturbance changes may occur during tide-induced loading and unloading. In this study, the anomalies in the Korla volumetric strain caused by earth tide were investigated using a theoretical model of tidal force. Results show that the step changes in the Korla volumetric strain may be triggered by tidal force within a short time frame, ranging from a few to tens of days, prior to a moderate earthquake. The azimuthal angles at the time of step changes are mainly distributed in the ranges of 124–158° and 185–228°, and the azimuth angle at the time of many nearby medium-to-strong earthquakes occurring in this step concentration area, suggesting that the step anomalies in the Korla volumetric strain are closely related to the horizontal tide-induced force in a specific direction. Using the Schuster method, it was found that the tide-induced azimuth angle of the step changes occurred mostly at the minimum value of the solid tide, providing evidences of the modulation of the solid tide. These results may present new ideas for using crustal deformation observations for short-term earthquake predictions.
1. Introduction
Although tidal stress (on the order of 103 Pa) is significantly smaller than tectonic stress, the rate of change of tidal stress is two orders of magnitude larger than that of tectonic stress. Moreover, tidal stress has the characteristic of constant repetition at the specific location within the Earth. The oscillatory nature of this tide may play a more important role in the tidal stress trigger (Heaton Citation1975, Citation1982; Hartzell and Heaton Citation1989), particularly on faults already in a critical stress state, potentially leading to critical triggering effect (Kilston and Knopoff Citation1983; Lockner and Beeler Citation1999). When fault activity in the source area is close to an unstable state, a change in the direction of the tidal force may act as a trigger for fault activity and result in an earthquake occurrence (Tanaka et al. Citation2004, Citation2006; Laurent et al. Citation2009; Tanaka Citation2012). Therefore, many scholars (Ding et al. Citation1983; Han et al. Citation1996; Li Citation2000; Wu et al. 2001, Citation2009; Citation2001; Zhang et al. Citation2001; Chen Citation2003; Cochran et al. Citation2004; Li and Zhang Citation2011; Zhang et al. Citation2016; Ji et al. Citation2021) have studied the relationship between a certain earthquake sequence and the direction of the induced tidal force, or confirmed the triggering effect of the induced tidal force on faults in a critical state and on earthquakes. In addition, the characteristics of tectonic activity in the source area can be further examined according to its direction of induced tidal force triggering dominance (Zhang et al. Citation2007). When the tectonic stress is in a critical state, for dip-slip type earthquakes, an increase in tidal shear stress acting on the fault surface may enhance the tectonic stress level and induce sliding on the fault, thus accelerating the rupture process to trigger an earthquake (Perfettini et al. Citation2001). According to the results of rock experiments, the solid tide observation exhibits regular variations in the inelastic phase, however, during the establishment of criticality, nonlinear accelerated deformation and perturbative changes are observed in the tidal loading and unloading processes, indicating a certain triggering effect of tidal forces on the micro-dynamic deformation field (Zhang et al. Citation2006).
Through the observation of high-precision deformation monitoring instruments, it has been discovered that the tilting and gravity changes induced by tidal load may reveal the changes in the elastic properties of local crustal rocks (Lu and Zhang Citation2007), and then judge the location and time of earthquakes. The volumetric strain gauge is a precision instrument for automatically measuring and studying of deep crustal tectonics, subtle changes in the spatial and temporal distribution of crustal strain fields within small areas, and as well as providing continuous fine-scale observations of strain states within strata. It achieves an observation accuracy of 10−9 (Xu et al. Citation2012; Gao et al. Citation2023). Moreover, the establishment of the digital precursor observation network provides densely sampled minute-value observations, which enrich the information on pre-seismic changes of the tidal observation series. This facilitates the extraction of effective pre-seismic anomalies in tidal computational analysis. However, limited research has been conducted on exploring the relationship between micro-dynamic precursor anomaly information and tidal triggering using digital deformation data.
In this study, we conducted an analysis of solid tidal observations of the Korla volumetric strain. Our findings suggest that the deformation step change may be triggered by the induced tidal force when the seismic system in pregnant state enters a critical state of instability. Furthermore, we evaluated the feasibility of earthquake prediction via crustal deformation observations. We applied a theoretical model of the tidal force to assess the azimuthal distribution of the tidal force at the moment of step-change anomalies in the Korla volumetric strain, and compared the azimuthal distribution of non-predominant step-change anomalies. Additionally, we examined the tidal phase angle at the moment of tidal anomalies in the Korla volumetric strain using Schuster’s method and investigated its relationship with tidal triggering. Moreover, we analyzed how pre-seismic deformation step changes are influenced by tidal triggering, as this not only holds theoretical significance for understanding earthquake causes but also practical significance for earthquake forecasting. This study was divided into four parts: ‘Data selection and calculation’ introduce the basic situation of the strain data of Korla volumetric, the selection criteria of earthquake and step change, the theoretical model of tidal forces, and Schuster test method. In the section of ‘Result analysis’, we present the relationship between step change and tidal force, and discuss the azimuth distribution characteristics of non-precursor step changes, and report research findings from the modulation test of earth tide with step changes. The ‘Discussion’ analyzes the causes of step change and its potential indicative significance for earthquake prediction, while a summary is provided in the ‘Conclusion’ section.
2. Data and methods
2.1. Overview of information
The Korla Tiemenguan station is located between the middle of the North Rundai-Xingdi and Tiemenguan faults, with the nearest fault being the Hola Mountain front fault situated 1.2 km south of the station. The lithology of the platform base is pre-earthquake gneiss granite with an intact block form. In June 2007, a Korla volumetric strain gauge (model TJ-2) was installed at a borehole depth of 83 m. The auxiliary observation system constitutes the borehole water level, borehole air pressure, and borehole temperature. The instrument has a stable and reliable performance, high resolution, reasonable structure, and can clearly and continuously record the solid tides of the Earth. The average precision within the M2 wave tide reached 0.0095, with a minimum intra-tidal precision of 0.0053, meeting national Class I station standards (Xu et al. Citation2012; Jiang et al. Citation2006). Thus, the observation data were highly precise, and the recorded strain solid tide was reliable.
In this study, the step disturbance changes (named as step changes) of the Korla volumetric strain observation were verified, excluding the interference caused by instruments, weather, site environment, and other factors. Simultaneously, step changes within 1 min were eliminated due to their susceptibility to data collector influence. Based on these criteria, the occurrence time and number of step changes were calculated. The starting time of each step change was considered as occurrence time with adjacent step changes having an interval less than 10 days. The scanning results reveal a total of 17 groups of step changes in the volumetric strain since June 2007.
Combined with seismic activity in the vicinity, the triggering effect of tidal force on volumetric strain was studied. Since 2007, 13 earthquakes of magnitude 5.0 or above within 300 km of Korla station have been selected as research targets, including two earthquakes of magnitude 6.0 or above. The target earthquake was considered relevant if it occurred during a step change or within one month thereafter.
2.2. Theoretical model of tidal force
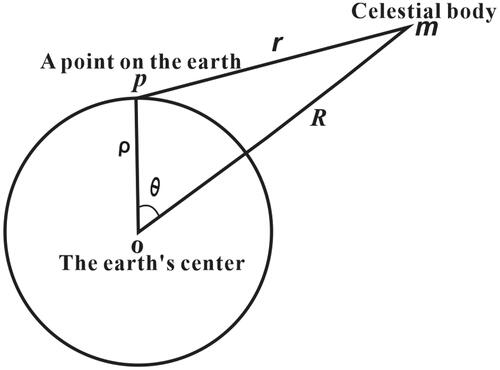
The combined solar and lunar gravitational forces acting on a unit mass of the Earth and the inertial centrifugal force resulting from the rotation of the Earth around the lunar and terrestrial common masses are considered tidal forces (Han et al. Citation2017). The induced tidal level V of celestial volumetric m at point P can be expressed as a spherical harmonic function as follows:
(1)
(1)
where R is the distance from the center of the Earth to the celestial volume, M is the mass of the celestial volume, f is the gravitational constant, ρ is the geocentric directivity, θ is the geocentric zenith distance, and Pn(cos θ) is the Legendre polynomial, as shown in .
Figure 1. Sketch of coordinate system of Earth center. R is distance from the center of Earth to the celestial volume, r is distance from a point on earth to the celestial volume, ρ is geocentric directivity, and θ is geocentric zenith distance.
For the Moon, generally taken as the third order, the lunar citation tide level can be written as (Xi and Hou Citation1986):
(2)
(2)
where c is the mean distance from the Moon to the center of Earth, and G(ρ) is the Doussen coefficient.
The derivative of the pilot tide level along either direction is equal to the component of the pilot tide force in that direction; thus, the pilot tide force F generated by the celestial volume at point P on Earth can be realized according to the formula (2) for the pilot tide level. The horizontal tidal forces Fn and Fe in the north-south and east-west directions and the vertical tidal force Fz are given by:
(3)
(3)
where
and l denote the geographical latitude and longitude, respectively, of point P.
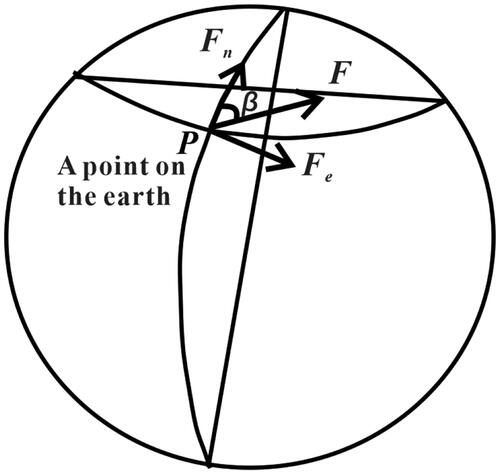
The azimuthal angle β, which is shown in , of the horizontal tidal forece of the Sun and Moon to any point within the Earth’s crust can be expressed as:
(4)
(4)
Figure 2. Sketch of horizontal tidal force at point P on the earth. F is tidal tidal forces, Fn is the horizontal tidal forces in the North-South direction, Fe is the horizontal tidal forces in the east-west direction, and β is azimuthal angle of the horizontal tidal force.
2.3. Schuster’s test method
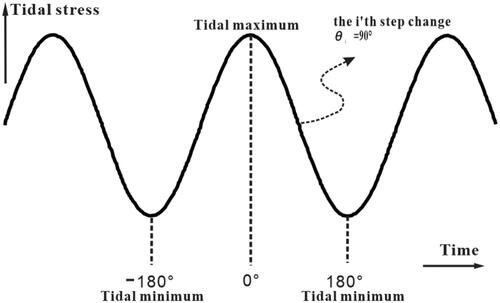
The Schuster test (Tsuruoka et al. Citation1995) enables the determination of the tidal phase angle of an earthquake by analyzing the periodic variation in earth tide and its occurrence time. In this method, a phase angle of 0° represents the maximum tidal value within a period, while ±180° indicates the minimum tidal value. This method can be used to study the relationship between seismic activity and the tidal generating force (Toksoz et al. Citation1981; Li et al. Citation2014; Li and Chen Citation2018; Chen Citation2021). In this work, we employed the Schuster method to study the relationship between tidal step change and tidal generating force through two main steps: Firstly calculating the tidal volumetric stress of the Korla volumetric strain and then assigning the phase angle based on the temporal evolution of tidal force change (). The peak stress closest to the time of the step change is selected and its phase angle is specified as 0°; the phase Angle of the preceding and subsequent trough is specified as ±180°, and the −180 to 180° interval is divided equally according to the time, then the corresponding phase angle can be calculated for each minute (Zhang et al. Citation2016). By multiplying the time difference between the step change and 0° with the respective phase angle at each time point, we obtain the tidal phase angle at that specific moment. The time interval between the tidal peak and the adjacent valley is not constant, but is determined by the angular distance between the peak and valley. In this manner, the numerical tidal stress based on phase analysis can be compared, and the time course of tidal stress change is not symmetrical or not. After the tidal phase angles of all the order variations are determined, the Schuster test can be used to investigate whether they are concentrated at a particular Angle, that is, to determine whether they are triggered by the tide (Li and Jiang Citation2011).
Figure 3. Determination of tide phase angle (Tanaka et al. Citation2004). The peaks are tidal maximum and The Valleys are tidal minimum.
3. Results
3.1. Relationship between step-change anomalies and tidal forces before moderate earthquakes
Since June 2007, a total of 13 earthquakes of MS5.0 or above have occurred within 300 km of Korla station. Among these events, seven earthquakes were preceded by distinct step changes (). Step changes in the Korla volumetric strain were determined before the Hejing MS5.3 (30 August 2008), Tokson MS 5.3 (8 June 2011), Heshu MS 5.0 (8 January 2012), Luntai MS 5.4 (15 June 2012), Xinyuan-Hejing MS 6.6 (30 June 2012), Tokson MS 5.4 (25 June 2015), and Kuqa MS 5.7 (16 September 2017) earthquakes, which were preceded by step-change anomalies ().
Figure 4. Distribution of moderate earthquakes and faults around the Korla volumetric strain observation station. Local faults (Li et al. Citation2021) are: F1, Singer Fault; F2, Yanji Fault; F3, Baltu Fault; F4, Boroconu-Azikekuduke Fault; F5, Kash river Fault; F6, Sarming Fault; F7, North Luntai Fault; F8, Kumugermu Fault; F9, Qiulitage Fault; F10, Yuli Fault.
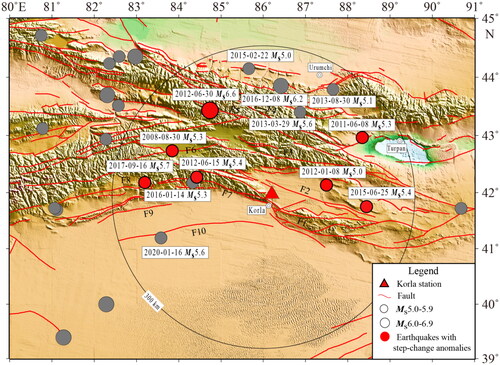
Figure 5. Raw data of the Korla volumetric strain and the earthquakes of magnitude 5.0 and above with 300 km radius centered at the station. Earthquakes marked in red are those with step-change anomalies. Also shown in this figure are the earthquakes of magnitude 4.7–4.9 following the step changes.
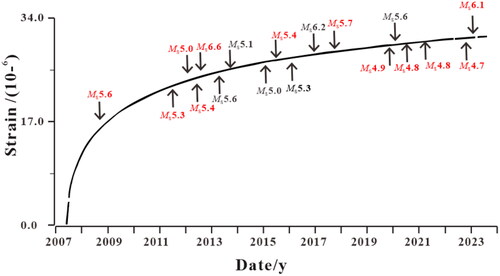
For example, prior to the Kuqa MS 5.7 earthquake on 16 September 2017, the observation curve from August 21 to 26 showed more concentrated seven step changes in the originally smooth solid tide ().
Figure 6. Minutes observation and residual curve of the Korla volumetric strain. (a) Step-change anomalies before the Kuqa MS5.6 earthquake, (b) Oberve curve from 20 to 29 February 2016.
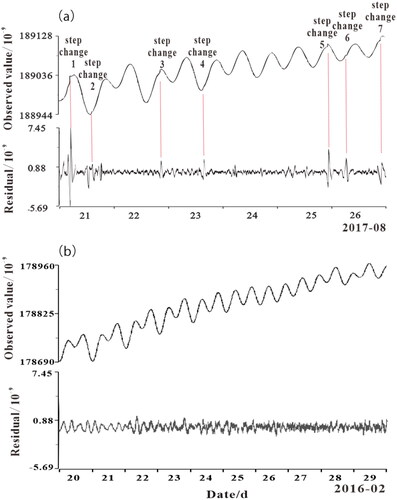
The observation curve from 20 to 29 February 2016 was selected for comparison, and it can be seen that the observed volumetric strain curve of Korla has no step change, and the residual fluctuates between the background values of −0.72 and 0.72 (). The step changes is less observed if no moderate earthquakes are existing in the strain signal.
The azimuths of the horizontal tidal force at the moment of the step-change anomalies and the moment of the earthquake were calculated using EquationEquations (3)(3)
(3) and Equation(4)
(4)
(4) ; the results are listed in .
Table 1. Azimuth of tidal force at step-change moment for the Korla volumetric strain before moderate earthquakes.
From the synthetic vector diagram of the horizontal tidal force at the moment of the step-change anomaly and the moment of the 2017 Kuqa MS5.6 earthquake (), it can be seen that the tidal force azimuths of the deformation step-change moments were mainly concentrated within the range of 218.64–273.95°, with the maximum angle difference of 55.31° and minimum angle difference of 0.95°. The tidal force azimuths of the four order change times and earthquake onset times appear in the smaller region of the third and fourth quadrants, different from the other three the azimuth angle of step changes. Similarly, before the 2015 Toksun MS5.4 earthquake, depicted in , the azimuth angle of the tidal force at most of the step-change moments was concentrated in 124.18–158.72°, with the maximum angular difference of 34.54° and minimum angular difference of 0.26°. The azimuth angle of step-change time and seismic time appeared in the smaller area in the second quadrant.
Figure 7. Synthetic vector diagram of horizontal tidal force for earthquakes. ◆ is the step-change moment, ● is the seismic moment, horizontal coordinate is EW direction, vertical coordinate is NS direction, the ray angle range indicates azimuth concentration of the tidal force. (a) Kuqa MS5.6 earthquake in 2017, (b) Toksun MS5.4 earthquake in 2015, (c) Xinyuan-Hejing MS6.6 and Luntai MS5.4 earthquake in 2012, (d) Heshuo MS5.0 earthquake in 2012, (e) Toksun MS5.3 earthquake in 2011, (f) Hejing MS5.6 earthquake in 2008.
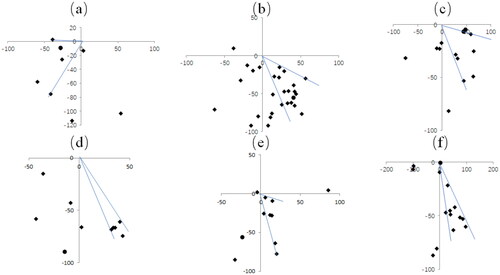
The same features were also be observed before the 2012 Luntai MS5.4, Xinyuan-Hejing MS6.6, 2012 Heshuo MS5.0, 2011 Toksun MS5.3, 2008 Hejing MS5.6 earthquakes (). presents detailed statistics of the distribution characteristics of the azimuthal angle of the tidal force at these times. It is evident that the azimuth angle of the tidal force at the time of the step changes was predominantly concentrated in the angle range of 17.58–55.31°.
Table 2. Statistics of the tidal phase angle before the moderate earthquake.
From the synthetic vector diagrams of horizontal tidal force before multiple earthquakes, it can be seen that the azimuthal angles of tidal force at the moment of the step-change anomalies in the Korla volumetric strain are predominantly concentrated in the range of 124–158° (second quadrant); The azimuth angle of step changes time and seismic time appear in smaller areas at the times of the Kuqa MS5.6, Tokson MS5.4, and Xinyuan-Hejing MS6.6, and Hejing MS5.6 earthquakes; thus indicating a correlation between step changes in Korla volumetric strain and the triggering effect of specific direction by horizontal tidal forces.
3.2. Analysis of non-precursor step-change anomalies
According to the observation curve of the minute values of the Korla volumetric strain there are 17 sets data of step changes since recording data. The azimuthal distribution characteristics of the tidal generating forces for the 6 groups of step changes were analyzed in , and moderate to strong earthquakes occurred within a radius of 300 km from the station within one month after the end of step changes. Here, we conducted analysis on an additional 11 sets of step-change data.
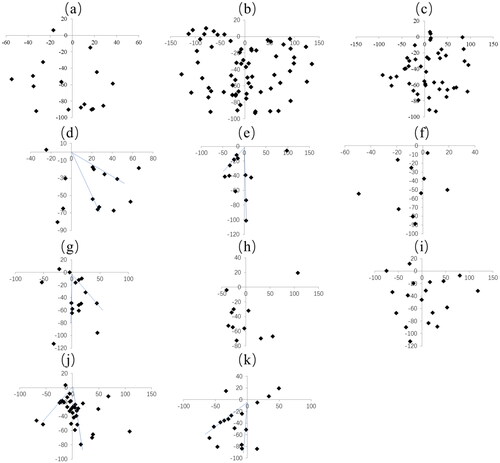
As shown in , the concentration phenomenon in the azimuth of the tidal force did not occur in May–June 2016 (), July–August 2018 (), June–August 2019 (), November 2020 (), June 2021 (), and July–August 2022 (); the distribution is relatively scattered, and no subsequent significant earthquakes occurred. Interestingly, the azimuth of the tidal force in November 2019 (), June–August 2020 (), February–March 2021 (), October–November 2022 (), and January 2023 () is relatively concentrated, mainly in the range of 130–158° (second quadrant) and 185–228° (third quadrant). We noted that earthquakes of smaller magnitudes (MS4.7–4.9) were detected within a range of 300 km around the station during or within a month after the end of the four sets of step changes, particularly the Shaya MS6.1 earthquake that occurred 376 km from the station three days after the end of the step change in January 2023.
Figure 8. Synthetic vector diagram of horizontal tidal force. All the descriptions are the same as the except for the time periods: (a) 17 May to 5 June 2016, (b) 3 July to 9 August 2018, (c) june 9 to 23 August 2019, (d) 4 to 11 November 2019, (e) 24 June to 4 August 2000, (f) 2 to 25 November 2000, (g) 21 February to 24 March 2021, (h) 1 to 25 June 2021, (i) 26 July to 21 August 2021, (j) 12 October to 15 November 2022, (k) 6 to 27 January 2023.
3.3. Test of tide modulation
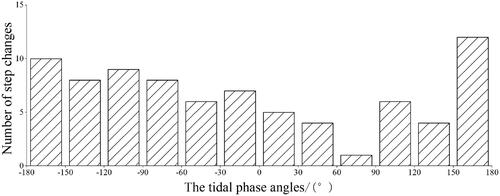
Applying the Schuster method to the 78 step-change data presented in , the tidal phase angles for all step-change data can be determined statistically (). Notably, the step change in the ±180 vicinity is apparently more frequent, i.e. the step change occurs mostly at the moment of the solid tide minimum. This observation strongly suggests that the occurrence of the step change in the Korla volumetric strain is significantly triggered by the solid tide modulation.
Figure 9. Phase angle statistics of strain step-change anomalies in the Korla volumetric strain.
4. Discussion
The tidal force has a certain effect on the micro-dynamic deformation field before a moderate earthquake occurs. The azimuthal angle of the tidal force of the step-change anomalous moments in the Korla volumetric strain is predominantly concentrated within the range of 124–158° (second quadrant). The azimuthal angles of the anomalous and seismic moments appeared in a small area prior to the earthquakes. Conversely, the azimuthal angle distribution of the non-precursor step-change anomalous moments was not considered concentrated. The results of the Schuster test further show that the tidal phase angles of the step-change data mostly occur at the moment of the ±180 vicinity. This indicates that the occurrence of step-change data is not random, but rather exhibits a higher prevalence near specific tidal phases. It is likely influenced by both a tidal triggering effect or tidal correlation, and thus indicating that there is a certain triggering effect of the tidal force on the micro-dynamic deformation field. Combined with the process of rock rupture and deformation, it can be seen that in the late stage of earthquake preparation, the stress-strain constitutive relationship will enter a nonlinear stage with the increase of stress field, and the physical properties of the medium will change (Zhang et al. Citation2006; Wang et al. Citation2015). The occurrence and breeding of earthquakes are affected by the sun-moon tidal force. The closer the instability point is, the more obvious the triggering effect is. Similar to the seismic activity, when the fault activity in the source area is close to destabilization, the Korla volumetric strain may be triggered by the tidal force for a period of time, which can be a few days to several tens of days before the earthquake, with no significant correlation between this periods and seismic magnitude.
The results of the Schuster test further show that the step changes mostly occur at the valley of the solid tide, i.e. the moment of maximum tidal compressive stress. The characteristics of the tidal phase distribution show that the direct stress induced by the earth tide on the fault is consistent with the effect of tectonic stress for most of the step changes. According to the focal mechanisms shown in , the thrust fault occupies a dominant position, indicating that the direct stress generated by the tectonic stress field on the fault surface should be the dominant factor triggering earthquake. The dominant direction of the step-change tidal force in the Korla volumetric strain is more apparent before the 2008 Hejing MS5.6, 2011 Toxun MS5.3, 2012 Heshuo MS5.0, 2012 Xinyuan-Hejing MS6.6, and 2015 Tokson MS5.4 earthquakes, all around approximately 140°, indicating that the corresponding dominant direction of the horizontal tidal force is NWW, which is basically consistent with the main pressure of the source mechanism solution. The dominant direction of the step-change tidal force was approximately 220° before the 2017 Kuqa MS5.7 earthquake, and the corresponding dominant direction of the horizontal tidal force was NEE, which is consistent with the main pressure of the source mechanism solution (). Seismic stress is the superposition of tectonic and tidal stresses. Usually, the main direction of the tectonic stress field is consistent with the P- and T-axis directions of the main seismic stress (Li and Jiang Citation2011), as well as the direction of the tidal stress, which is regarded as pressurized tidal stress. If the direction of the tidal stress is not consistent with the fault slip direction, the tidal stress has no triggering effect on the seism genic fault.
Table 3. Statistics of seismic source parameters.
illustrates that among the 7 earthquakes exhibiting step-change, 6 are thrust earthquakes. Previous studies have demonstrated a clear triggering effect of tides on the earthquakes of thrust type. For instance, Tanaka et al. (Citation2002a) observed that a majority of the 385 Mw ≥ 5.5 thrust earthquakes between 1977 and 2000 occurred during the peak tidal normal stress period surrounding the Mw7.5 earthquake in South Tonga in 1982. Tanaka et al. (Citation2002b) analyzed a global dataset of 9350 M ≥ 5.5 earthquakes triggered by tides, categorizing them based on source depth and magnitude, and found a strong correlation between each earthquake group and tidal shear stress. It was suggested that when fault stress approached its limit value, even small-amplitude tidal stresses could trigger an earthquake event. on the other hand, these findings clearly indicate no significant tidal triggering effect for strike-slip earthquakes. Cochran et al. (Citation2004) investigated over 2000 Mw ≥ 5.5 earthquakes worldwide from 1977 to 2000 and discovered that tides do trigger shallow source thrust earthquakes. The variation in tidal triggering effects across different rupture types with latitude also reveals a more pronounced influence on thrust faults at middle and high latitudes compared to decreasing effects with increasing latitude for strike-slip faults (Xu et al. Citation2011). The rupture plane of earthquakes studied in this paper is oriented nearly east-west, exhibiting a thrust-type rupture mechanism. The principal compressive stress aligns predominantly north-south, which is consistent with the overall dynamic environment of the Tianshan seismic belt controlled by the combined effects of northward extrusion from the Tibetan Plateau and southward extrusion from the Siberian block. According to Byerlee’s law of friction (Kirby Citation1980), thrust faults require greater force for their formation compared to strike-slip faults. It is hypothesized that prior to earthquake occurrence, the accumulation rate of tectonic stress on fault surfaces decreases as fault locking intensifies; thus, the thrust faults experience lower rates of tectonic stress accumulation than strike-slip faults before rupture. Assuming earthquakes are solely triggered by tectonic stress, it follows that the thrust faults require a longer period of time to accumulate sufficient tectonic stress prior to an earthquake event compared to strike-slip faults. This extended period allows solid tides ample time for both magnitude and directional changes necessary for alignment with fault rupture conditions capable of triggering an earthquake. Consequently, it can be inferred that most thrust earthquakes are more likely triggered by solid tides. The observed step change in Korla volumetric strain can be attributed to rapid stress variations occurring once a fault reaches its critical state. In case of thrust faults, tidal stresses are likely responsible for triggering step changes, while in case of strike-slip faults, they may play a more significant role in their initiation and development, and thus the step changes are less detected.
No significant step change in the Korla volumetric strain was observed before 6 earthquakes with magnitude of over 5.0 within a 300 km radius of Korla station. These earthquakes are depicted in : Urumqi – Changji MS5.6 earthquake on 29 March 2013, Urumqi MS5.1 earthquake on 30 August 2013, Shawan MS5.0 earthquake on 22 February 2015, Luntai MS5.3 earthquake on 14 January 2016, Hutubi MS6.2 earthquake on 8 December 2016, and Kuqa Ms5.6 earthquake on 16 January 2020. The Urumqi-Changji MS5.6, Urumqi MS5.1, Shawan MS5.0, and Hutubi MS6.2 earthquakes occurred on the Khorgos-Manasi-Tugu fold fault which is separated from the North Luntai-Xingdi fault at Korla Station by the Boltu, Kashi, and Boruk-Akikuduk faults, respectively. The location of the faults may be considered as the primary cause for the absence of response in the volumetric strain. In addition, the Kuqa MS5.6 earthquake on 16 January 2020 occurred in the Tarim Basin with quite different tectonics, meanwhile, the focal mechanism solution of the earthquake is the strike-slip type (Wei et al. Citation2021), which may have some influences on the triggering. Previous studies have shown that the effect of seismic-induced tidal forces may be related to the geological structure of the region, location of seismogenic faults and stations, earthquake type, and other factors, which may also impact the step change of the volumetric strain and thus the triggering effect of tidal stress on volumetric strain. Nevertheless, the distance between the Luntai MS5.3 earthquake on 14 January 2016 and the Luntai MS5.4 earthquake on 15 June 2012 was just 7 km, and the seismogenesis fault and rupture mechanism were almost the same. The Korla volumetric strain did not appeared step change before the MS5.3 earthquake but with anomalies before the MS5.4. The rupture plane of Luntai MS5.4 was 300° (Zhao et al. Citation2017), while the rupture plane of MS5.4 was 89° (). We note that the strike of the North Luntai Fault is nearly east-west direction, which is the same as the MS5.4 one. Therefore, this earthquake may more accurately reflect the high stress state of the region, which is more likely to trigger step changes during the establishment of criticality. However For the MS5.3 earthquake, due to the difference in the tectonic stress direction, it may manifest its local stress accumulation rather than the regional stress field, so no step changes were observed in the Korla volumetric strain before the mainshock.
Since 2007, the azimuth at the time of the step changes and earthquake occurrence appears to be in a small range before many earthquakes of magnitude 5.0 and above within 300 km. As shown in , the responses of the step changes to the NWW-oriented Borunnu, Bortu, and Beiluntai-Xingdi faults are relatively high. Eight earthquakes, with magnitudes of 5.0 and above, occurred in these fault zones, seven of which were preceded by volumetric strain step changes, with only 12.5% missing report rate. This phenomenon underscores the crucial significance of analyzing deformation data for short-term predictions. If tides induce a step change within a specific area, it implies that the fault is continuously induced by the action of a certain direction of the tidal force, and exhibits regular responses, indicating that the fault activity is close to the critical state, and the earthquake may be triggered at any time under the action of tidal stress.
No earthquakes with a magnitude of MS5.0 and above were observed within 300 km of the station following 11 groups of step changes in the Korla volumetric strain. However, earthquakes ranging from MS4.7–4.9 occurred after four groups of step changes within a month, and MS6.1 earthquake occurred over a wider range after one group of step changes. These five groups of step changes also exhibited the phenomenon of tidal azimuth concentration, which may be related to the triggering of tidal stress. The relationship between some step changes and tidal triggering is unclear and requires more in-depth study.
The step-change anomaly of the Korla volumetric strain holds significant reference value for subsequent seismic locations. Except for the 2017 Kuqa MS5.7 earthquake, the tidal force azimuths at most of the step-change times in the Korla volumetric strain before the moderate earthquake are mainly distributed in the second quadrant. The Kuqa earthquake occurred 231 km northwest of Korla Station, and the other earthquakes occurred within a range of 210 km to the northwest or northeast of Korla Station. Similar to the Kuqa earthquake, the tide force azimuths of the step-change times were concentrated in the third quadrant before the Shaya MS6.1 earthquake On 30 January 2023, the Shaya MS6.1 earthquake was located southwest of the station. When the azimuths of the tidal force were concentrated in the second quadrant, subsequent earthquakes occurred in the middle and eastern sections of the Tianshan Mountains. Conversely, when the azimuth of the tide-generating force was concentrated mainly in the third quadrant, subsequent earthquakes mostly occurred in the Kuqa Depression area.
5. Conclusion
This work adopts a theoretical model of tidal forces to investigate anomalies in the Korla volumetric strain caused by earth-tide. Before moderate earthquakes occur, the volumetric strain of Korla may be triggered by tidal forces, leading to step changes in the short term, and this change may be related to the action of tidal forces in a specific direction. The results show that when a seism genic system enters a critical state of instability, a small stress disturbance may trigger a change in micro-deformation field. Using the Schuster method, it was found that the tide-induced azimuth angle of the step changes occurred mostly at the moment of maximum tidal compressive stress, it is more obvious to trigger the thrust type earthquake. This result not only deepens the understanding of earthquake breeding and occurrence processes, but also has important practical significance for earthquake prediction. The regularity of the response changes under the action of a certain direction of the tidal force may reveal the degree of the approaching earthquake; whereas, the distribution characteristics of the azimuth angle of the tidal force at the time of the deformation step change may predict the location of the earthquake.
Author contributions
Conceptualization, H.Y.; methodology, G.H.; software, G.H.; formal analysis, B.Z. Z.Y. and Z.L.; resources, Y.M.; writing—original draft preparation, G.H.; writing—review and editing, H.Y. All authors have read and agreed to the published version of the manuscript.
Acknowledgments
We sincerely thank researcher Jing Zhang of the Institute of China Seismological Bureau for providing calculations.
Disclosure statement
No potential conflict of interest was reported by the author(s).
Data availability statement
All data used during the study are available from the corresponding author by request.
Additional information
Funding
References
- Chen RH. 2003. Relation between tidal force triggering of significant shocks and the large earthquake and its application in the prediction of Yajiang earthquake. Earthquake. 23(1):53–56.
- Chen XZ. 2021. The tidal triggering of earthquakes. Prog Earthquake Sci. 51(4):145–160.
- Cochran ES, Vidale JE, Tanaka S. 2004. Earth tides can trigger shallow thrust fault earthquakes. Science. 306(5699):1164–1166. doi: 10.1126/science.1103961.
- Ding ZY, Jia JK, Wang R. 1983. Seismic triggering effect of tidal stress. Acta Seismol Sin. 5(2):172–184.
- Gao C, Ma D, Qu M, Qian JG, Yin HQ, Hou XZ. 2023. Study of the anomaly mechanism in the borehole volumetric of Hualai seismic station using PS-InSAR technology. Remote Sens Natural Res. 35(3):153–159.
- Han YB, Li ZA, Tian J. 1996. The researching of the relation of occurrence time of earthquakes and the solar-lunar tidal force in some areas of China. Prog Geophy. 11(2):114–122.
- Han YY, Meng LY, Liu GP, Zhou LQ, Zang Y, Li ZC. 2017. The spatio-temporal characteristics of earth tide modulation ratio before moderate earthquakes in northwest China. Acta Seismol Sin. 39(5):738–750.
- Hartzell S, Heaton T. 1989. The fortnightly tide and the tidal triggering of earthquakes. Bull Seism Soc Am. 79(4):1282–1286. doi: 10.1785/BSSA0790041282.
- Heaton TH. 1975. Tidal triggering of earthquakes. Geophys JR Astr Soc. 43(2):307–326.
- Heaton TH. 1982. Tidal triggering of earthquakes. Bull Seism Soc Am. 72(6A):2181–2200. doi: 10.1785/BSSA07206A2181.
- Ji C, Wu K, Luo L, Wang XY. 2021. Statistical characteristics of global earthquake time-celestial volumetric position and its correlation with tidal force. J Univer Chin Acad Sci. 38(5):632–641.
- Jiang CK, Su P, Sun HJ, Luo HJ. 2006. Analysis on the reliability of body strain observation data in Korla. Seismol Geomag Observat Res. 34(5/6):162–166.
- Kilston S, Knopoff L. 1983. Lunar-solar periodicities of large Earthquakes in Southern California. Nature. 304(5921):21–25. doi: 10.1038/304021a0.
- Kirby S. 1980. Tectonic stress in the lithosphere: constraints provided by the experimental deformation of rock. J Geophys Res. 85:6353–6363.
- Laurent M, de Viron O, Conrad CP, Renault S, Diament M, Patau G. 2009. Evidence of earthquake triggering the solid earth tides. Earth Planet Sci Lett. 278(3-4):370–375. doi: 10.1016/j.epsl.2008.12.024.
- Li J, Gao Y, Wang Q. 2021. Anisotropic zoning in the upper crust of the Tianshan Tectonic Belt. Sci China Earth Sci. 64(4):651–666. doi: 10.1007/s11430-020-9709-0.
- Li J, Jiang HK. 2011. A review on tidal triggering of Earthquakes. Earthquake. 31(4):36–47.
- Li J, Jiang HK, Huang Y,Qu JH,Gao CJ. 2014. Statistical analysis on tidal triggering of recent earthquakes in the Tianshan Seismic Zone. Earthquake. 34(2):35–44.
- Li KW. 2000. Earth rotation and triggering of tidal-generating force for the strong earthquakes in North China. Earthquake. 20(1):59–64.
- Li YE, Chen XZ. 2018. Earth tidal stress as an earthquake trigger prior to the Wenchuan earthquake, Sichuan, China. Chin Sci Bull. 63:1962–1970.
- Li ZR, Zhang XD. 2011. Relationship of tidal stress and large earthquakes. Earthquake. 31(4):48–57.
- Lockner DA, Beeler NM. 1999. Premonitory slip and tidal triggering of earthquakes. Geophys Res Let. 104(9):20133–20151.
- Lu XP, Zhang GS. 2007. The response of the deformable earth to tidal generating forces and stresses. Sci Survey Mapp. 32(2):24–25.
- Perfettini H, Schmittbuhl J, Rice JR, et al. 2001. Frictional response induced by time-dependent fluctuations of the normal loading. J Geophys Res. 106(B7):13455–13472.
- Tanaka S, Ohtake M, Sato H. 2002a. Spatio-temporal variation of the tidal triggering effect on earthquake occurrence associated with the 1982 South Tonga earthquake of Mw7.5. Geophys Res Lett. 29(16):86. doi: 10.1029/2002GL015386.
- Tanaka S, Ohtake M, Sato H. 2002b. Evidence for tidal triggering of earthquakes as revealed from statistical analysis of global data. J Geophys Res. 107(B10):2211. doi: 10.1029/2041JB001577.
- Tanaka S, Ohtake M, Sato H. 2004. Tidal triggering of earthquakes in Japan related to the regional tectonic stress. Earth Planets Space. 56:511–515.
- Tanaka S, Sato H, Matsumura S, Ohtake M. 2006. Tidal triggering of earthquakes in the subducting Philippine Sea Plate beneath the lacked zone of the plate interface in the Tokai Region, Japan. Tectonophysics. 417(1-2):69–80. doi: 10.1016/j.tecto.2005.09.013
- Tanaka S. 2012. Tidal triggering of earthquakes prior to the 2011 Tohoku-Oki earthquake (Mw9.1). Geophys Res Lett. 39(7):105–114. doi: 10.1029/2012GL051179.
- Toksoz MN, Sawyer DS, Cheng CH. 1981. Tidal triggering of earthquakes. Induced Earthquakes. 12(2):265–302.
- Tsuruoka H, Ohtake M, Sato H. 1995. Statistical test of the tidal triggering of earthquakes: contribution of the ocean tide loading effect. Geophy J Int. 122(1):183–194. doi: 10.1111/j.1365-246X.1995.tb03546.x.
- Wang CY, Yang WC, Wu JP, Ding ZF. 2015. Study on the lithospheric structure and earthquakes in North-South Tectonic Belt. Chinese J Geophys. 58(11):3867–3901.
- Wei YY, Liu P, Nie XH, Gao R, Wang Q. 2021. Analysis on characteristics of Kuche Ms5.6 earthquake sequence on 16 January 2020 and its seismological anomaly. Inland Earthquake. 35(4):326–336.
- Wu XP, Huang Y, Hu JF, Jiang J. 2001. Calculation of additional tidal stress along seismic principle stress orientation and study on its action mode on seismogenic fault. J Seismol Res. 24(1):48–54.
- Wu XP, Mao W, Huang Y, Hu H, Hu YL. 2009. The triggering effect of tidal stress of earthquakes in China and its related astronomical characteristics based on different tectonic zones. Sci China. 39(6):901–912.
- Xi QW, Hou TH. 1986. Earth tides and generating tide constants. Earthquake Res China. 2(2):30–41.
- Xu CY, Sun HJ, Yang SF. 2012. Preliminary analysis of eclipses phenomenon influence on body strain observation at Korla Seismic Station. Seismolog Geomagnetic. 33(5/6):105–108.
- Xu YJ, Wu XP, Yan CH, et al. 2011. Characteristics of solid tidal coulomb fracture stress on different types of seismic faults. Chin J Geophys. 54(3):756–763.
- Zhang B, Zhang H, Shi YL. 2016. A discussion about how the deep moonquakes are triggered by tidal stress. Journal of University of Chinese Academy of Sciences. 33(1):82–88.
- Zhang GM, Li L, Li KW, Ma HS. 2001. Group strong earthquakes and triggering by tidal stress. Earthquake Res China. 17(2):110–120.
- Zhang J, Xi QW, Yang LZ, Chen RH, Wang WX. 2007. A study on tidal force stress triggering of strong earthquakes. Chinese J. Geophys. 50(2):448–454.
- Zhang J, Chen RH, Yang LZ, Ji P. 2006. Research on distinguishing method and mechanism of tidal deformation anomalies before large earthquakes. Acta Seimol Sin. 19(2):155–162. doi: 10.1007/s11589-002-0155-2.
- Zhang YZ, Ji HG, Cai MF, Li T, Xiang P. 2016. Triggered effect of solid tidal stress on rock burst and its mechanism. J Min Safety Eng. 33(3):535–543.
- Zhao BB, Nie XH, Liu JM. 2017. Characteristics of seismic anomaly and sequence of Luntai Ms5.3 earthquake in 2016. Inland Earthquake. 29(2):24–29.