
Abstract
Ministerial Decree 65/58 and its Guidelines, published in 2017, allow the seismic risk classification only of masonry buildings, associating with their vulnerability class their location within the four seismic zones into which Italy has been divided since 2003. Therefore, if the masonry type and structural weaknesses of a building are known, it is possible to assign the corresponding vulnerability class to it and to census, by means of a rapid onsite survey, the seismic risk class of a very large number of masonry buildings. Based on this assumption, a method has been developed for a single operator to rapidly determine the masonry type and structural weaknesses of a building. The survey was conducted by recording this information in alphanumeric tables divided into fields whose attributes were preliminarily chosen and inserted in data dictionaries that could be brought up with drop-down menus. At the end of the survey, the contents of the tables were transferred to a relational database, incorporated in a geographical information system, filtered and processed to obtain the vulnerability class of each building represented on the same basic numerical cartography used during the survey. By associating the seismic zone with the building, the corresponding class was calculated. The method made it possible to census the seismic risk class of 400 masonry buildings in a municipality with an extension of ca. 20 km2 in less than two working days. This highlights the possibility of extending it to larger areas to estimate, assess or manage the effects or the emergency phase of an earthquake.
1. Introduction
The preventive assessment of the seismic risk of masonry buildings within a more or less vast area is the starting point for estimation of the effects produced by earthquakes (Kun et al. Citation2006; Vicente et al. Citation2011; Alam et al. Citation2013; Milani and Valente Citation2015; Meroni et al. Citation2017), for evaluation of large damage scenarios (Bernardini et al. Citation2010; Dou et al. Citation2012; Neves et al. Citation2012; Huang et al. Citation2017; Liebenberg et al. Citation2017; Fallah-Aliabadi et al. Citation2020; Arkan, Işık, Harirchian, et al. Citation2023) or to manage and plan the emergency phase (Mussumeci et al. Citation2004; Hashemi and Alesheikh Citation2011; Irwansyah and Hartati Citation2014; Jefferson and Johannes Citation2016; Maio et al. Citation2016; Zhai et al. Citation2019; Sauti et al. Citation2021).
For this reason, rapid seismic risk assessment ‘studies at an urban scale’ have taken place, especially in areas characterized by complex tectonic scenarios (Albayrak et al. Citation2015; Šipoš and Hadzima-Nyarko Citation2017; Ademović et al. Citation2020; Khemis et al. Citation2023). Nonetheless, they have highlighted the lack of field studies on the overall vulnerability (Lagomarsino and Giovinazzi Citation2006; Barbat et al. Citation2010; Ferreira et al. Citation2014; Zuccaro and Cacace Citation2015; Lestuzzi et al. Citation2016; Ceroni et al. Citation2020), the impossibility of preparing effective rapid survey techniques (Ricci et al. Citation2011) and the lack of a numerical cartography of the municipality to support the survey (Leggieri et al. Citation2022).
In Italy, the ReLUIS project (Zuccaro et al. Citation2012, Cacace et al. Citation2018; Zuccaro et al. Citation2023) was aimed at overcoming these problems with data available from ISTAT censuses (2011) or from regional building–structural inventories (Polese et al. Citation2019) or from the compilation of CARTIS forms. The lack of detailed ISTAT information, the few regional inventories and a delay in the collection of CARTIS data is hindering the realization of this ambitious project whose mission was to make available to the scientific community a huge database from which to draw information to map the seismic risk of the entire Italian residential building stock (Garavaglia et al. Citation2023).
As the recent devastating earthquake in Turkey (Işik 2023) has made clear, the assessment of seismic risk at a territorial level must be conducted by identifying ‘a priori’ the vulnerability of a large number of buildings (Calderoni et al. Citation2017; Sandoli and Calderoni Citation2018), especially masonry ones (Isik, Avcil, et al. 2023), situated in areas where they were constructed without respecting the most basic standards of anti-seismic design (Arkan et al. Citation2023b). Therefore, it was decided to propose a method for a rapid census, over large areas, of the seismic risk classes of masonry buildings, which in Italy are the ones potentially most exposed to earthquakes.
The method is based on the simplified classification of the seismic risk of buildings indicated in the Guidelines appended to Ministerial Decrees 65 and 58 (2017): the seismic risk class of a masonry building is calculated, in a tabular manner, by relating its vulnerability, divided into six classes (from the least vulnerable V1 to the most vulnerable V6 based on its masonry type and structural weakness), to its location in one of the four seismic zones into which Italy has been divided since 2003 (OPCM 3274/2003).
It is conducted by means of a rapid survey in which the building’s masonry type is identified visually (if this is not possible, it is inferred indirectly from the year of construction or presumed age); to this information is added the use, the height or number of stories above ground, the regularity or irregularity of the planimetric, height and roof geometry, the construction elements of floor assemblies and roofs, the degradation, obvious or hidden damage mechanisms, etc., which are essential to assess the presence of any structural deficiencies or weaknesses.
The survey is carried out with the use of a hardware device (e.g. laptop computer) in which a basic numerical cartography is loaded: the operator identifies the building on the map and notes the historical, geometric and material data on a spreadsheet. The annotation is virtually automatic since this information has already been included in alphanumeric lists (data dictionaries) which can be brought up with drop-down menus.
Once the survey is completed, its content is transferred to a dedicated information system, consisting of a relational database (DBMS) in a GIS environment, where it is filtered and processed by means of ‘queries’.
Initially, a first vulnerability class is assigned to the building based on the masonry type indicated in a table of the Guidelines. Subsequently, the other information is analyzed to evaluate whether, on the basis of the elements detected, there are any structural deficiencies or weaknesses. If these are present, a second vulnerability class, higher than the previous one, is reassigned to the building. At the end, once the geographical position of the building within the seismic zone is known from the GIS, a census of the seismic risk class of all the surveyed buildings is obtained.
The method was tested in a municipality with an area of ca. 20 km2 consisting of approximately 1,000 residential units of which 400 were masonry ones; after a recent seismic sequence, the Administration had decided to activate an economic incentive plan to assess and prevent the seismic risk of private buildings. A single operator was able to record and census all the 400 masonry buildings in less than two working days.
Although the method has only been tested at the municipal level, it constitutes a rapid and effective solution to census a large number of masonry buildings since the elements that determine the vulnerability of the building are easily detectable, extremely versatile hardware to support the survey is commercially available, and numerical cartography of municipalities is present in Italy.
1.1. The guidelines for the simplified seismic risk classification of masonry buildings
The decree of the Ministry of Infrastructure and Transport no. 65 of 7 March 2017 amending art. 3 of the Ministerial Decree no. 58 of 28 February 2017 introduced the Guidelines for the classification of seismic risk of buildings. These guidelines use two approaches, the conventional one (Milani and Valente Citation2016) based on numerical calculations, applicable to all buildings regardless of their construction type and regulated by the Technical Construction Standards (NTC Citation2018), and the simplified one used in this paper and applicable only to masonry buildings.
The simplified approach identifies eight classes of seismic risk (from G* greatest risk to A*+ least risk), each of which is characterized by a parameter representing the economic losses (as percentages of reconstruction cost) due to possible damages to structural and nonstructural elements. This parameter, indicated as PAM (expected Mean Annual Loss), instead of the IS-V (Safety index - Conventional Approach) or more recently EAL (expected Annual Losses) (Cosenza et al., Citation2018; D’Amato et al., Citation2022; Laguardia et al., Citation2023), varies for each class from ≥7.5% (G*) to ≤0.5% (A*+) ().
Table 1. Seismic risk classes and corresponding PAM values.
Attribution of the seismic risk class occurs on the basis of the vulnerability classes defined by the European macroseismic scale – EMS (Grünthal Citation1998) through two simple steps:
assignment of the initial vulnerability class on the basis of the masonry type (). reports six vulnerability classes (V1 to V6 with increasing vulnerability) and their dispersion towards another class;
determination of the shift (reassignment) to a higher (final) vulnerability class on the basis of structural deficiencies or weaknesses.
Table 2. Attribution of the initial vulnerability class based on the masonry type.
The Guidelines also provide indications on structural weaknesses (such as the presence of low-quality mortar, poor construction quality, existing damage or degradation, lack of connection between the floor and vertical walls or between orthogonal walls, any out-of-plan mechanisms and large openings) but which nonetheless constitute minimal assessment elements.
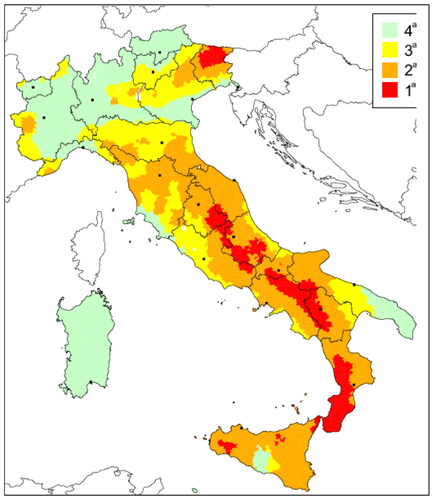
At the end, a vulnerability class is always known for the building and when its location within the seismic zones into which Italy has been divided (OPCM 3274/2003) based on the value of the peak ground acceleration PGA () is identified, allows definition of the seismic risk class.
Figure 1. Zones (from 1 to 4) of Italy based on seismic hazard. PGA with probability of exceeding 10% in 50 years.
2. The method
2.1. Introduction
In the phase of identifying the information necessary to define the masonry type and the structural deficiencies and weaknesses, efforts were made to choose the elements to be recorded in the awareness that the field operations would be carried out visually from outside the building.
The data recording had to be suitable for a rapid survey, involving the creation of tables whose fields would exhaustively describe the elements of information and, at the same time, would have a list of attributes (data dictionaries) that could be brought up without having to be input via the keyboard, i.e. with drop-down menus.
The information progressively recorded during the survey would have to be transferred to an environment of automatic archiving, selection and querying: the Data Base Management System (DBMS) environment was chosen which, in addition to these characteristics, also possesses a powerful language, namely Structured Query Language (SQL).
The survey required a basic numerical cartography that identified the building: regional topographic databases (DBT) were used, in vector format, at an urban scale.
Finally, the census was concluded by extracting the seismic zone from the DBMS and representing, on the same numerical cartography, each building with the corresponding seismic risk class, and then printing thematic maps and seismic maps: an open-source GIS available online was used.
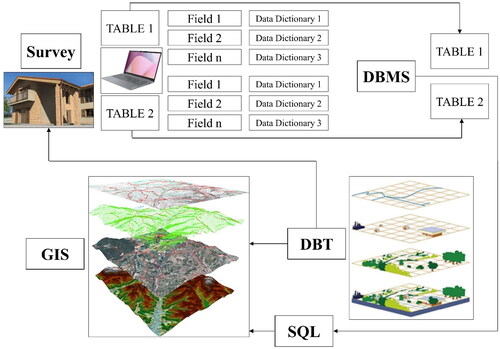
A block diagram of the method, described in detail in the following paragraphs, is shown in .
Figure 2. Block diagram of the method.
2.2. Choice and digital structuring of the elements to be surveyed
The elements to be surveyed were defined in two tables, each divided into fields that exhaustively report the data recorded during the survey.
The first table (Table A) identifies the initial vulnerability class and has four fields:
Masonry type;
Year of construction or presumed age
Use
Notes
The first field was associated with the same attributes of of the guidelines:
Masonry – dry rough-hewn stone
Masonry – unbaked bricks
Masonry – wet rough-hewn stone
Masonry – large stone for monumental constructions
Masonry – shaped stone
Masonry – brickwork and high-stiffness floor assemblies
Masonry – reinforced
The year of construction or presumed age and use were added when, during the census phase, it was impossible to visually define the field Masonry type. The year of construction is indicated with a certain date and the presumed age with a time interval. Instead the following attributes were associated with the field Use:
Residential
Industrial
Artisanal
Agricultural
Public
The second table (Table B) is used to record the elements that will identify the structural deficiencies and weaknesses during the census. It is divided into the following fields, together with the corresponding alphanumeric attributes:
Height of building and/or number of stories above ground:
Decimal number;
Building context:
Isolated building; attached/adjacent building;
Planimetric geometry:
Square; rectangular; irregular;
Roof:
Flat; one-pitched; dual-pitched; four-pitched;
Conventional resistance:
Planimetric regularity; height regularity; irregularity; thinness; distribution of loads;
Horizontal load-bearing structures:
Wooden floors; steel and brick floors; reinforced concrete floors;
Roof load-bearing structures:
Wooden roofs; reinforced concrete roofs; steel and brick roofs;
Degradation:
Detachment of plaster, coverings; falling tiles; falling cornices, parapets; falling other internal or external objects;
Damage mechanisms of walls (inside and outside plan):
Flexural; sliding shear; shear; crushing; simple overturning; compound overturning;
Damage mechanisms of floor assemblies and roofs:
Thrusting roofs; thrusting and hammering of the roof near the openings; ridge beam hammering; rigid connections at the top associated with poorly resistant elements on the façade; height eccentricities; floor detachments/displacements.
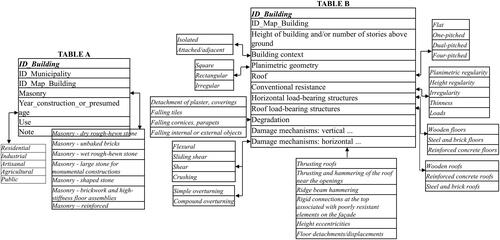
The key field identifying the Municipality according to the Italian toponymy has been added to Table A while the key field (ID_Building, in bold italics) and the field identifying the building on the map (ID_Map_Building) have been added to both tables. A representation of the two tables with their respective fields and attributes (in italics) is shown in .
Figure 3. Representation of Tables A and B with their respective fields and attributes (in italics).
The choice of fields and attributes in Table B was made on the basis of the following considerations:
height: it influences the oscillation period and therefore the dynamic amplification produced by an earthquake (Gatti Citation2020, Citation2023); in Italy, masonry buildings with more than three floors above ground are prohibited ();
geometric irregularity in plan and height: they influence the structural stiffness ();
attached/adjacent buildings: they are more vulnerable to hammering than isolated ones ();
roof geometry: four-pitched roofs produce thrusts on the walls, dual-pitched ones hammering on the gables;
thinness: it reduces the resistance of the walls ();
anomalous loads: they amplify seismic forces;
floor assemblies in wood, iron or concrete: the first two have almost nil flexural rigidity in their plane or lack of connections with the walls; the third ones have infinite flexural stiffnesses and bond beams. These characteristics influence the overall box-like behavior (walls and floors) of the building ();
degradation in the walls or detached elements: they indicate lack of or poor maintenance or construction quality;
damage mechanisms within plan and outside plan of walls and roofs: they involve or may involve obvious or hidden structural failures ().
Figure 4. Exemplary drawings and photographs of some elements defined in .
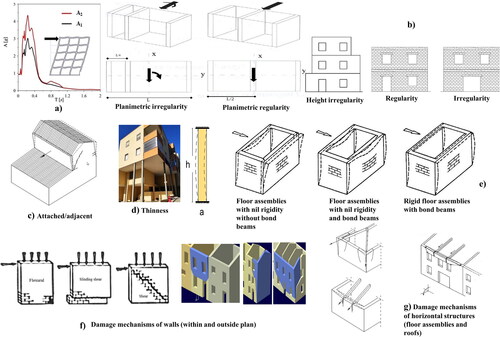
shows exemplary drawings and photographs of some elements defined in .
2.3. Basic cartography
To support the survey and census of the building classes, a basic numerical cartography was created, in vector format, in which buildings, streets, house numbers and water bodies are represented. These entities are reported as points, lines and polygons. An identifier (ID_Map_Building) is associated with the polygons, which represent the perimeter of the buildings. They are easily obtained for urban areas from regional topographic databases (DBT). A digital terrain model (DTM) was also added to the cartography.
2.4. Rapid survey
The field activity was supported by easily obtained hardware devices (tablets, smartphones, laptops, etc.) onto which is imported the basic cartography drawn from the Google Earth app and Tables A and B which can be edited by a spreadsheet. The operator identified the building on the map and recorded its identifier in the tables; with the aid of the dictionaries he brought up from a drop-down menu the appropriate element and inserted it into the corresponding field. In this way it was possible to conduct a survey which, even from the outside, was rapid, complete and exhaustive.
2.5. Identification of the seismic risk class
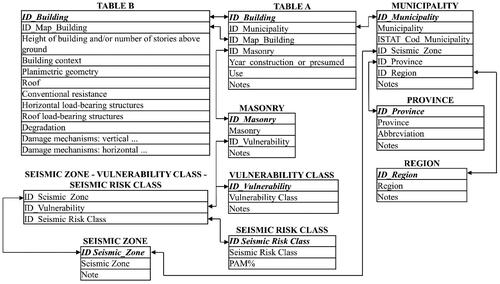
The data contained in Tables A and B were transferred to a Database Management System (DBMS) whose conceptual Entity–Relationship model (or ER model; Codd Citation1970, Citation1972a,Citationb) is described in . The ER model does not modify the properties of the DBMS but eliminates the redundancy of information, simplifying the execution of the ‘queries’. The tables Masonry, Vulnerability Class, Seismic Zone and Seismic Risk Class have been added to them, with the corresponding PAM (from the Guidelines) and the tables Municipality, Province and Region, containing the names of the municipalities, provinces and regions of Italy. The model was completed by the many-to-many connection table Seismic Zone–Vulnerability Class–Seismic Risk Class. The relationships, indicated by arrows, have been placed in correspondence with the key fields which are highlighted in italics and bold.
Figure 5. Entity–relationship model (or ER model) of the DBMS.
To identify the seismic risk class of a building, ‘queries’ were created in SQL language.
Queries 1–3 determine the final vulnerability class for each building:
Query 1: selection query on the field Id_Masonry of the table Masonry in relation to Table A to identify the blank records in which, during the survey, it was not possible to visually record the masonry type, which instead is assigned via the year of construction or presumed age;
Query 2: query to create a table by crossing the fields of Tables A’ (A modified by ‘query 1’), Masonry and Vulnerability Class in relation to each other, which assigns the initial vulnerability class to the buildings ();
Query 3: query of research and counting on the fields of Table B (indicated in and displayed in bold in in relation to the Table created by query 2) comparing the records stored with the strings reported in row 2 and exemplified in the pictures of row 3 of the same table.
Figure 6. Diagrams of some of the described queries and corresponding tables.
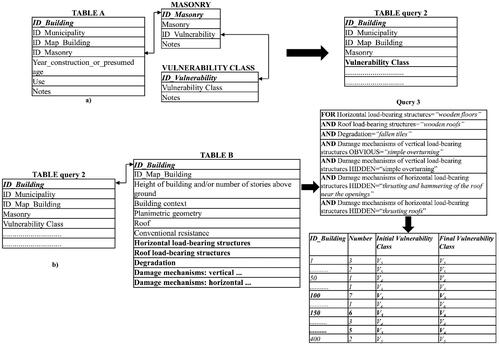
Table 3. Elements of the shift from the initial vulnerability class to the final one.
For each building, the result of the query is a number representing the strings equal to those stored in the records: if this number is greater than or equal to 5, it is assumed that the building has a shift to the next vulnerability class, which will constitute its final vulnerability class (in practice the records are substituted in the field vulnerability class). If less than 5, the vulnerability class calculated with query 2 is maintained. For buildings with an initial vulnerability class of V6, there is no shift ().
Finally, the subsequent queries attribute the seismic risk class and the corresponding PAM to the building:
Query 4: cross-field selection query on the field Municipality of the table Municipality in relation to Table A and the table Seismic Zone, which assigns the municipality to the building and to it the seismic zone;
Query 5: cross-field selection query on the field Vulnerability_Class of the table created by query 2 in relation, via the many-to-many connection table Seismic Zone–Vulnerability Class–Seismic Risk Class, to the table Seismic Risk Class, which assigns the seismic risk class and corresponding PAM to the building.
Diagrams of some of the queries with the corresponding tables in relation to each other are schematized in .
3. Case study
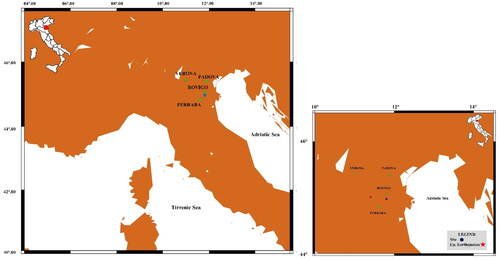
To test the method, a small municipality in north-eastern Italy of ca. 2,000 inhabitants was chosen, with an extension of approximately 20 km2 and an urban area of ca. 1,000 buildings made of masonry, wood and reinforced concrete. It had suffered a seismic sequence that lasted about 15 days (with events of Ml 4.2–4.3 in the epicentral area, about 30 km away). This led the municipal administration to implement an economic incentive plan to assess and prevent seismic risk in private buildings. shows the area under study with the epicenter of the earthquake indicated.
Figure 7. Area under study with the epicenter of the earthquake indicated.
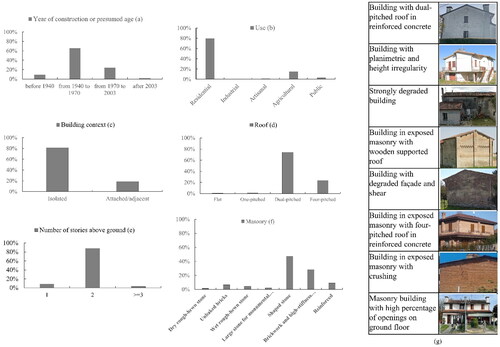
The survey of the masonry buildings was conducted on 2 days, for a total of ca. 400 buildings (mean 200 per day). A priori knowledge of a few elements regarded the urban development of the town; hence all the data collected during the survey were strategic for the municipality’s intentions. The queries made to the DBMS revealed that the buildings dated mainly from 1940 to 1970 (65%): some outside the town (ca. 25%) were built after 1970 and of them only 2% after 2003, the year in which the first recent standard for seismic constructions was issued in Italy (). The principal use (80%) is residential, with 15% of buildings for agricultural use (). The buildings are almost exclusively single and isolated (only those located in the center of the town are attached/adjacent – ). They are characterized by regular shapes, square or rectangular with small dimensions, the majority of which are regular in both planimetry and height. The roofs are mainly dual-pitched (70%), the rest being four-pitched (). The prevalent number of stories above ground is 2 (88%), with 9% having 1 story and only 3% having 3 or more (). The buildings are characterized by shaped stone slabs and lime mortar (more than 80%), while the inter-story floor and roof assemblies are mainly of reinforced concrete and steel and brick (ca. 70%) or of wood (ca. 30%) (). The most common damage mechanisms in the walls within plan were shear and sliding shear, while the roofs were more exposed to hammering of the ridge beam. shows some images of the surveyed buildings.
Figure 8. Summary of the main structural types with some photographs.
For attribution of the vulnerability class, the same fields and strings reported in rows 1 and 2 of were chosen. Thus, 88 buildings of the total reported more than 5 elements of shift to the next class: of these 74 underwent a shift from vulnerability class V5 to V6, 10 from V4 to V5, and 4 from V3 to V4.
In summary, all buildings had a vulnerability class between V3 and V6 (),
Figure 9. Final vulnerability class (a) and seismic risk class (b) based on the percentage of masonry buildings surveyed.
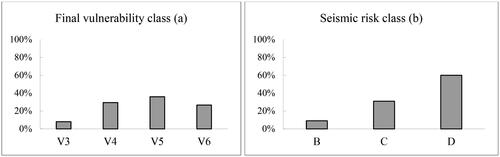
with the highest percentage (63%) between V5 and V6. Since the municipality is located in seismic zone 3, the prevalent seismic risk classes are B, C and D (the latter being the most common with a percentage of 60%, ); the corresponding PAM varies between 1% and 3.5% ().
Table 4. Seismic risk classes and corresponding PAM as a function of the percentage of masonry buildings surveyed.
The tables of the DBMS were loaded into a GIS on an open-source platform whose cartographic database, the same one used for the survey, was imported from the topographic database (DBT) of the Veneto region (Regione Veneto Citation2004). It consists of three types of files (in ESRI standard): a file with .shp extension (shape file) in which are found the coordinates of the vertices of the polygons or of the lines or points of the mentioned elements; a file with .dbf extension (in which are stored their attributes-fields) and a file with .shx extension, which serves as an index between the attributes and coordinates. The cartographic elements consist of buildings, streets, house numbers, water bodies, etc. A digital terrain model (DTM) created from data acquired from the LiDAR platform was added to the cartographic database.
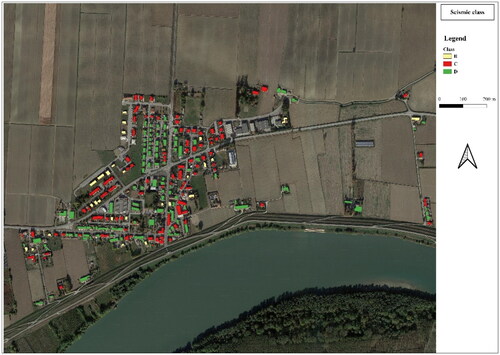
Some thematic maps were extracted from the GIS, including a 1:5000 scale map () cataloging the buildings of the town center according to seismic risk class.
Figure 10. 1:5000 scale map showing the cataloging of buildings according to seismic risk class.
4. Comparisons
The proposed method was compared with the conventional method proposed by the Guidelines and with the Cartis forms of the above-mentioned ReLUIS project. Among the preliminary operations leading to the classification (survey and calculation) and the final result (), common parameters for comparison were identified; they are reported in the second column of the table, while the third, fourth and fifth columns report the comparisons.
Table 5. Comparisons between the proposed simplified method and the rigorous conventional and Cartis form methods.
As can be seen from , the differences, which constitute the benefits of the proposed method, are evident in Survey and Calculation; they involve the larger quantity of buildings surveyed with a single operator and the data processing which, when fully operational, is completely automatic. The limitation lies in a simplified result.
5. Conclusions
The proposed method consists of a rapid visual survey (in the test phase, a single operator recorded ca. 200 buildings/day) during which the building, located directly on the map in a precise cartographic database, is recorded from the outside.
The masonry type and structural weaknesses are recorded on a computer in tables in which the alphanumeric attributes of their fields are inserted automatically with drop-down menus.
The transfer to a DBMS occurs directly without affecting or modifying its structure and informational integrity, and thus the subsequent processing, facilitated by the SQL language, occurs without pre-treatments.
The choice of the structural weaknesses necessary to define the shift to the final vulnerability class was enriched by the introduction of new evaluation elements linked to the onsite conditions; hence, even within the context of a simplified seismic classification, this step is more rigorous than that provided by the tables of the Guidelines.
The large amount of information recorded is not necessarily limited to the seismic census and provides great value in making up for the previous lack of knowledge of the structural characteristics of the municipality’s buildings.
The limitations lie in the lack of numerical calculations, not attributable to the proposed method but to the simplified classification method (Braga et al. Citation2017). Nonetheless, these limitations are compensated by the advantages deriving from a preventive assessment of large-scale seismic risk.
Regarding the case study, it was found that the majority of buildings have, in relation to the seismic zone, the highest seismic risk class. Thus, a map was extracted visualizing those requiring priority interventions.
Finally, the GIS facilitates the implementation of economic incentives for the execution of works to mitigate the seismic risk of the municipality’s buildings, while it also involves other regional authorities in the definition of risk or damage scenarios.
Acknowledgments
Special thanks go to Dr. Francesca Ghirardi for her help with the rapid visual surveying of the masonry buildings.
Data availability statement
The data processed by the author in this paper are available upon request to him.
Disclosure statement
The author does not have a relevant conflict of interest to declare for this article.
References
- Ademović N, Kalman Šipoš T, Hadzima-Nyarko M. 2020. Rapid assessment of earthquake risk for Bosnia and Herzegovina. Bull Earthquake Eng. 18(5):1835–1863. doi: 10.1007/s10518-019-00775-1.
- Alam MN, Tesfamariam S, Alam MS. 2013. GIS-based seismic damage estimation: case study for the City of Kelowna, BC. Nat Hazards Rev. 14(1):66–78. doi: 10.1061/(ASCE)NH.1527-6996.0000082.
- Albayrak U, Canbaz M, Albayrak G. 2015. A rapid seismic risk assessment method for existing building stock in urban areas. Proc Eng. 118:1242–1249. doi: 10.1016/j.proeng.2015.08.476.
- Arkan E, Işık E, Harirchian E, Topçubaşı M, Avcil F. 2023. Architectural characteristics and determination seismic risk priorities of traditional masonry structures: a case study for Bitlis (Eastern Türkiye). Buildings. 13(4):1042. doi: 10.3390/buildings13041042.
- Arkan E, Işik E, Avcil F, İzol R, Büyüksaraç A. 2023. Seismic damages in masonry structural walls and solution suggestions. Acad Platform J Nat Hazards Disaster Manage. 4(2):49–64. doi: 10.52114/apjhad.1400644.
- Barbat AH, Carreño ML, Pujades LG, Lantada N, Cardona OD, Marulanda MC. 2010. Seismic vulnerability and risk evaluation methods for urban areas. A review with application to a pilot area. Struct Infrastruct Eng. 6(1–2):17–38. doi: 10.1080/15732470802663763.
- Bernardini A, Lagomarsino S, Mannella A, Martinelli A, Milano L, Parodi S. 2010. Forecasting seismic damage scenarios of residential buildings from rough inventories: a case-study in the Abruzzo Region (Italy). Proc Inst Mech Eng O: J Risk Reliab. 224(4):279–296. doi: 10.1243/1748006XJRR305.
- Braga F, Morelli F, Picchi C, Salvatore W. 2017. Development of a macroseismic model for the seismic risk classification of existing buildings. Proceedings XVII Congress ANIDIS Earthquake Engineering in Italy; Sep 17–21; Pistoia, Italy. p. 13–22.
- Cacace F, Zuccaro G, De Gregorio D, Perelli FL. 2018. Building inventory at national scale by evaluation of seismic vulnerability classes distribution based on census data analysis: BINC procedure. Int J Disaster Risk Reduct. 28:384–393. doi: 10.1016/j.ijdrr.2018.03.016.
- Calderoni B, Sandoli A, Cordasco EA. 2017. Quick assessment of the seismic vulnerability of Italian urban centers: typological and structural classification of the existing masonry and r.c. buildings. Struct Mag. 210:1–22.
- Ceroni F, Caterino N, Vuoto A. 2020. Simplified seismic vulnerability assessment methods: a comparative analysis with reference to regional school building stock in Italy. Appl Sci. 10(19):6771. doi: 10.3390/app10196771.
- Codd EF. 1970. A relational model of data for large shared data banks. Inform Retrieval. 13(6):377–387.
- Codd EF. 1972a. Relational completeness of data base sublanguages. San Jose, California: IBM Research Laboratory; p. 65–98.
- Codd EF. 1972b. Further normalization of the data base relational model. In: Rustin RJ, editor. Data base system: courant computer science symposia series 6. Prentice Hall.
- Cosenza E, Del Vecchio C, Di Ludovico M, Dolce M, Moroni C, Prota A, Renzi E. 2018. The Italian guidelines for seismic risk classification of constructions: technical principles and validation. Bull Earthquake Eng. 16(12):5905–5935. doi: 10.1007/s10518-018-0431-8.
- D’Amato M, Laguardia R, Di Trocchio G, Coltellacci M, Gigliotti R. 2022. Seismic risk assessment for masonry buildings typologies from L’Aquila 2009 earthquake damage data. J Earthquake Eng. 26(9): 4545–4579.
- Dou CE, Jia YH, Xie HQ. 2012. Construction and information management of Lianyungang emergency shelters for earthquake disaster based on GIS. AMR. 610–613:3624–3627. doi: 10.4028/www.scientific.net/AMR.610-613.3624.
- Fallah-Aliabadi S, Ostadtaghizadeh A, Ardalan A, Eskandari M, Fatemi F, Mirjalili MR, Khazai B. 2020. Risk analysis of hospitals using GIS and HAZUS: a case study of Yazd County, Iran. Int J Disaster Risk Reduct. 47:101552. doi: 10.1016/j.ijdrr.2020.101552.
- Ferreira TM, Vicente R, Varum H. 2014. Seismic vulnerability assessment of masonry facade walls: development, application and validation of a new scoring. Struct Eng Mech. 50(4):541–561. doi: 10.12989/sem.2014.50.4.541.
- Garavaglia E, Angjeliu G, Cardani G. 2023. Simplified seismic vulnerability analysis of historic residential buildings with fragility curves. Proc Struct Integrity. 44:155–162. doi: 10.1016/j.prostr.2023.01.021.
- Gatti M. 2020. Relation between dynamic amplification, structural height and damage in buildings affected by the recent Italian earthquakes. Geomat Nat Hazards Risk. 11(1):1154–1174. doi: 10.1080/19475705.2020.1778107.
- Gatti M. 2023. Structural height, amplification and damages during the superficial earthquakes at Casamicciola, Ischia Island (2017), and Santa Venerina, Catania (2018), Italy. Geomat Nat Hazards Risk. 14(1):2182172. doi: 10.1080/19475705.2023.2182172.
- Grünthal G. 1998. European macroseismic scale 1998. Luxembourg: Centre Europèen de Géodynamique et de Séismologie.
- Hashemi M, Alesheikh AA. 2011. A GIS-based earthquake damage assessment and settlement methodology. Soil Dyn Earthquake Eng. 31(11):1607–1617. doi: 10.1016/j.soildyn.2011.07.003.
- Huang M, Zhang D, Li P, Zhang Y, Zhang R. 2017. Study of earthquake disaster prediction system of Langfang city based on GIS. IOP Conf Ser: Mater Sci Eng. 224(1):012049. doi: 10.1088/1757-899X/224/1/012049.
- Irwansyah E, Hartati S. 2014. Assessment of building damage hazard caused by earthquake: integration of FNN and GIS. IERI Proc. 10:196–202. doi: 10.1016/j.ieri.2014.09.077.
- Işık E. 2023. Structural failures of adobe buildings during the February 2023 Kahramanmaraş (Türkiye) earthquakes. Appl Sci. 13(15):8937. doi: 10.3390/app13158937.
- Işık E, Avcil F, Büyüksaraç A, İzol R, Arslan MH, Aksoylu C, Harirchian E, Eyisüren O, Arkan E, Güngür M, et al. 2023. Structural damages in masonry buildings in Adıyaman during the Kahramanmaraş (Turkiye) earthquakes (Mw 7.7 and Mw 7.6) on 06 February 2023. Eng Fail Anal. 151:107405. doi: 10.1016/j.engfailanal.2023.107405.
- ISTAT. 2011. Permanent census of population and housing, https://www.istat.it/it/censimenti-permanenti.
- Jefferson TL, Johannes TW. 2016. Using geographic information systems to support decision making in disaster response. IDT. 10(2):193–207. doi: 10.3233/IDT-160255.
- Khemis A, Athmani A, Ademović N. 2023. Rapid application of the RISK-UE LM2 method for the seismic vulnerability analysis of the Algerian masonry buildings. Int J Architect Heritage. 18(5):788–808. doi: 10.1080/15583058.2023.2195379.
- Kun Y, Quan-Li X, Shuang-Yun P, Yan-Bo C. 2006. The design and implementation of urban earthquake disaster loss evaluation and emergency response decision support systems based on ArcGIS. IEEE International Symposium on Geoscience and Remote Sensing; p. 892–895.
- Lagomarsino S, Giovinazzi S. 2006. Macroseismic and mechanical models for the vulnerability and damage assessment of current buildings. Bull Earthquake Eng. 4(4):415–443. doi: 10.1007/s10518-006-9024-z.
- Laguardia R., D’Amato, M., Coltellacci, M., Di Trocchio, G., and Gigliotti, R. 2023. Fragility curves and economic loss assessment of RC buildings after L’Aquila 2009 earthquake. J Earthquake Eng. 27(5): 1126–1150.
- Leggieri V, Mastrodonato G, Uva G. 2022. GIS multisource data for the seismic vulnerability assessment of buildings at the urban scale. Buildings. 12(5):523. doi: 10.3390/buildings12050523.
- Lestuzzi P, Podestà S, Luchini C, Garofano A, Kazantzidou-Firtinidou D, Bozzano C, Bischof P, Haffter A, Rouiller J-D. 2016. Seismic vulnerability assessment at urban scale for two typical Swiss cities using Risk-UE methodology. Nat Hazards. 84(1):249–269. doi: 10.1007/s11069-016-2420-z.
- Liebenberg K, Smit A, Coetzee S, Kijko A. 2017. A GIS approach to seismic risk assessment with an application to mining-related seismicity in Johannesburg, South Africa. Acta Geophys. 65(4):645–657. doi: 10.1007/s11600-017-0052-7.
- Maio R, Ferreira TM, Vicente R, Estêvão J. 2016. Seismic vulnerability assessment of historical urban centres: case study of the old city centre of Faro, Portugal. J Risk Res. 19(5):551–580. doi: 10.1080/13669877.2014.988285.
- Meroni F, Squarcina T, Pessina V, Locati M, Modica M, Zoboli R. 2017. A damage scenario for the 2012 Northern Italy earthquakes and estimation of the economic losses to residential buildings. Int J Disaster Risk Sci. 8(3):326–341. doi: 10.1007/s13753-017-0142-9.
- Milani G, Valente M. 2015. Failure analysis of seven masonry churches severely damaged during the 2012 Emilia-Romagna (Italy) earthquake: non-linear dynamic analyses vs conventional static approaches. Eng Fail Anal. 54:13–56. doi: 10.1016/j.engfailanal.2015.03.016.
- Milani G, Valente M. 2016. Seismic assessment of historical masonry towers by means of simplified approaches and standard FEM. Constr Build Mater. 108:74–104. doi: 10.1016/j.conbuildmat.2016.01.025.
- Ministerial Decree no. 58 28/2/2017 Allegato A e B: linee Guida per la classificazione del rischio sismico delle costruzioni (in Italian). Italian Ministry of Infrastructure and Transport, Italy (in Italian).
- Ministerial Decree no. 65 7/3/2017 Allegato A e B: linee Guida per la classificazione del rischio sismico delle costruzioni (in Italian). Italian Ministry of Infrastructure and Transport, Italy (in Italian).
- Mussumeci G, Falchi U, Condorelli A. 2004. Data survey and management techniques in civil protection emergencies. In XX Congress of International Society of Photogrammetry and Remote Sensing (ISPRS), Istanbul.
- Neves F, Costa A, Vicente R, Oliveira CS, Varum H. 2012. Seismic vulnerability assessment and characterisation of the buildings on Faial Island, Azores. Bull Earthquake Eng. 10(1):27–44. doi: 10.1007/s10518-011-9276-0.
- NTC. 2018. Norme tecniche per le costruzioni. Italy: Italian Ministry of Infrastructure and Transport (in Italian).
- OPCM 3274. 2003. Ordinanza del Presidente del Consiglio dei Ministri n. 3274. Primi elementi in materia di criteri generali per la classificazione sismica del territorio nazionale e di normative tecniche per le costruzioni in zona sismica (in Italian).
- Polese M, d’Aragona MG, Prota A. 2019. Simplified approach for building inventory and seismic damage assessment at the territorial scale: an application for a town in southern Italy. Soil Dyn Earthquake Eng. 121:405–420. doi: 10.1016/j.soildyn.2019.03.028.
- Regione Veneto. 2004. DB Topografico relaise 2.6. L.R. 16/07/1976 n. 28 Formazione della Carta Tecnica Regionale (in Italian).
- Ricci P, Verderame GM, Manfredi G, Pollino M, Borfecchia F, De Cecco L, Martini S, Pascale C, Ristoratore E, James V. 2011. Seismic vulnerability assessment using field survey and remote sensing techniques. In Proceedings, Part II 11 (109–124) International Conference of Computational Science and its Applications – ICCSA; June 20–23, 2011; Santander, Spain. Berlin Heidelberg: Springer.
- Sandoli A, Calderoni B. 2018. Assessment of the seismic vulnerability at territorial scale: a new structural–typological classification of existing buildings and definition of fragility curves. In: Proceedings of the 10th International Masonry Conference; 9–11 July 2018; Milan, Italy. p. 153–168.
- Sauti NS, Daud ME, Kaamin M, Sahat S. 2021. GIS spatial modelling for seismic risk assessment based on exposure, resilience, and capacity indicators to seismic hazard: a case study of Pahang, Malaysia. Geomat Nat Hazard Risk. 12(1):1948–1972.
- Šipoš TK, Hadzima-Nyarko M. 2017. Rapid seismic risk assessment. Int J Disaster Risk Reduct. 24:348–360. doi: 10.1016/j.ijdrr.2017.06.025.
- Vicente R, Parodi S, Lagomarsino S, Varum H, Silva JM. 2011. Seismic vulnerability and risk assessment: case study of the historic city centre of Coimbra, Portugal. Bull Earthquake Eng. 9(4):1067–1096. doi: 10.1007/s10518-010-9233-3.
- Zhai Y, Chen S, Ouyang Q. 2019. GIS-based seismic hazard prediction system for urban earthquake disaster prevention planning. Sustainability. 11(9):2620. doi: 10.3390/su11092620.
- Zuccaro G, Cacace F, De Gregorio D. 2012. Buildings inventory for seismic vulnerability assessment on the basis of Census data assessment at national and regional scale. 15th World Conference on Earthquake Engineering; Lisbon, Portugal, Vol. 1–10.
- Zuccaro G, Cacace F. 2015. Seismic vulnerability assessment based on typological characteristics. The first level procedure “SAVE”. Soil Dyn Earthquake Eng. 69:262–269. doi: 10.1016/j.soildyn.2014.11.003.
- Zuccaro G, Dolce M, Perelli FL, De Gregorio D, Speranza E. 2023. CARTIS: a method for the typological-structural characterization of Italian ordinary buildings in urban areas. Front Built Environ. 9:ISSN 2297-3362. doi: 10.3389/fbuil.2023.1129176.