
 ?Mathematical formulae have been encoded as MathML and are displayed in this HTML version using MathJax in order to improve their display. Uncheck the box to turn MathJax off. This feature requires Javascript. Click on a formula to zoom.
Abstract
This research aimed to evaluate flood hazards and risk areas in the Gidabo Watershed using remote sensing (RS), Geographic Information Systems (GIS), and analytical hierarchy process (AHP). Six main factors were considered to identify flooding hazard zones: drainage density (DD), soil, elevation, rainfall, slope, and land use land cover (LULC). Population density, flood hazard zone, and LULC were considered for mapping the flood risk zone in the Gidabo watershed. A weighted overlay analysis tool has been utilized to integrate the thematic layers to identify both flood hazard and flood risk zones. The findings indicated that about 41.6% (337 km2) of the watershed falls within the high and very high flooding hazard zones. Conversely, 31.11% (252 km2) of the watershed is categorized under very-low and low flooding hazards. Moreover, the study identified five flood risk zones in the area viz; very high, high, moderate, low, and very low. The result of the flood risk map revealed that 199.5 km2 (24.5%) of the watershed has a higher and very higher risk of flooding. These zones were validated using the receiver operating characteristic (ROC) curve, showing a correlation coefficient of 0.943. These results emphasize the need to implement prediction of floods, early warning systems, and effective management practices on a regular and sustainable basis.
1. Introduction
Floods are incredibly destructive natural disasters that occur in both rural and urban areas, causing extensive damage to people, livelihoods, and infrastructure (Chen et al. Citation2009; Fernández and Lutz Citation2010). The frequency of flood events has significantly increased globally over the past three decades (Hdeib et al. Citation2018; Vishnu et al. Citation2019; Sajinkumar et al. Citation2022). The rise in global flooding is attributed to various factors, such as changes in rainfall patterns, an increase in extreme weather events, alterations in land use, and population growth (Sarmah and Das Citation2018). Additionally, rapid urbanization without proper spatial planning has resulted in the occupation of unsuitable areas, including river banks and floodplains, which are prone to flooding (Tsakiris Citation2014).
The proliferation of artificial surfaces can significantly impact runoff characteristics, leading to an increase in submerged areas during floods. This alteration in natural processes poses a particular challenge for developing countries, which often have limited resources for recovery and repairs in the aftermath of natural disasters (Allafta and Opp Citation2021). Ethiopia, in particular, has been grappling with the recurring issue of floods, which profoundly impact both lives and livelihoods (Nigusse and Adhanom Citation2019). Floods in the country primarily occur in floodplains, where most rainfall occurs during the wet months (Dadi and Gumi Citation2020; Melkamu et al. Citation2022).
In recent years, Ethiopia experienced a devastating flash flood in the countryside, resulting in extensive damage to infrastructure and agriculture, as well as tragic loss of life (Desalegn and Mulu Citation2020). While it may not be possible to prevent these hazards entirely, implementing appropriate mitigation measures can help reduce the severity of the disaster and its consequences. Therefore, it is crucial to address these challenges and find sustainable solutions to mitigate the impact of floods in the country, protect communities, and minimize the destruction caused by these natural disasters.
Various methods have been utilized in different parts of the world to identify flood hazards and risk zones. These include hydrodynamic modeling (Liu et al. Citation2012), hydrological and hydrodynamic models (Ullah et al. Citation2016), Artificial Neural Network (ANN) (Dixon Citation2005; Kia et al. Citation2012; Rahmati et al. Citation2016), multi-criteria decision analysis (MCDA) (Nigusse and Adhanom Citation2019; Feloni et al. Citation2020), and analytical hierarchy process (AHP) (Chakraborty and Mukhopadhyay Citation2019; Goumrasa et al. Citation2021; Ikirri et al. Citation2022; Burayu et al. Citation2023; Mokhtari et al. Citation2023; Nair et al. Citation2023; Senan et al. Citation2023). These approaches were employed to assess and understand the potential risks associated with flooding.
Geographic information systems (GIS) and remote sensing (RS) technologies offer quick access to satellite data and efficient management of large amounts of data to identify different indicators across various dimensions (Chen et al. Citation2015; Tehrany et al. Citation2015; Melkamu et al. Citation2022). These technologies have become commonly used in investigating multi-dimensional issues like mapping areas prone to flood-related problems, considering both spatial and temporal dimensions (Santos et al. Citation2017). To address the vulnerability of certain areas to flooding, an integrated approach combining RS and GIS can be employed (Moazzam et al. Citation2018; Twumasi et al. Citation2020; Raufu et al. Citation2023).
In Ethiopia, some scholars have conducted studies on flood hazards, vulnerability, and risk analysis using geospatial technologies like RS and GIS techniques. For instance, studies conducted in Lower Awash Sub-basin, Ethiopia (Wondim Citation2016), Ambo Town and its watershed, West shoa zone, Oromia regional State, Ethiopia (Ogato et al. Citation2020), Around Adigrat, Tigray Region, Northern Ethiopia (Nigusse and Adhanom Citation2019), Fetam watershed, upper Abbay basin, Ethiopia (Desalegn and Mulu Citation2020), Southern Oromia region (Burayu et al. Citation2023) and Jimma City, southwestern Ethiopia (Weday et al. Citation2023), and upper Awash River basin, Ethiopia (Hagos et al. Citation2022) are a few studies examined flood-prone areas in the country.
The Gidabo watershed within the Rift Valley basin has experienced recurrent flooding, leading to significant economic losses and impacting numerous individuals. Despite the lack of previous investigations on flood hazards and risk zones in the Gidabo watershed, this study aims to fill that gap by specifically focusing on this area. Therefore, the objective of this study is to utilize GIS, RS, and AHP techniques to detect flood hazards and zones of risk in the Gidabo watershed. To attain this objective, thematic layers of criterion that influence flood hazard and risk, such as drainage density, rainfall, elevation, soil, land use land cover (LULC), slope, and population density, were considered in this study. The flood hazard and risk zone were generated using weight overlay analysis. This study will be useful for decision-makers and managers in designing early warning systems and flood hazard reduction measures.
2. Material and methods
2.1. Study area description
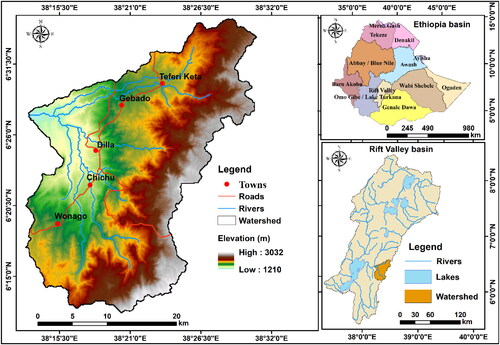
The area of research is situated in the Rift Valley of Ethiopia, covering approximately 809.9 km2. It is bounded by Oromia, Sidama, and Southern Nations & Nationalities Peoples (SNNP) regional states and eight different districts like Aleta wondo, Chuko, Dera, Dilla zuria, Wenago, Abaya, Hula, and Bule. The coordinates of the area range from 6° 10′ 30″ to 6° 36′ 00″ N and 38° 10′ 00″ to 38° 32′ 00″ E (). The watershed elevation varies from 1210 to 3032 m above sea level. Various LULC types can be found within the study area, including wetlands, barren land, agroforestry, built-up areas, agricultural land, and scrub forests. The dominant LULC type in the watershed is scrub forest, covering an area of 343.3 km2 (42.4%), followed by agroforestry with a coverage of 229.1 km2 (28.29%). Agricultural land occupies 128.35 km2 (15.8%) of the watershed, while built-up areas cover 69.4 km2 (8.6%). Barren land accounts for 38.8 km2 (4.8%), and the wetland covers 0.95 km2 (0.11%) of the watershed.
Figure 1. Study area map.
2.2. Data
Different data are collected from various sources to achieve the research objective. For instance, SRTM DEM (30 × 30 m resolution) and Landsat 8 OLI/TIRS (30 × 30 m resolution) were downloaded from the US Geological Survey (https://earthexplorer.usgs.gov/). The rainfall data, with higher-resolution gridded data, 0.5°×0.5°, was attained from Climatic Research Unit gridded time series version 4 (https://crudata.uea.ac.uk/cru/data/hrg/cru_ts_4.06/). Soil data was attained from the Ministry of Water, Irrigation, and Energy.
2.3. Methods of analysis
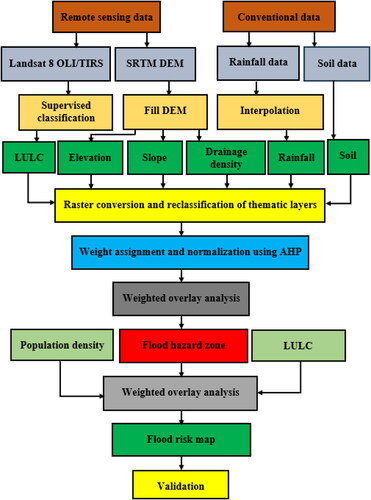
To assess the flood hazard zone in the Gidabo watershed, researchers examined six key factors: soil type, rainfall, slope, elevation, drainage density, and LULC. These factors were selected based on a literature review (Desalegn and Mulu Citation2020; Ogato et al. Citation2020) and expert input. To analyze the data, all thematic layers (slope, elevation, rainfall, LULC, drainage density, and soil types) were converted into raster format using the rasterization conversion tool in ArcGIS. These raster maps were then projected into the UTM zone 37 WGS 84. The factors were categorized into sub-factors according to their susceptibility to flood hazards. Classes were assigned ranks 1, 2, 3, 4, and 5 (representing very low, low, moderate, high, and very high vulnerability) (Allafta and Opp Citation2021). A weighted overlay technique combined all the parameters and generated the flood hazard zone. Three controlling factors have been considered to identify the risk zone of flood of the watershed: population density, LULC, and the layer of flood hazard. The overall methodology used in this research is summarized in .
Figure 2. Methodology flowchart.
2.3.1. Factors controlling flood hazard
Slope: Gradient plays a crucial role in determining the water flow speed and duration. On flatter surfaces, water moves more slowly and stays longer, making these types of areas much more prone to flooding than steeper surfaces (Gigović et al. Citation2017; Rimba et al. Citation2017). The slope layer of the area was created using SRTM DEM in ArcGIS and ranged from 0 to 64 degrees (). The slopes are categorized into five groups and ranked on the basis of their vulnerability to flooding hazards. Lower slope values indicate flat terrain highly susceptible to flooding, while values of higher slope point toward steeper terrain less vulnerable to flooding (Hagos et al. Citation2022). The category with the lowest slope value (0–11), ranked at 5, indicates a much higher susceptibility to flooding hazards, though the category with the highest slope value (46–64), ranked at 1, indicates a very low susceptibility ().
Figure 3. Slope (a), elevation (b), rainfall (c), LULC (d), drainage density (e), and soil map (f).
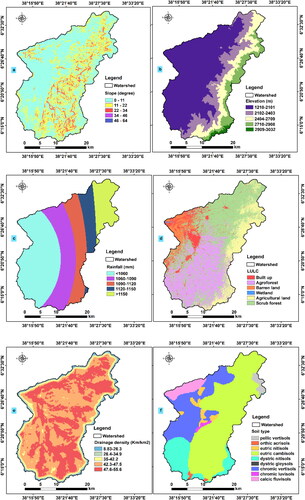
Table 1. Susceptibility level of sub-factors to flood hazard.
Elevation: Elevation plays an essential role in controlling the direction and depth of water levels during overflow (Gigović et al. Citation2017). The ArcGIS environment and DEM are utilized to create elevation raster layers. The elevation range varies from 1210 to 3032 and is manually categorized into five classes based on the opinion of an expert: very lower (1210–2101), lower (2102–2403), moderate (2404–2709), higher (2710–1908), and very higher (2909–3032) (). Higher elevations experience less flooding, while lower elevations are more susceptible to flooding hazards (Wondim Citation2016). To assess the susceptibility of elevation to flood hazards, they are also classified into five classes and ranked accordingly. The category for lowest elevation is ranked as 5, indicating a very high susceptibility to flooding, though the highest elevation is ranked as 1, indicating a very low susceptibility ().
Rainfall: Rainfall is one of the main causes that trigger floods (Lappas and Kallioras Citation2019; Hidayah et al. Citation2022). To develop the rainfall map, the rainfall layer of the watershed was generated using high-resolution gridded data with a resolution of 0.5° × 0.5°. The map has been formed by utilizing an inverse distance weighted (IDW) interpolation approach in ArcGIS (). The amount of rainfall directly affects the runoff that leads to flooding. Therefore, the more rainfall, the more the potential for flooding, and vice versa (Gazi et al. Citation2019). Accordingly, the highest annual rainfall (>1150) is given a rank of ‘5′ as it is more susceptible to flood hazards, while the lowest annual rainfall (<1060) is assigned the lowest score of ‘1′ ().
LULC: Understanding LULC is crucial for assessing surface runoff and potential flooding in a particular catchment (Khosravi et al. Citation2018; Areu-Rangel et al. Citation2019). To determine the LULC of the Gidabo watershed, Landsat 8 OLI/TIRS imagery was used, and a supervised classification method in ERDAS Imagine 2015 was applied. Different types of land use affect the rate of infiltration, with vegetated areas promoting infiltration, while residential and pasture areas hinder infiltration due to their impervious cover, leading to increased runoff and a higher risk of flooding (Athick et al. Citation2019; Athick and Shankar Citation2019; Lappas and Kallioras Citation2019). The study identified six LULCs in the area: built-up areas, agroforestry, agricultural land, wetland, barren land, and scrub forest (). These LULCs were further classified into five categories on the basis of their susceptibility to flood hazards, as shown in .
Drainage density: The drainage density of the watershed was determined using SRTM DEM in a GIS environment. It ranged from 8.83 to 55.6 km/km2 and was divided into five categories: very low (8.8–26.3), low (26.4–34.9 km/km2), moderate (35–42.2 km/km2), high (42.3–47.5 km/km2), and very high (47.6–55.6 km/km2) (). A higher drainage density suggests a greater runoff for the basin area, along with the erodible geologic materials, and a lower risk of flooding. Therefore, the rating for the density of drainage reduces as the drainage density rises (Raufu et al. Citation2023). Consequently, the drainage density at the lowest is ranked as 5, indicating the highest susceptibility to flood hazards, while the drainage density at the highest is ranked as 1, indicating a very low susceptibility to flood hazards ().
Soil type: The study area identifies nine primary soil classifications based on the Ethiopian Ministry of Water, Irrigation, and Energy’s hydrologic soil-grouping method. These include electric cambisols, acrisols, pellic vertisols, chromic vertisols, dystric gleysols, calcic fluvisols, dystric nitisols, chromic luvisols, and eutric nitisols (). When the soil’s ability to absorb water decreases, the risk of flooding increases. This leads to an increase in surface runoff when rainfall surpasses the capacity of soil to absorb it (Ouma and Tateishi Citation2014; Lei et al. Citation2020; Kamaraj et al. Citation2024). The soil characteristics such as infiltration and permeability rate directly affect the rainfall, turning into runoff (Rimba et al. Citation2017). To assess the susceptibility of the soil types to flooding, they were categorized into five classes. Pellic vertisols and chromic vertisols were assigned the highest weight of ‘5′, while eutric cambisols received the lowest weight of ‘1′ ().
2.3.2. Factors controlling flood risk
Population density: In order to determine the individuals’ number per sq km in the watershed, the gross population density calculation method is used. For this study, the human population estimation for the year 2020 in the watershed was taken into account (). The density has been reclassified to assess the population’s vulnerability to flood hazards based on the assumption that a higher population density indicates higher susceptibility (Wondim Citation2016). The highest population density category ranked at a value of 5, is considered very susceptible to flooding risk. Conversely, the lowest population density category, ranked at a value of 1, has a very lower susceptibility to flood risk ().
Figure 4. Population density map.
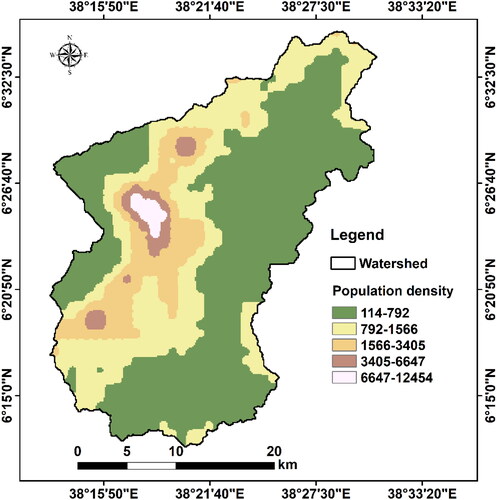
Table 4. Susceptibility level of sub-factors to flood risk.
Flood hazard zone: In the Gidabo watershed, flooding hazards were seen as one of the factors that increase the risk of flooding. To better understand this, the flood hazard zones () were categorized according to their vulnerability to flooding risk. The layer with a very high flood hazard was given a ranking of 5, indicating its high susceptibility to risk of flooding. Conversely, the layer with a very low flooding hazard has been ranked 1, indicating its low susceptibility to flooding risk ().
LULC: To analyze the risk of flooding in the area, the different land use classes, such as wetland, built-up, farmland, barren land, agricultural land, scrub forest, and agroforestry (), were grouped based on their vulnerability to flooding. A common scale was used to reclassify the types of land use in the sub-basin according to their sensitivity to flood risk ().
2.3.3. Analytical hierarchy process (AHP)
Pairwise comparison matrix: AHP is a decision-making approach that considers multiple objectives and criteria (Wind and Saaty Citation1980). It uses a pairwise comparison procedure to determine preferences among different options. AHP quantifies individual preferences or judgments using absolute numbers on a scale. This method has been widely employed in flood hazard mapping and assessments, yielding valuable results (Mokhtari et al. Citation2023). AHP method calculates the relative importance of two factors on a numerical scale ranging from 1 to 9 (Wind and Saaty Citation1980). The scale represents different levels of importance, with 1 indicating equal importance and 9 signifying extreme importance. Intermediate values can be assigned using 2, 4, 6, and 8. To illustrate the comparisons, presents the matrix of parameter comparisons.
Table 2. Pairwise comparison matrix of parameters.
The pairwise comparison matrix (PCM)-generated weight is normalized using AHP, as shown in . The results reveal that slope is the most influential factor, accounting for 37.4% of the overall influence. Elevation, rainfall, LULC, drainage density, and soil types follow, with influences of 24.1%, 16.2%, 10.8%, 6.8%, and 4.7%, respectively.
Table 3. Normalized weight of parameters.
Consistency checking: The consistency of normalized weights was assessed by finding the consistency ratio (CR) (Wind and Saaty Citation1980). The consistency vector (λ max) determines how much the matrix deviates from the consistency (Brunelli Citation2015). A PCM is considered consistent only while the λ max is equal to or higher as compared to the factors number being considered (six parameters in this research); otherwise, a new matrix must be created. In this study, the λ max was calculated using EquationEquation (1)(1)
(1) and obtained a value of 6.08, deemed acceptable. The consistency index (CI) was computed using EquationEquation (2)
(2)
(2) and yielded an outcome of 0.016. The CR was computed using EquationEquation (3)
(3)
(3) and generated a value of 0.012, indicating a suitable level of consistency (Wind and Saaty Citation1980).
(1)
(1)
Where: Cij - the number assigned to each factor at ith row & jth column in the pairwise comparison matrix, Xij - the value at ith row & jth column in the normalized weight matrix
(2)
(2)
Where: n-number of parameters considered.
(3)
(3)
Where: RI - the randomized index (1.24, for the current study)
2.3.4. Flood hazard and flood risk index
A weighted overlay analysis method was utilized to create a flood hazard map for the Gidabo watershed. This involved determining the weight of each factor, such as slope, elevation, rainfall, LULC, drainage density, and soil type. The flood hazard index (FHI) was calculated using these factors and their respective weights using EquationEquation (4)(4)
(4) (Wind and Saaty Citation1980).
(4)
(4)
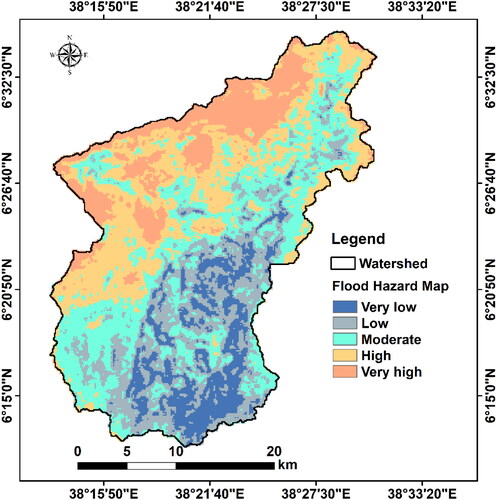
Based on the FHI values, the flood hazard in the Gidabo watershed was categorized into five zones: very high, higher, moderate, lower, and very low ().
Figure 5. Flood hazard zone map.
To determine the flood risk in the Gidabo watershed, we considered three factors: flood hazard, density of population, and LULC. These factors were given equal importance in the weighted overlay process (Ogato et al. Citation2020). The Flooding Risk Index (FRI) was calculated using EquationEquation (5)(5)
(5) (Wind and Saaty Citation1980):
(5)
(5)
The resulting FRI values were then classified into five risk zones ranging from very low to very high (). We compared the accuracy of the flood risk map with data collected from actual flooding sites to validate it. A receiver operating characteristic (ROC) curve and an area under the curve (AUC) are commonly used to validate flood susceptibility maps (Siahkamari et al. Citation2018; Wang et al. Citation2019). This method allows for the calculation of the prediction accuracy through the AUC. The AUC value is calculated using EquationEquation (6)(6)
(6) (Wang et al. Citation2019).
(6)
(6)
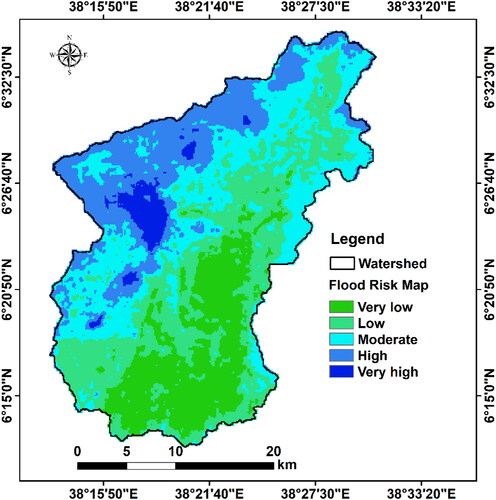
Figure 6. Flood risk map.
Where TP and TN represent the correctly and incorrectly classified flood occurrences, and P and N represent the total number of flood and non-flood occurrences, respectively.
3. Results
3.1. Flood hazard zone of Gidabo Watershed
The Gidabo watershed flood hazard map categorized different areas based on their flood susceptibility level. About 15.22% (123.3 km2) of the area was categorized as a very high flood hazard zone, while 26.38% (213.7 km2) was considered high, 27.27% (220.9 km2) as moderate, 20.05% (162.4 km2) as low, and 11.06% (89.6 km2) as very low (). This showed that approximately 41.6% (337 km2) of the area had higher to very high flood hazards. These zones have been primarily concentrated in the western, northwestern, and some parts of the central area (). The areas with moderate flood hazard zones frequently characterized the eastern, northeastern, southwestern, central parts, and some parts of the western watershed. On the other hand, about 31.11% (252 km2) of the area had very low to low flood hazards. These zones are mostly located in the southern, south-eastern, south-central, and some parts of the eastern regions.
Table 5. Area coverage of the flood hazard zone.
Table 6. Area coverage of flood risk.
3.2. Flood risk zone of Gidabo watershed
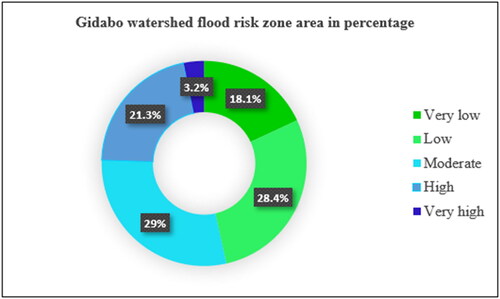
The resulting flood risk index divided the Gidabo watershed into five zones, ranging from very low to very high risk (). The findings revealed the following flood risk zones: very low 146.9 km2 (18.1%), low 230.7 km2 (28.4%), moderate 232.8 km2 (29%), high 173.2 km2 (21.3%), and very high 26.3 km2 (3.2%) across the entire watershed ( and ). Approximately 199.5 km2 (24.5%) of the area has been identified as having a higher to very higher flood risk. Notably, the western part of the watershed falls under the high flood risk zone. Based on the spatial study findings, specific towns such as Dilla, Gebado, Chichi, Wonago, and Teferi Keta are more susceptible to very high flood risks. Conversely, areas like Agamesa, Kochera Cheraka, Weto, Wetiku, Hasemo, and Shekusa Kebele demonstrate lower vulnerability to flood risk.
Figure 7. Flood risk zone area coverage in percentage.
3.3. Validation of flood risk zone
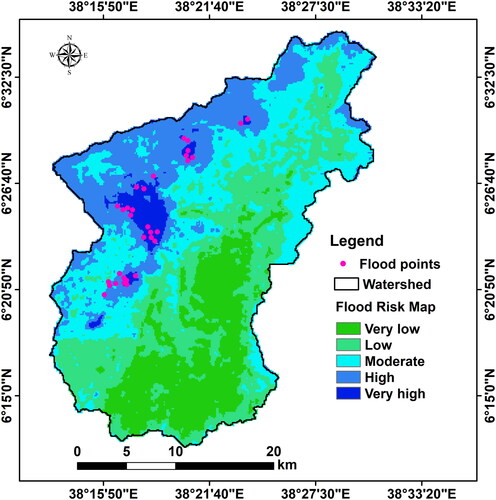
Model validation systematically compares a model’s results with real-world observations to determine how well the model represents reality. Researchers use various models to assess the vulnerability of floods in different areas, but it is important to test the accuracy of these models by comparing them to actual data. In the case of the Gidabo watershed flood risk map, the model’s output was validated by comparing it to data from 32 flooding sites collected during a field survey. These sites were overlaid on the model’s output (), and the ROC curve method was utilized to calculate the AUC value. The resulting AUC is 0.943 (94.3%), indicating an accurate prediction for the flood risk map. Overall, it has been determined that utilizing an integrated approach of RS, GIS, and AHP yields reliable results when forecasting flood risk.
Figure 8. Distribution of flooding risk sites.
4. Discussion
The integration of GIS, and RS a cost-effective and efficient tool for systematically analyzing several surface features helpful in identifying flood susceptibility zones (Twumasi et al. Citation2020; Goumrasa et al. Citation2021; Melkamu et al. Citation2022; Weday et al. Citation2023). Floods occur frequently and have become a constant occurrence in Ethiopia’s floodplains and other areas receiving heavy rainfall. For sustainable economic development, it is essential to analyze flood risk, making flood risk assessment a top priority in the field of natural sciences (Wondim Citation2016). Remote sensing data significantly contributes to locating flood susceptible zones (Desalegn and Mulu Citation2020; Hidayah et al. Citation2023). The map of flood hazard zones was generated based on six factors (rainfall, drainage density, elevation, slope, soil type, and LULC). The weight of each factor was determined using AHP (Desalegn and Mulu Citation2020; Hagos et al. Citation2022).
According to the generated flood hazard map, very high and high zones are frequently found in the watershed’s western, west-central, northern, and northwestern parts. These very high and high zones are distinguished by their gentle slope, lower elevation, lower drainage density, high rainfall, and specific soil types like pellic vertisols and chromic vertisols. Wetland, built-up, and barren land LULC types further contributed to very high and high flooding in the watershed. The areas with very low and low flooding hazards were mostly situated in the southern, south-central, and central parts of the watershed and distinguished by their steep slopes, higher elevation, high drainage density, lower rainfall, agroforest and soil types of eutric cambisols, which resulted in low infiltration and high runoff.
The flood risk map shows that very high flood risk is primarily concentrated in towns like Dilla, Gebado, Chichi, Wonago, and Teferi Keta. This region with a very high flood risk is distinguished by a very high population density, flooding, and built-up. The majority of the western study area was categorized under a high flood risk zone and distinguished by barren land, high population density, and high flooding. On the other hand, very low and low flood risk zones are frequently situated in areas like Agamesa, Kochera Cheraka, Weto, Wetiku, Hasemo, and Shekusa Kebele, and were distinguished by their low population density, low flood hazard, agroforest, and scrub forest.
Many previous research on flooding susceptibility mapping were validated using the ROC curve method (Siahkamari et al. Citation2018; Lin et al. Citation2019; Wang et al. Citation2019; Saha and Agrawal Citation2020; Hidayah et al. Citation2022). Similarly, we utilized the ROC curve method to validate the identified flood risk zones and yielded an outstanding AUC value. These findings are consistent with previous studies conducted in the Southern Oromia region (Burayu et al. Citation2023), Dongting Lake Region (Wang et al. Citation2011), Ambo Town and its watershed (Ogato et al. Citation2020), and Lower Awash Sub-basin, Ethiopia by Wondim (Citation2016).
5. Conclusion
This research successfully utilized GIS, RS, and AHP to evaluate flood hazards and risk areas in the Gidabo Watershed. Factors like slope, drainage density, LULC, elevation, soil types, and rainfall were considered based on literature and expert input to determine the flood hazard zone in the area. The three main factors (LULC, flood hazard zone, and population density) were selected to identify the flood risk zone. The flood hazard map of the Gidabo watershed has provided valuable insights into the distribution of flood hazard levels across the area. The map revealed that watershed approximately 15.22% was categorized as a very high flood hazard zone, while 26.38% is considered high, 27.27% as moderate, 20.05% as lower, and 11.06% as very low. Furthermore, the flood risk map divided the Gidabo watershed into five zones, ranging from very low to very high risk. The findings showed that the very lower-risk zone covers 18.1% of the area, the lower-risk zone covers 28.4%, the moderate-risk zone covers 29%, the high-risk zone covers 21.3%, and the very high-risk zone covers 3.2%. Finally, the flood risk map was validated and showed an accuracy of 94.3%. These results provide important information for understanding and managing flood risks in the Gidabo watershed. By identifying specific areas with higher flood hazards and risks, appropriate measures can be taken to mitigate and reduce potential damages. Considering these findings when planning and implementing interventions is crucial to ensure the safety and well-being of the communities living in the watershed.
Author’s contributions
Dechasa Diriba: Conceptualization, Methodology, Investigation, Writing- Original draft preparation, Validation; Tariku Takele: Helps in Validation and draft preparation, Writing- Reviewing, and Editing; Shankar Karuppannan: Data curation, Supervision, Writing- Reviewing and Editing; Musa Husein: Writing- Reviewing and Editing.
Disclosure statement
The authors declare that they have no known competing financial interests or personal relationships that could have appeared to influence the work reported in this study.
Data availability statement
The datasets used and/or analyzed during the current study are available in the article/from the corresponding author on request.
Additional information
Funding
References
- Allafta H, Opp C. 2021. GIS-based multi-criteria analysis for flood prone areas mapping in the trans-boundary Shatt Al-Arab basin, Iraq-Iran. Geomatics Nat Hazards Risk. 12(1):2087–2116. doi: 10.1080/19475705.2021.1955755.
- Areu-Rangel OS, Cea L, Bonasia R, Espinosa-Echavarria VJ. 2019. Impact of urban growth and changes in land use on river Flood Hazard in Villahermosa, Tabasco (Mexico). Water. 11(2):304. doi: 10.3390/w11020304.
- Athick AASM, Shankar K. 2019. Data on land use and land cover changes in Adama Wereda, Ethiopia, on ETM+, TM and OLI- TIRS Landsat sensor using PCC and CDM techniques. Data Brief. 24:103880. doi: 10.1016/j.dib.2019.103880.
- Athick AASM, Shankar K, Naqvi HR. 2019. Data on time series analysis of land surface temperature variation in response to vegetation indices in twelve Wereda of Ethiopia using mono window, split window algorithm and spectral radiance model. Data Brief. 27:104773. doi: 10.1016/j.dib.2019.104773.
- Brunelli M. 2015. Introduction and fundamentals. In: Brunelli, M. (Ed.), Introduction to the analytic hierarchy process. Cham: Springer International Publishing; p. 1–15. doi: 10.1007/978-3-319-12502-2_1.
- Burayu DG, Karuppannan S, Shuniye G. 2023. Identifying flood vulnerable and risk areas using the integration of analytical hierarchy process (AHP), GIS, and remote sensing: a case study of southern Oromia region. Urban Clim. 51:101640. doi: 10.1016/j.uclim.2023.101640.
- Chakraborty S, Mukhopadhyay S. 2019. Assessing flood risk using analytical hierarchy process (AHP) and geographical information system (GIS): application in Coochbehar district of West Bengal, India. Nat Hazards. 99(1):247–274. doi: 10.1007/s11069-019-03737-7.
- Chen J, Hill AA, Urbano LD. 2009. A GIS-based model for urban flood inundation. J Hydrol. 373(1–2):184–192. doi: 10.1016/j.jhydrol.2009.04.021.
- Chen H, Ito Y, Sawamukai M, Tokunaga T. 2015. Flood hazard assessment in the Kujukuri Plain of Chiba Prefecture, Japan, based on GIS and multicriteria decision analysis. Nat Hazards. 78(1):105–120. doi: 10.1007/s11069-015-1699-5.
- Dadi B, Gumi B. 2020. Flooding in Ethiopia; causes, impact, and coping mechanism. A Review.
- Desalegn H, Mulu A. 2020. Flood vulnerability assessment using GIS at Fetam watershed, upper Abbay basin, Ethiopia. Heliyon. 7(1):e05865. doi: 10.1016/j.heliyon.2020.e05865.
- Dixon B. 2005. Applicability of neuro-fuzzy techniques in predicting ground-water vulnerability: a GIS-based sensitivity analysis. J Hydrol. 309(1-4):17–38. doi: 10.1016/j.jhydrol.2004.11.010.
- Feloni E, Mousadis I, Baltas E. 2020. Flood vulnerability assessment using a GIS-based multi-criteria approach: the case of Attica region. J Flood Risk Manage. 13(S1):e12563. doi: 10.1111/jfr3.12563.
- Fernández DS, Lutz MA. 2010. Urban flood hazard zoning in Tucumán Province, Argentina, using GIS and multicriteria decision analysis. Eng Geol. 111(1-4):90–98. doi: 10.1016/j.enggeo.2009.12.006.
- Gazi M, Islam M, Hossain S. 2019. Flood-Hazard Mapping in a Regional Scale – Way Forward to the Future Hazard Atlas in Bangladesh. 3:1–11. doi: 10.26480/mjg.01.2019.01.11.
- Gigović L, Pamučar D, Bajić Z, Drobnjak S. 2017. Application of GIS-interval rough AHP methodology for flood hazard mapping in urban areas. Water. 9(6):360. doi: 10.3390/w9060360.
- Goumrasa A, Guendouz M, Guettouche MS, Belaroui A. 2021. Flood hazard susceptibility assessment in Chiffa Wadi watershed and along the first section of Algeria North–South highway using GIS and AHP method. Appl Geomat. 13(4):565–585. doi: 10.1007/s12518-021-00381-4.
- Hagos YG, Andualem TG, Yibeltal M, Mengie MA. 2022. Flood hazard assessment and mapping using GIS integrated with multi-criteria decision analysis in upper Awash River basin, Ethiopia. Appl Water Sci. 12(7):148. doi: 10.1007/s13201-022-01674-8.
- Hdeib R, Abdallah C, Colin F, Brocca L, Moussa R. 2018. Constraining coupled hydrological-hydraulic flood model by past storm events and post-event measurements in data-sparse regions. J Hydrol. 565:160–176. doi: 10.1016/j.jhydrol.2018.08.008.
- Hidayah, Entin, Lee, Wei-Koon, Halik, Gusfan, Pradhan, Biswajeet, Indarto, 2022. Assessing coastal flood susceptibility in East Java, Indonesia: comparison of statistical bivariate and machine learning techniques. Water, 2314, 3869. doi: 10.3390/w14233869.
- Hidayah E, Pranadiarso T, Halik G, Indarto I, Lee W-K, Maruf MF. 2023. Flood Mapping Based on Open-Source Remote Sensing Data Using an Efficient Band Combination System.
- Ikirri M, Faik F, Echogdali FZ, Antunes IMHR, Abioui M, Abdelrahman K, Fnais MS, Wanaim A, Id-Belqas M, Boutaleb S, et al. 2022. Flood hazard index application in arid catchments: case of the Taguenit Wadi Watershed, Lakhssas, Morocco. Land. 11(8):1178. doi: 10.3390/land11081178.
- Kamaraj P, David Thangapandian I, Karuppannan S, Garo T. 2024. A statistical-based geospatial approach to prioritize the watersheds for soil erosion conservation in the Upper Awash Basin (Upstream Koka), Ethiopia. Kuwait Journal of Science. 51(2):100198. doi: 10.1016/j.kjs.2024.100198.
- Khosravi K, Pham BT, Chapi K, Shirzadi A, Shahabi H, Revhaug I, Prakash I, Tien Bui D. 2018. A comparative assessment of decision trees algorithms for flash flood susceptibility modeling at Haraz watershed, northern Iran. Sci Total Environ. 627:744–755. doi: 10.1016/j.scitotenv.2018.01.266.
- Kia MB, Pirasteh S, Pradhan B, Mahmud AR, Sulaiman WNA, Moradi A. 2012. An artificial neural network model for flood simulation using GIS: Johor River Basin, Malaysia. Environ Earth Sci. 67(1):251–264. doi: 10.1007/s12665-011-1504-z.
- Lappas I, Kallioras A. 2019. Flood susceptibility assessment through GIS-based multi-criteria approach and analytical hierarchy process (AHP) in a river basin in Central Greece. Int Res J Eng Technol.
- Lei W, Dong H, Chen P, Lv H, Fan L, Mei G. 2020. Study on runoff and infiltration for expansive soil slopes in simulated rainfall. Water. 12(1):222. doi: 10.3390/w12010222.
- Lin L, Wu Z, Liang Q. 2019. Urban flood susceptibility analysis using a GIS-based multi-criteria analysis framework. Nat Hazards. 97(2):455–475. doi: 10.1007/s11069-019-03615-2.
- Liu Y, Zhang W, Cui X. 2012. Flood emergency management using hydrodynamic modelling. Procedia Engineering, 2012 International Conference on Modern Hydraulic Engineering. 28:750–753. doi: 10.1016/j.proeng.2012.01.802.
- Melkamu T, Bagyaraj M, Adimaw M, Ngusie A, Karuppannan S. 2022. Detecting and mapping flood inundation areas in Fogera-Dera Floodplain, Ethiopia during an extreme wet season using Sentinel-1 data. Physics and Chemistry of the Earth, Parts A/B/C. 127:103189. doi: 10.1016/j.pce.2022.103189.
- Moazzam MFU, Vansarochana A, Rahman AU. 2018. Analysis of flood susceptibility and zonation for risk management using frequency ratio model in District Charsadda, Pakistan. IJEGEO. 5(2):140–153. doi: 10.30897/ijegeo.407260.
- Mokhtari E, Mezali F, Abdelkebir B, Engel B. 2023. Flood risk assessment using analytical hierarchy process: a case study from the Cheliff-Ghrib watershed, Algeria. Journal of Water and Climate Change. 14(3):694–711. doi: 10.2166/wcc.2023.316.
- Nair PG, Das S, Medhe R, Chatterjee U, Kumar S, Karuppannan S. 2023. Flood susceptibility mapping in the Periyar River Basin of Kerala integrating gis-ahp and Google Earth Engine. doi: 10.2139/ssrn.4549889.
- Nigusse AG, Adhanom OG. 2019. Flood hazard and flood risk vulnerability mapping using geo-spatial and MCDA around Adigrat, Tigray Region, Northern Ethiopia. MEJS. 11(1):90–107. doi: 10.4314/mejs.v11i1.6.
- Ogato GS, Bantider A, Abebe K, Geneletti D. 2020. Geographic information system (GIS)-Based multicriteria analysis of flooding hazard and risk in Ambo Town and its watershed, West shoa zone, oromia regional State, Ethiopia. J Hydrol: reg Stud. 27:100659. doi: 10.1016/j.ejrh.2019.100659.
- Ouma YO, Tateishi R. 2014. Urban flood vulnerability and risk mapping using integrated multi-parametric AHP and GIS: methodological overview and case study assessment. Water. 6(6):1515–1545. doi: 10.3390/w6061515.
- Rahmati O, Zeinivand H, Besharat M. 2016. Flood hazard zoning in Yasooj region, Iran, using GIS and multi-criteria decision analysis. Geomatics Nat Hazards Risk. 7(3):1000–1017. doi: 10.1080/19475705.2015.1045043.
- Raufu IO, Mukaila I, Olaniyan K, Awodele Z. 2023. Application of remote sensing and geographical information system (GIS) in flood vulnerability mapping: a scenario of Akure South, Nigeria. IJEGEO. 10(1):90–99., doi: 10.30897/ijegeo.1073697.
- Rimba AB, Setiawati MD, Sambah AB, Miura F. 2017. Physical flood vulnerability mapping applying geospatial techniques in Okazaki City, Aichi Prefecture, Japan. Urban Sci. 1(1):7. doi: 10.3390/urbansci1010007.
- Saha AK, Agrawal S. 2020. Mapping and assessment of flood risk in Prayagraj district, India: a GIS and remote sensing study. Nanotechnol Environ Eng. 5(2):11. doi: 10.1007/s41204-020-00073-1.
- Sajinkumar KS, Arya A, Rajaneesh A, Oommen T, Yunus AP, Rani VR, Avtar R, Thrivikramji KP. 2022. Migrating rivers, consequent paleochannels: the unlikely partners and hotspots of flooding. Sci Total Environ. 807(Pt 2):150842. doi: 10.1016/j.scitotenv.2021.150842.
- Santos LBL, Carvalho T, Anderson LO, Rudorff CM, Marchezini V, Londe LR, Saito SM. 2017. An RS-GIS-based comprehensive impact assessment of floods; a case study in Madeira River, Western Brazilian Amazon. IEEE Geosci Remote Sensing Lett. 14(9):1614–1617. doi: 10.1109/LGRS.2017.2726524.
- Sarmah T, Das S. 2018. Urban flood mitigation planning for Guwahati: a case of Bharalu basin. J Environ Manage. 206:1155–1165. doi: 10.1016/j.jenvman.2017.10.079.
- Senan CPC, Ajin RS, Danumah JH, Costache R, Arabameri A, Rajaneesh A, Sajinkumar KS, Kuriakose SL. 2023. Flood vulnerability of a few areas in the foothills of the Western Ghats: a comparison of AHP and F-AHP models. Stoch Environ Res Risk Assess. 37(2):527–556. doi: 10.1007/s00477-022-02267-2.
- Siahkamari S, Haghizadeh A, Zeinivand H, Tahmasebipour N, Rahmati O. 2018. Spatial prediction of flood-susceptible areas using frequency ratio and maximum entropy models. Geocarto International. 33(9):927–941. doi: 10.1080/10106049.2017.1316780.
- Tehrany MS, Pradhan B, Mansor S, Ahmad N. 2015. Flood susceptibility assessment using GIS-based support vector machine model with different kernel types. CATENA. 125:91–101. doi: 10.1016/j.catena.2014.10.017.
- Tsakiris G. 2014. Flood risk assessment: concepts, modelling, applications. Nat Hazards Earth Syst Sci. 14(5):1361–1369. doi: 10.5194/nhess-14-1361-2014.
- Twumasi YA, Merem EC, Namwamba JB, Okwemba R, Ayala-Silva T, Abdollahi K, Lukongo OEB, Tate J, Cour-Conant KL, Akinrinwoye CO. 2020. Use of GIS and Remote Sensing Technology as a Decision Support Tool in Flood Disaster Management: the Case of Southeast Louisiana, USA. JGIS. 12(02):141–157. doi: 10.4236/jgis.2020.122009.
- Ullah S, Farooq M, Sarwar T, Tareen MJ, Wahid MA. 2016. Flood modeling and simulations using hydrodynamic model and ASTER DEM: a case study of Kalpani River. Arab J Geosci. 9(6):439. doi: 10.1007/s12517-016-2457-z.
- Vishnu CL, Sajinkumar KS, Oommen T, Coffman RA, Thrivikramji KP, Rani VR, Keerthy S. 2019. Satellite-based assessment of the August 2018 flood in parts of Kerala, India. Geomatics Nat Hazards Risk. 10(1):758–767. doi: 10.1080/19475705.2018.1543212.
- Wang Y, Hong H, Chen W, Li S, Panahi M, Khosravi K, Shirzadi A, Shahabi H, Panahi S, Costache R. 2019. Flood susceptibility mapping in Dingnan County (China) using adaptive neuro-fuzzy inference system with biogeography based optimization and imperialistic competitive algorithm. J Environ Manage. 247:712–729. doi: 10.1016/j.jenvman.2019.06.102.
- Wang Y, Li Z, Tang Z, Zeng G. 2011. A GIS-based spatial multi-criteria approach for flood risk assessment in the Dongting Lake Region, Hunan, Central China. Water Resour Manage. 25(13):3465–3484. doi: 10.1007/s11269-011-9866-2.
- Weday AM, Tabor KW, Gemeda DO. 2023. Flood hazards and risk mapping using geospatial technologies in Jimma City, southwestern Ethiopia. Heliyon. 9(4):e14617. doi: 10.1016/j.heliyon.2023.e14617.
- Wind Y, Saaty TL. 1980. Marketing applications of the analytic hierarchy process. Manage Sci. 26(7):641–658., doi: 10.1287/mnsc.26.7.641.
- Wondim YK. 2016. Flood hazard and risk assessment using GIS and remote sensing in lower awash sub-basin. Ethiopia.