
 ?Mathematical formulae have been encoded as MathML and are displayed in this HTML version using MathJax in order to improve their display. Uncheck the box to turn MathJax off. This feature requires Javascript. Click on a formula to zoom.
Abstract
Accurate prediction of potential landslide dam breaches is crucial for timely and effective emergency responses to the resulting flood. Although many models for landslide dam overtopping have been proposed in past studies, most of these models did not consider the heterogeneity of dam materials, which is important in reflecting the erodibility of soil. In this study, a new mathematical model for landslide dam breaches due to overtopping was proposed based on a constructed vertical distribution model of dam particle size. Two real-world dams, the Tangjiashan landslide dam and Baige landslide dam, were used to evaluate the performance of the proposed model. In addition, the proposed model was compared with four existing dam failure models, and sensitivity analysis was conducted on the median particle size and particle size distribution. The results demonstrate that the computational outcomes of the proposed model align more closely with the actual results, indicating that the proposed model outperforms the four existing models in accurately simulating the landslide dam failure process. It also suggests that ignoring the variation of dam material particle size along the vertical direction inside the dam body would increase the prediction relative errors of key breach outcomes.
1. Introduction
Landslide dams are deposits of soil and rock that block valleys and rivers due to landslides caused by earthquakes, heavy precipitation and volcanic eruptions (Yan et al. Citation2009; Wu et al. Citation2024). There are great differences between landslide dams and artificial dams. For instance, the shape and height of landslide dams are irregular, and the accumulation range along the river is wider; the material gradation of the dam is wide and uneven and the internal structure within the dam is often loose (Zhong et al. Citation2018b). In addition, unlike artificial dams, landslide dams lack specific spillway arrangements. All these factors make landslide dams more prone to failure compared to artificial dams (Dong et al. Citation2009; Peng & Zhang Citation2012; Shen et al. Citation2020). Once a landslide dam breaks, floodwater will cause great damage in downstream areas. Therefore, it is important to estimate dam break flood of landslide dams accurately using appropriate mathematical models.
To forecast the parameters associated with landslide dam failures, including discharge, breach size and barrier lake water level, many researchers have studied the simulation technology of landslide dam breaks. Over the past few decades, a variety of parameter models have been developed as a result of these efforts (Zhong et al. Citation2018b; Chen et al. Citation2019). Costa (Citation1985) proposed three regression equations to predict the peak discharge of the breach based on 10 cases of barrier dam break. Based on a Japanese dataset, Dong et al. (Citation2011) utilized the logistic regression method to identify the important geomorphic variables and evaluated the failure probability of a landslide dam. Some scholars (Costa & Schuster Citation1988; Walder & O ConnorCitation1997) proposed several parameter models to predict peak flow. However, these early models only considered the hydrodynamic conditions of the barrier lake (Cencetti & Di Matteo Citation2022) and can only roughly predict the flow of the breach, while ignoring some important breach parameters such as breach size and reservoir water level. Recently, with increase in dam break data collected, the dam break parameter model has been developed from the single parameter models to multi-parameter models (Froehlich Citation1995; Xu & Zhang Citation2009; Froehlich Citation2016; Mei et al. Citation2018; Wu et al. Citation2023). The outputs of these models have expanded beyond peak discharge to encompass variables such as the final average width of the breach, duration of the dam break and others. Moreover, these models now incorporate factors such as dam shape, reservoir capacity and material characteristics of the dam (Duan et al. Citation2021).
Although there has been some significant progress in the simulation methods of landslide dam break, the current landslide dam failure models often neglect the significant heterogeneity characteristics of landslide dam materials. Typically, breaching outcomes of landslide dam are predicted assuming that parameters of the dam materials are constants (Zhong et al. Citation2020a). However, the formation of landslide dams inherently entails uneven spatial distribution of material composition within the dam body, with material composition varying significantly along the direction of gravity (Chang et al. Citation2011), resulting in changes in breaching parameters with depth, such as particle size, and their associated factors like incipient velocity and erodibility of soil, etc. Hence, it is difficult to accurately estimate the development of dam failure without considering these changes in parameters.
Therefore, in this study, a new landslide dam break model that incorporates a vertical distribution model of landslide dam material particle size is proposed to simulate the breaching process of landslide dams (Section 2), and the numerical computation procedure of the model is also established (Section 3). This model is evaluated using two case study dams, Tangjiashan landslide dam and Baige landslide dam (Sections 4 and 5), and against four commonly used existing models (Section 5). Finally, limitations of this model and future research are also discussed (Section 6).
2. Model development
For the calculation of landslide dam failure, previous physically based breach models usually include three parts: calculation of outflow, calculation of soil erosion and calculation of breach development (Chen et al. Citation2019). In order to consider the variation of dam material particle size along the depth, which has a significant impact on soil properties, a vertical distribution model of particle size is constructed as a new module of the breach mathematical model. Therefore, the new breach model is mainly composed of four modules. In addition, the sediment erosion rate and the associated equation for continuous breach expansion have also been re-derived. Each of these four modules is discussed as follows.
2.1. Module 1 – vertical distribution model of dam particles
An accurate mathematical description of the structure of a landslide dam can provide a reasonable initial input for the calculation of its failure process. In the process of landslide accumulation, especially for remote landslides, the sorting of soil and rock particles with different sizes is mainly reflected in the mixing and separation movement in the vertical direction. On the other hand, the autocorrelation distance of particle sizes in the horizontal direction is generally greater than that in the vertical direction, and it has a rough horizontal stratification feature (Chen et al. Citation2021). Therefore, this study considers landslide dams as horizontally isotropic heterogeneous materials and constructs a spatial particle size distribution model based on the vertical structure of reverse grading distribution.
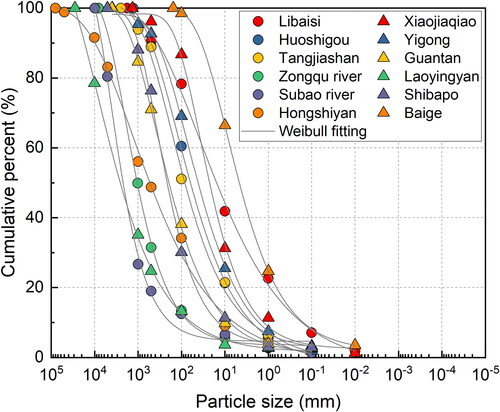
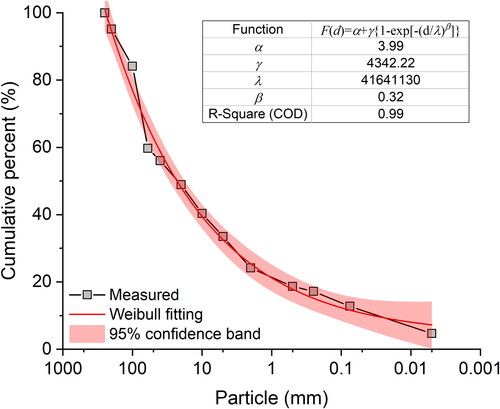
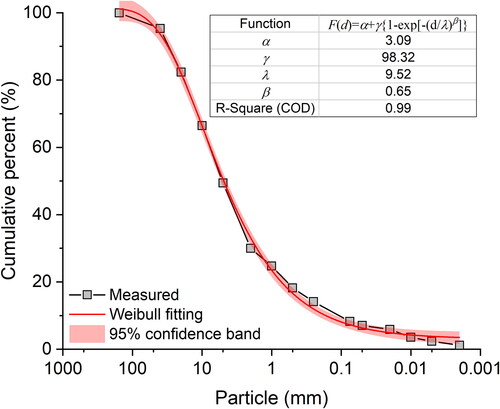
Casagli et al. (Citation2003) and Bu et al. (Citation2017) discovered that the particle size and frequency of deposits resulting from geological disasters such as landslides and debris flows conform to a three-parameter Weibull distribution. The authors selected 12 landslide dams with clear grading data for curve fitting analysis, as depicted in , and arrived at the same conclusion. In addition, the particle size of the landslide dam has self-similarity (Li et al. Citation2021), that is, for each soil layer of the landslide dam, the frequency distribution of the particle group is similar to the overall particle group frequency of the landslide dam. Therefore, a probability function of particle size distribution for landslide dams can be constructed as follows:
(1)
(1)
Figure 1. Analysis of particle grading curve for landslide dams.
Where d = particle size of landslide dam (mm), F (d) = accumulated content of soil particles smaller than particle size d, α = positional parameter, γ = scale parameter of particle size, λ = proportional parameter, β = shape parameter and α, γ, λ, β can be determined through regression analysis. According to EquationEquation (1)(1)
(1) , the calculation equation for any characteristic particle size (such as d50) near the surface of the landslide dam crest can be derived as:
(2)
(2)
Where = near surface characteristic particle size (mm). Then, a vertical distribution model for any characteristic particle size at any depth of the landslide dam can be constructed as:
(3)
(3)
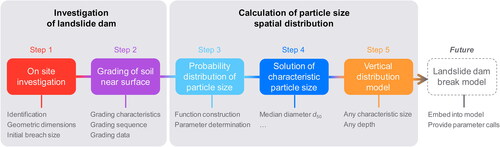
Where = the characteristic particle size of a certain depth of soil layer (mm), H = height of landslide dam (m), H' = depth of breach (m), dmin = the minimum particle size of the landslide dam (mm). If the landslide dam is a clay dam, the minimum particle size is taken as the boundary particle size of the clay particles. In practical engineering, the surface gradation distribution is initially obtained through onsite investigation, such as the use of drones and image processing. Subsequently, the probability distribution of particle sizes is constructed, and the characteristic particle size value is determined. Then, a vertical distribution model of the characteristic particle size is established. The process for obtaining the spatial distribution of characteristic parameters of the dam body is shown in .
Figure 2. Procedure for obtaining spatial particle size.
2.2. Module 2 – calculation of discharge
When a landslide dam overtops, the reservoir water flows through the lowest part of the dam crest and forms an initial breach. The development of the breach is closely related to the breach flow, whose development process also depends on the reservoir water and the erosion resistance of dam materials. Therefore, it is of great importance to accurately calculate the discharge at the dam break. During the process of landslide dams overtopping, the breach flow meets the water balance equation:
(4)
(4)
(5)
(5)
Where V = volume of barrier lake (m3), Az = surface area of barrier lake (m2), zs = water lever of barrier lake (m), t = breaching time (s), Qi = inflow discharge (m3/s), Qb = breach discharge (m3/s).
The initial breach of the dam crest is usually assumed to be trapezoidal or rectangular. According to the previous centrifugal model tests of landslide failure (Zhao et al. Citation2018; Citation2019), most of the breaches are developed with trapezoidal cross-sections. Therefore, in this study, the initial breach is assumed to be trapezoidal, and the breach flow could be calculated using the broad-crested weir equation:
(6)
(6)
(7)
(7)
Where Qb = breach flow (m3/s), ks = correction coefficient of submerged flow downstream, cd = discharge coefficient, b = bottom width of the breach (m), = water depth of breach (m), zb = elevation of breach bottom (m), g = gravitational acceleration (m/s2), m = breach slope coefficient, c1 and c2 are the discharge coefficients of rectangular and triangular parts of the breach respectively, and
according to the Singh (Citation1996).
2.3. Module 3 – calculation of sediment transport
After the overtopping of landslide dam, the discharge flow usually erodes the breach vertically and horizontally, which makes the breach deepen and widen. In this study, the total sediment transport rate is obtained by calculating the bed load and suspended load sediment transport rates, respectively, based on the Bagnold Formula (1956). For bed load sediment transport rate:
(8)
(8)
Where gb = sediment transport rate of bed load (kg/m·s), Wb = weight of bed load sediment in unit area (kg/m2), ub = bed load velocity (m/s), = water density (kg/m3),
= sediment density (kg/m3).
In terms of energy, the energy consumed in carrying sediment particles in unit time is equal to the water flow power multiplied by its efficiency (Wu & Wang Citation2007), written as:
(9)
(9)
Where = the work done by force in the direction of motion to transport sediment in unit time, α = internal friction angle of sediment (°),
= drag force of bed surface (Pa), and
with R = hydraulic radius (m), J = hydraulic gradient, and
with L = breach length of dam crest (m), S = breach length of the downstream slope (m),
= potential energy loss of water flow in unit time, U = vertical average flow velocity (m/s), eb = efficiency of bed load transport.
The sediment transport rate of the single-width bed load can be obtained by simultaneous EquationEquations (5)(5)
(5) and Equation(6)
(6)
(6) :
(10)
(10)
Similarly, the sediment transport rate of suspended load can be written as (Wu et al. Citation2004, Citation2012):
(11)
(11)
Where gs = sediment transport rate of suspended load (kg/m·s), = vertical average velocity in the flow direction (m/s).
As a whole, the centre of gravity of suspended sediment remains unchanged, that is, the sinking speed of suspended sediment is equal to the suspension one (Wu Citation2013). Then, the work done by suspended sediment is:
(12)
(12)
Where E1 = work done by the suspended sediment (J), = settling velocity of sediment (m/s), which is determined by:
(13)
(13)
Where = unit weight of soil (N/m3),
= unit weight of water (N/m3), g = gravitational acceleration (N/kg),
= the average particle size of soil particles (mm). Based on the law of conservation of energy, the energy of water flow maintaining the movement of suspended load in unit time and bed surface is the potential energy of water flow loss minus that consumed by bed load movement and then multiplied by the efficiency coefficient. The energy of water flow maintaining the movement of suspended load is determined by:
(14)
(14)
Where E2 = the energy of water flow maintaining the movement of the suspended load (J), es = efficiency of suspended load transport.
This part of the energy is used to maintain sediment suspension, that is, E1 = E2 (Wu & Li Citation2017). So, it has:
(15)
(15)
According to EquationEquations (11)(11)
(11) , Equation(12)
(12)
(12) and Equation(15)
(15)
(15) , there are:
(16)
(16)
The vertical average velocity of the suspended load is directly proportional to the vertical average velocity of water flow. So, it can be written as:
(17)
(17)
Where k = scale factor. Through the analysis of a large number of flume tests, Bagnold (Citation1966) obtained So, it has:
(18)
(18)
According to Einstein (Citation1950), the combination of the suspended load and bed load sediment transport rates is known as the total sediment transport rate. Considering the high velocity and powerful scouring of a landslide dam breaching, a correction coefficient (the value is 0.056 in this study) is introduced based on the total sediment transport rate, and the total sediment transport rate gT may be calculated as:
(19)
(19)
The total amount of sediment transfer is determined by:
(20)
(20)
Where QT = total amount of sediment transfer (kg/m).
2.4. Module 4 – calculation of breach expansion
2.4.1. Continuous expansion of the breach
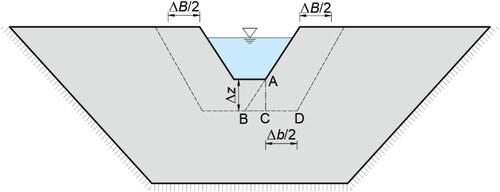
The main expansion types of the breach are surface erosion and traceable erosion. Due to the low contents of clay, the erosion mode of landslide dam breach is mainly surface erosion (Zhong et al. Citation2021), as shown in .
Figure 3. Vertical and horizontal continuous expansion of the breach.
The increment of longitudinal cut depth of breach can be calculated by:
(21)
(21)
Where n0 = porosity of dam material, l = generalized breach length (m), = time step (s). According to previous centrifugal model tests of landslide dam breaching (Zhao et al. Citation2018), the horizontal and vertical continuous development process of the breach roughly follows the following geometric relationship AB = BD. Therefore, based on geometric relationships in , the increment of breach top width expansion
and the bottom width expansion
can be expressed as:
(22)
(22)
Where = breach slope angle (°), ΔB = the increment of the expansion of the breach top width (m), Δb = the increment of the expansion of the breach bottom width (m).
2.4.2. Collapse extension of the breach
According to , with the continuous erosion of the breach, the angle of the breach slope will increase, resulting in the collapse of the breach slope at a certain angle. In this research, it is assumed that the sliding surface of the slope is a plane passing through the toe, that is, the collapse of the breach only causes the expansion of the top width (). Therefore, it is important to determine the dip angle of the sliding surface for calculating the expansion increment of the breach top width.
Figure 4. Stability calculation of breach slope.
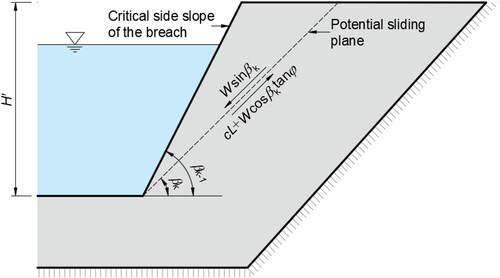
Assuming that the slope will collapse when the slope of the breach reaches the critical one, the mechanical state of the sliding surface can be expressed as:
(23)
(23)
Where W = weight of the sliding body (kN), c = cohesion of soil mass (kPa), L = length of the sliding surface (m), = internal friction angle of soil (°),
= dip angle of the sliding surface (°). The weight of the sliding body can be expressed as:
(24)
(24)
Where = critical dip angle of breach slope (°), H′ = breach depth (m). Combining EquationEquations (23)
(23)
(23) and Equation(24)
(24)
(24) , it can be obtained:
(25)
(25)
According to Mohr-Coulomb Strength Theory, when the soil is destroyed in the limit equilibrium state, it meets Combined with EquationEquation (25)
(25)
(25) , the following equation can be obtained.
(26)
(26)
Whether the slope will collapse can be judged by the dip angle of the breach slope. According to EquationEquation (26)(26)
(26) , the critical dip angle of breach slope can be expressed as:
(27)
(27)
When the breach slope collapses, the increment of the bottom width and depth of the breach is 0 according to , and the increment of the top width can be calculated according to the following equation:
(28)
(28)
3. Numerical calculation process
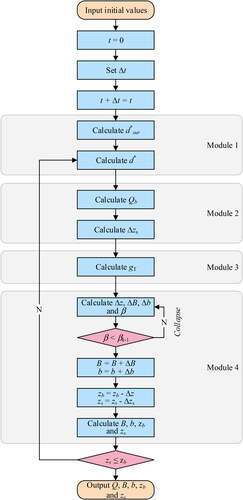
The iterative method based on time step is used for running model. By inputting the initial conditions, boundary conditions and parameters of barrier dam and lake, the model can be used to calculate the development process of dam break due to overtopping. The calculation process is as follows.
Step 1: input initial parameters, including dam geometry, crest breach, dam material, overtopping flow, reservoir capacity and downstream river.
Step 2: set
Step 3: make
Step 4: construct the probability function of particle size distribution based on EquationEquation (1)
(1)
Step 5: construct vertical particle size distribution model based on EquationEquation (2)
Step 6: calculate breach flow Qb based on EquationEquation (6)
Step 7: calculate reservoir water level increment
Step 8: calculate total sediment transport rate gT based on EquationEquation (19)
Step 9: calculate the increment of longitudinal cut depth
Step 10: judge whether
Step 11: make
Step 12: calculate the breach top width B, bottom width b, elevation of bottom zb and reservoir water lever zs according to step 11.
Step 13: judge whether
Step 14: output Q, B, b, zb and zs.
The calculation process is shown in .
Figure 5. The model calculation process of the mathematical model.
4. Case study and data
4.1. Tangjiashan landslide dam
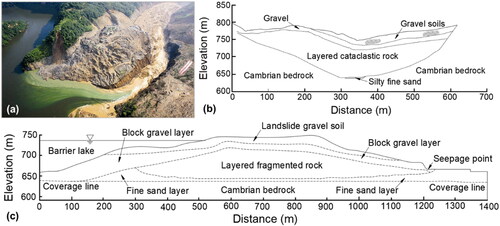
Tangjiashan landslide dam was created during the 2008 Wenchuan earthquake in China’s Southwest Sichuan Province, with a height of approximately 100 m. It has a catchment area of 3550 km2, a storage capacity of 145 million m3 and a volume of about 316 million m3 after full storage. The Tongkou River in the dam site is an asymmetric V-shaped valley, with a steep right bank slope of about 60° and a gentle left bank slope of about 30°. The geology of the site consists of Cambrian siliceous sandstone and phyllites with interbedded black slates and mylonites. During the earthquake, the hillslope on the right side of the river collapsed along the bedding planes that strike at N60°E and dip Northwest at an angle of 60° (Liu et al. Citation2010), as shown in .
Figure 6. The (a) full extent, (b) cross-section, and (c) longitudinal section of the Tangjiashan landslide dam (Hu et al. Citation2010).
Due to the large dam height and storage capacity, once the Tangjiashan landslide dam breaks, it will greatly endanger the downstream people. To eliminate the danger as soon as possible, the earthquake relief headquarters of the Ministry of Water Resources, PRC decided to excavate the slugging channel for Tangjiashan landslide dam. As the similarity between the discharge process of the landslide dam and the overtopping, and the availability of detailed monitoring data, this study chose the Tangjiashan landslide dam discharge to validate the mathematical model.
According to the measured grading of the Tangjiashan landslide dam (), the probability function of particle size distribution in the dam body can be determined. The particle size required for this model calculation is mainly the median particle size. Therefore, can be incorporated into the probability distribution function and d50 = 22.9 mm can be obtained. According to onsite investigation, the height of the Tangjiashan landslide dam is 103 m, and the minimum particle size dmin = 0.075 mm. Therefore, a vertical distribution model of d50 can be constructed as:
(29)
(29)
Figure 7. Grading analysis of Tangjiashan landslide dam.
The calculation parameters are shown in .
Table 1. Conditions of Tangjiashan landslide dam.
4.2. Baige landslide dam
At 22:06 on 10 October 2018, a large-scale landslide occurred in Baige Village (31°4′56.41′′N, 98°42′17.98′′E) at the junction of Sichuan Province, China and the Tibet Autonomous Region. The landslide blocked the mainstream of Jinsha River, forming a barrier lake, which naturally discharged on 12 October (Cai et al. Citation2020). On 3 November 2018, a second landslide occurred at the same location (Fan et al. Citation2019), with a volume of approximately 160 × 104 m3 blocking the flow channel formed by the “10.10” landslide, causing a second river blockage.
The strata in the landslide area consist of the Permian Early Triassic Gangtuoyan Formation (PT1g), distributed in a nearly north-south direction in the Jinsha River junction zone. The lithology predominantly comprises gray sericite quartz schist, with thin layers of quartz interbedded in the middle and lower parts. Certain local areas contain notable amounts of chlorite, charcoal and calcium. A regional reverse fault is developed at the rear of the landslide body (Huang et al. Citation2021). According to the exploration data, provides a schematic diagram of the cross-sectional morphology of the Baige landslide dam formed by these two landslides distinguished by two colours (Zhang et al. Citation2019).
Figure 8. The (a) cross-section, (b) longitudinal section of Baige landslide dam (Zhong et al. Citation2020b).
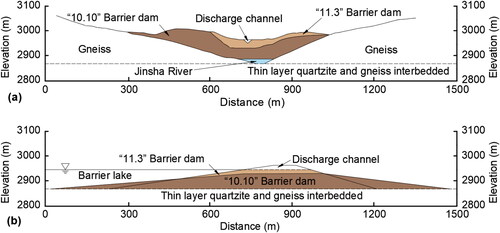
According to the height of the dam, the mode of collapse and the speed of upstream water level rise, the Yangtze River Defense Administration formulated a manual intervention plan on 4 November. The designed drainage groove is arranged on the left side of the “11.3” accumulation body, with a position slightly to the left compared to the “10.10” flow channel. The construction of the drainage channel began on 8 November and ended at 11:00 on the 11th. The excavation length was 220 m, with a bottom width of 3 m. The average depth was 13.48 m, and the maximum excavation depth was nearly 15 m. After the breaching of the barrier lake on 13 November, a new river channel was formed based on the drainage channel. This study selected the “11.3” Baige landslide dam (the second landslide) to further validate the breach model proposed.
According to the measured grading of the Tangjiashan landslide dam (), the probability function of particle size distribution in the dam body can be determined. According to the probability distribution function, d50 = 4.88 mm can be obtained. The height of Baige landslide dam is 96 m, and the minimum particle size dmin = 0.075 mm. Therefore, a vertical distribution model of d50 can be constructed as:
(30)
(30)
Figure 9. Grading analysis of Baige landslide dam.
The calculation parameters are shown in .
Table 2. Conditions of Baige landslide dam.
4.3. Discharge coefficients
Although Singh (Citation1996) provided an empirical value for the discharge coefficient in EquationEquation (6)(6)
(6) , to determine its applicability in the two real cases discussed in this article, we conducted sensitivity analysis on the two coefficients using data of initial discharge from the Tangjiashan and Baige landslide dams. For the Tangjiashan landslide dam, we considered a bottom width of 8 m, an initial head of 3.3 m and a slope coefficient of 1.5; for the Baige landslide dam, a bottom width of 3 m, an initial water head of 3 m and a slope coefficient of 1.3 were used. The results of these calculations are shown in .
Figure 10. Analysis of discharge coefficients.
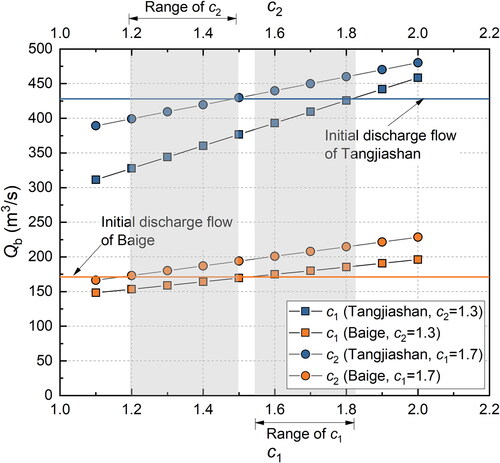
From the sensitivity analysis of the discharge coefficient, it is evident that c1 and c2 are positively correlated with the breach flow rate. Furthermore, an increase of water head in the breach significantly amplifies the sensitivity of these two parameters to flow rate. Additionally, the calculated values of c1 and c2 were compared with the initial discharge rates of two real-world cases. The results indicate that for the initial discharge of the Baige landslide dam, the values of both parameters are relatively consistent. However, for the initial discharge of the Tangjiashan landslide dam, the calculated discharge based on the suggested values for these parameters is smaller than the measured initial discharge. Nevertheless, Singh’s (Citation1996) suggested values for the two parameters generally fulfil the requirements of the two real-world case studies discussed in this research.
5. Results and discussion
5.1. Calculation results
Based on the parameters in and , the draining process of Tangjiashan landslide dam and Baige landslide dam is calculated using the breach model proposed in this study, including breach flow, width and depth development of breach and reservoir water lever, as shown in and .
Figure 11. The failure process of Tangjiashan landslide dam: (a) the discharge process; (b) the breach development; (c) the reservoir water level development.
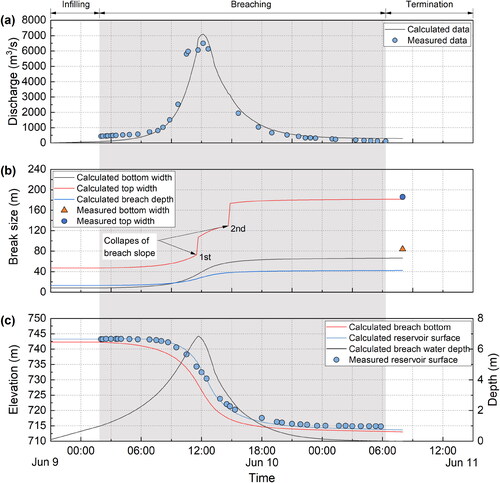
Figure 12. The failure process of Baige landslide dam: (a) the discharge process; (b) the breach development; (c) the reservoir water level development.
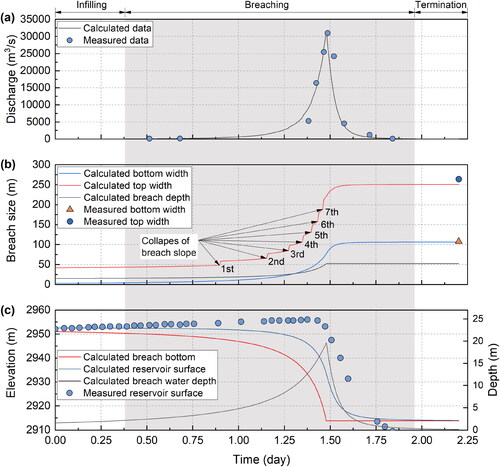
According to and , the calculated the peak value and peak time of the breach flow and the breach width are consistent with the measured results, and there is a roughly linear relationship between the first derivative of break flow and the breach expansion rate. The breach slopes of Tangjiashan landslide dam and Baige landslide dam collapsed 2 and 7 times, respectively. The calculated reservoir water level of Tangjiashan landslide dam agree well with the measured results. However, the calculated reservoir water lever in the late stage of discharge decreased faster than the measured one. The possible reason is the error in the storage capacity parameters of the Baige barrier lake. The calculated and measured results of key breaching outcomes, i.e. peak breach flow (Qp), time to peak discharge (Tp), final breach top width (B), final breach bottom width (b), final breach depth (D) and measured data, are shown in and .
Table 3. Comparison of breaching outcomes of Tangjiashan landslide dam.
Table 4. Comparison of breaching outcomes of Baige landslide dam.
From and , it shows an agreement between the calculated values and the measured ones in breach flow, such as peak value and time. The calculated breach sizes of the Baige landslide dam align well with reality, with a relative error of around 5%. While there are certain discrepancies in the calculated breach sizes of the Tangjiashan landslide dam, particularly in the breach bottom width and depth, which are around 20%. There is no process monitoring data for the size of the breach, making it difficult to compare the development process and identify the cause of the calculation result error.
5.2. Comparison with existing models
In this study, the commonly used mathematical model for landslide dam overtopping and collapse process was selected and compared with the model proposed in this research. Two models proposed by Zhong et al. (Citation2018a) and Chang and Zhang (Citation2010) were selected for the calculation of the draining process of the Tangjiashan landslide dam, and the other two models proposed by Zhang et al. (Citation2019) and Chen et al. (Citation2020), respectively, were selected for the calculation of the discharge process of the Baige landslide dam and compared with the calculation results of proposed model. and , respectively, provide a comparison of the failure process of Tangjiashan landslide dam and Baige landslide dam using different breach models.
Table 5. Comparison between calculated and measured data of Tangjiashan landslide dam breach.
Table 6. Comparison of measured and calculated data of Baige landslide dam breach.
The comparison of breach models for the calculation of draining process is listed in and . When calculating the failure of the Tangjiashan landslide dam, Zhong et al. (Citation2018a) set the final depth of the breach as a fixed value, that is, stop cutting when the breach erodes to that depth, and Chang and Zhang (Citation2010) did not list the peak flow time in his research. Therefore, the relevant calculation data is not listed in . Furthermore, the result provided by Chen et al. (Citation2020) is the water surface width at the breach, while the top and bottom widths of the breach can’t be determined. Therefore, the final size of the breach for the model by Chen et al. (Citation2020) was not considered as listed in .
The comparison analysis based on and shows that all five models can reflect the overtopping failure of landslide dams. The model proposed in this article considers the non-uniformity of particle size distribution in landslide dams, especially focusing on the vertical distribution pattern of particles. It controls the predicted peak flow velocity and the occurrence time within a smaller relative error range of approximately ±5%. However, it is undeniable that more cases will be needed to comprehensively assess the performance of each model, and the parameters of the dam material, especially the values of soil erodibility, may introduce uncertainty to the calculation data.
5.3. Influence of particle size
From the preceding discussion, it is evident that dam breach calculations involve numerous parameters. To further evaluate the model’s performance and understand the correlation between parameters and the dam breach process by analyzing the extent of their influence on the calculation results, certain factors were chosen for sensitivity analysis. Among the many input parameters for dam breach, the particle size of the dam material is particularly significant as it directly affects the initiation flow velocity of particles, thus serving as the most intuitive parameter reflecting soil erosion. Therefore, using the Tangjiashan landslide dam as an example, the dam breach process was calculated by separately adjusting the median particle size of the surface particles of the dam body by ±50%. The calculation results are presented in .
Figure 13. The failure process of Tangjiashan landslide dam under different median particle sizes: (a) discharge of breach; (b) development of breach.
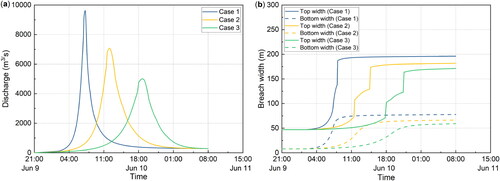
From the calculation results of dam failure with different median particle sizes, it can be observed that the median particle size of the dam material significantly influences the development process of dam failure. As shown in , with an increase in the median particle size, the peak flow rate of the breach decreases, while the peak time extends, and the water rise and fall speeds decrease continuously. Furthermore, the width expansion speed of the breach decreases, and the final residual breach size also decreases progressively.
However, as seen in , cases 2 and 3 show two collapses throughout the entire dam failure process, while in case 1, there is only one collapse. This discrepancy can be attributed to that, in case 1, the decreased particle size led to stronger erosion, resulting in rapid expansion of the top and bottom of the breach, with a small difference in expansion speed and no very steep slope formed. Consequently, the number of collapses at the breach was small. The key dam failure output results for the three cases are listed in .
Table 7. Influence of particle size on the dam breach process.
quantitatively demonstrates the extent of the influence of dam material particle size on the flow rate and development of the breach. It is clear that the particle size of the material significantly affects the flow rate, including both the peak flow rate and the peak time, but has a weaker impact on the width of the breach. Overall, the output results help mitigate the bias of the input data. However, the median particle size of landslide dams plays a crucial role in dam failure scenarios. As the consequences of various outcomes of flood disasters like dam failures differ significantly, corresponding emergency plans will also vary greatly.
5.4. Influence of particle distribution
When the material of the landslide dam exhibits non-uniformity in the vertical direction, the grading of the surface soil of the breach will vary at different heights of the breach, resulting in different development and flow processes of the breach. Thus, the focus of this article is on the influence of particle size distribution on the process of dam failure. To investigate the impact of different particle size distributions on the dam failure process, the Tangjiashan landslide dam was selected as a case study, and the dam failure development process under both inverse and uniform grading conditions was calculated separately. The calculation results are presented in .
Figure 14. The failure process of Tangjiashan landslide dam under different particle distributions: (a) discharge of breach; (b) development of breach.
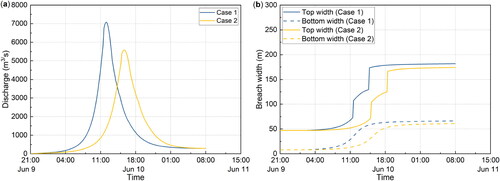
From , it is evident that different particle size distributions influence the dam failure process. Specifically, compared to the inverse grading dam body, the uniform grading dam body maintains coarse particles in the breach as it develops to the middle and lower parts of the dam body. This reduces the erosion of the breach soil by the overtopping water flow, resulting in a slower development of the breach and smaller flow peaks, with a corresponding delay in the peak time. However, in both cases, the breached slope exhibited two collapses, and the final width of the residual breach did not differ significantly.
The quantitative impact of particle distribution on the flow rate and size of the breach is listed in . It is evident that particle distribution significantly affects the flow rate at the breach, with peak time being more sensitive to changes in particle distribution than peak flow rate. Moreover, particle distribution also impacts the size of the breach, with the top width being more sensitive to particle distribution than the bottom width.
Table 8. Influence of particle distribution on the dam breach process.
This highlights the importance of considering the particle distribution of the dam body when calculating the actual flood caused by landslide dam failure. Emergency plans are mainly based on the evolution process of the dam failure flood, and the flow process at the breach serves as the initial input condition for such calculations. As the flow rate at the breach is sensitive to the particle distribution of the dam body, it is crucial to reasonably account for the non-uniformity of dam materials for calculation of dam breach.
6. Conclusion
In this study, we propose a new model for predicting the process of overtopping failure in landslide dams. The new model considers the vertical distribution of soil particles that is commonly ignored in existing dam failure models, therefore, directly addressing the shorting coming of current models and enables the consideration of the uneven spatial distribution of dam material properties. This will significantly improve the accuracy and reliability of landslide dam failure predictions.
The new model is mainly composed of four modules: (1) a vertical distribution model based on the three parameter Weibull distribution, for characteristic particle sizes of dam material; (2) the broad-crested weir equation based on water balance, for breach discharge; (3) a new derived sediment transport formular of total load that separately considers the transport of bed load and suspended load, for dam material erosion; (4) the breach deformation equations that separately computed for continuous erosion and intermittent collapse, for both horizontal and vertical expansion of the breach.
The performance of the new model has been evaluated using two case studies and compared to four existing models. It has been found that the model can describe the development of the breach and discharge, and the calculation results conform to the general law of overtopping-induced landslide dam break. The comparison of the calculated results with the measured data indicates that the new model proposed in this study can simulate the overtopping process of the landslide dam. Compared to the four existing models, the model proposed in this study can more accurately predict the peak flow rate and the occurrence time within a smaller error range. This improved performance is attributed to its more thorough consideration of heterogeneity that is present in the composition of landslide dam materials. To further verify this conclusion, sensitivity analysis was conducted on the distribution of particle size, and the results showed that the particle size distribution has a significant impact on the dam failure process, especially on the flow rate at the breach, including the peak flow rate and peak time. This aspect critically influences the rationality of the emergency plan for dam failure. Specifically, for inverse grading landslide dams, failure to consider the distribution of particle size could lead to overly conservative conclusions in the calculation results. This underscores the significance of the model established in this article.
It should be emphasized that the model proposed in this article is constructed for landslide dams characterized by particle size sorting, such as the dam formed by remote landslide. Dams formed by collapse typically consist of mixed sediments, often retaining the original strata sequence, resulting in insufficient particle sorting. As a result, the particle size distribution model and dam break simulation method established in this study may not be suitable for dam break calculations of this type of dam. For now, the method to simulate material composition for dams formed by collapses is the major limitation for the prediction of the dam break process in all available breach models. In addition, the soil erodibility of landslide dam fill varies greatly due to differences in soil type, compaction degree and moisture content, leading to a high level of uncertainty. To reduce these uncertainties, developing next generation or new physically based dam breach models and conducting uncertainty analyses by utilizing relevant simulation methods is indispensable.
Acknowledgement
The authors greatly acknowledge the constructive comments and suggestions of two anonymous reviewers.
Disclosure statement
The authors declare no conflict of interest.
Data availability statement
The input parameters and output results of the breach model used for real-world dam break calculation in this article are available from the digital data repository in Zhao (Citation2024).
Additional information
Funding
References
- Bagnold RA. 1956. The flow of cohesionless grains in fluids. Philos Trans R Soc London. 249(964):235–297.
- Bagnold RA. 1966. An approach to the sediment transport problem from general physics. US Government Printing Office.
- Bu X, Tang C, Qu Y, Xiang G, Jia T. 2017. Grain-size distribution and structural dimension of “7·4” giant debris-flow deposition in Shimian County, Sichuan Province. J Disaster Prev Mitig Eng. 37(6):1016–1022.
- Cai Y, Cheng H, Wu S, Yang Q, Wang L, Luan Y, Chen Z. 2020. Breaches of the Baige barrier lake: emergency response and dam breach flood. Sci China Technol Sci. 63(7):1164–1176. doi: 10.1007/s11431-019-1475-y.
- Casagli N, Ermini L, Rosati G. 2003. Determining grain size distribution of the material composing landslide dams in the Northern Apennines: sampling and processing methods. Eng Geol. 69(1–2):83–97. doi: 10.1016/S0013-7952(02)00249-1.
- Cencetti C, Di Matteo L. 2022. Mitigation measures preventing floods from landslide dams: analysis of pre- and post-hydrologic conditions upstream a seismic-induced landslide dam in Central Italy. Environ Earth Sci. 81(15):403. doi: 10.1007/s12665-022-10515-5.
- Chang D, Zhang L. 2010. Simulation of the erosion process of landslide dams due to overtopping considering variations in soil erodibility along depth. Nat Hazards Earth Syst Sci. 10(4):933–946. doi: 10.5194/nhess-10-933-2010.
- Chang D, Zhang L, Xu Y, Huang R. 2011. Field testing of erodibility of two landslide dams triggered by the 12 May Wenchuan earthquake. Landslides. 8(3):321–332. doi: 10.1007/s10346-011-0256-x.
- Chen J, Chen R, Cui Z. 2021. Research progress on the morphology and sedimentology of long runout landslides. Earth Sci Front. 28(4):349–360.
- Chen S, Chen Z, Zhong Q. 2019. Progresses of studies on failure mechanism and numerical dam failure model of earth-rockfill dam and landslide dam. Water Resour Hydropower Eng. 50:27–36.
- Chen Z, Zhang Q, Chen S, Wang L, Zhou X. 2020. Evaluation of barrier lake breach floods: insights from recent case studies in China. Wiley Interdiscip Rev-Water. 7(2):e1408. doi: 10.1002/wat2.1408.
- Costa JE. 1985. Floods from dam failures. Washington, DC: U.S. Geological Survey. Open-File Report; p. 85–560.
- Costa JE, Schuster RL. 1988. The formation and failure of natural dams. Geol Soc Am Bull. 100(7):1054–1068. doi: 10.1130/0016-7606(1988)100<1054:TFAFON>2.3.CO;2.
- Dong J, Tung Y, Chen C, Liao J, Pan Y. 2009. Discriminant analysis of the geomorphic characteristics and stability of landslide dams. Geomorphology. 110(3–4):162–171. doi: 10.1016/j.geomorph.2009.04.004.
- Dong J, Tung Y, Chen C, Liao J, Pan Y. 2011. Logistic regression model for predicting the failure probability of a landslide dam. Eng Geol. 117(1–2):52–61. doi: 10.1016/j.enggeo.2010.10.004.
- Duan W, Huang W, Wei H, Dai P. 2021. Review and prospects of landslide dam breaching modelling. J Yangtze River Sci Res Inst. 38:51–58.
- Einstein HA. 1950. Bed-load function for sediment transportation in open channel flows. Tech Bull. 1026.
- Fan X, Xu Q, Alonso-Rodriguez A, Subramanian SS, Li W, Zheng G, Dong X, Huang R. 2019. Successive landsliding and damming of the Jinsha river in eastern Tibet, China: prime investigation, early warning, and emergency response. Landslides. 16(5):1003–1020. doi: 10.1007/s10346-019-01159-x.
- Froehlich DC. 1995. Embankment dam breach parameters revisited. Conference on Water Resources Engineering; New York.
- Froehlich DC. 2016. Predicting peak discharge from gradually breached embankment dam. J Hydrol Eng. 21(11):04016041. doi: 10.1061/(ASCE)HE.1943-5584.0001424.
- Hu X, Luo G, Wang J, Liu J, Hu H. 2010. Seepage stability analysis and dam-breaking mode of Tangjiashan barrier dam. Chin J Rock Mech Eng. 29(7):1409–1417.
- Huang X, Yu T, Wang M, Zhu S, Song B, Liu W. 2021. Remote sensing dynamic analysis of chain characteristics of long range and high position landslide in Jinsha River junction zone: a case study of Baige landslide. Chin J Geol Hazard Control. 32(5):40–51.
- Li K, Wang Y, Cheng Q, Lin X. 2021. Effects of fractal particle size distribution on segregation of granular flows. Chin J Rock Mech Eng. 40(2):330–343.
- Liu N, Chen Z, Zhang J, Lin W, Chen W, Xu W. 2010. Draining the Tangjiashan barrier lake. J Hydraul Eng. 136(11):914–923. doi: 10.1061/(ASCE)HY.1943-7900.0000241.
- Mei S, Chen S, Zhong Q, Yan Z. 2018. Parametric model for breaching analysis of earth-rock dam. Adv Eng Sci. 50:60–66.
- Peng M, Zhang LM. 2012. Breaching parameters of landslide dams. Landslides. 9(1):13–31. doi: 10.1007/s10346-011-0271-y.
- Shen D, Shi Z, Peng M, Zhang L, Jiang M. 2020. Longevity analysis of landslide dams. Landslides. 17(8):1797–1821. doi: 10.1007/s10346-020-01386-7.
- Singh VP. 1996. Dam breach modeling technology. Water Sci Technol Lib. 17.
- Walder JS, O Connor JE. 1997. Methods for predicting peak discharge of floods caused by failure of natural and constructed earthen dams. Water Resour Res. 33(10):2337–2348. doi: 10.1029/97WR01616.
- Wu H, Nian T, Shan Z. 2023. Investigation of landslide dam life span using prediction models based on multiple machine learning algorithms. Geomat Nat Hazards Risk. 14(1):2273213. doi: 10.1080/19475705.2023.2273213.
- Wu H, Shi A, Ni W, Zhao L, Cheng Z, Zhong Q. 2024. Numerical simulation on potential landslide–induced wave hazards by a novel hybrid method. Eng Geol. 331:107429. doi: 10.1016/j.enggeo.2024.107429.
- Wu W. 2013. Simplified physically based model of earthen embankment breaching. J Hydraul Eng. 139(8):837–851. doi: 10.1061/(ASCE)HY.1943-7900.0000741.
- Wu W, Li H. 2017. A simplified physically-based model for coastal dike and barrier breaching by overtopping flow and waves. Coastal Eng. 130:1–13. doi: 10.1016/j.coastaleng.2017.09.007.
- Wu W, Marsooli R, He Z. 2012. Depth-averaged two-dimensional model of unsteady flow and sediment transport due to noncohesive embankment break/breaching. J Hydraul Eng. 138(6):503–516. doi: 10.1061/(ASCE)HY.1943-7900.0000546.
- Wu W, Vieira DA, Wang SSY. 2004. One-dimensional numerical model for nonuniform sediment transport under unsteady flows in channel networks. J Hydraul Eng. 130(9):914–923. doi: 10.1061/(ASCE)0733-9429(2004)130:9(914).
- Wu W, Wang SS. 2007. One-dimensional modeling of dam-break flow over movable beds. J Hydraul Eng. 133(1):48–58. doi: 10.1061/(ASCE)0733-9429(2007)133:1(48).
- Xu Y, Zhang LM. 2009. Breaching parameters for earth and rockfill dams. J Geotech Geoenviron Eng. 135(12):1957–1970. doi: 10.1061/(ASCE)GT.1943-5606.0000162.
- Yan Z, Wei Y, Cai H. 2009. Formation mechanism and stability analysis of barrier dam. Chin J Geol Hazard Control. 20:55–59.
- Zhang L, Xiao T, He J, Chen C. 2019. Erosion-based analysis of breaching of Baige landslide dams on the Jinsha river, China, in 2018. Landslides. 16(10):1965–1979. doi: 10.1007/s10346-019-01247-y.
- Zhao T. 2024. Dataset for dam failure calculation of Tangjiashan landslide dam and Baige landslide dam v.1. The University of Melbourne. https://melbourne.figshare.com/articles/dataset/Dataset_for_dam_failure_calculation_of_Tangjiashan_landslide_dam_and_Baige_landslide_dam_v_1_rar/25497712.
- Zhao T, Chen S, Fu C, Zhong Q. 2018. Influence of diversion channel section type on landslide dam draining effect. Environ Earth Sci. 77(2):54–65. doi: 10.1007/s12665-017-7217-1.
- Zhao T, Chen S, Fu C, Zhong Q. 2019. Centrifugal model test on the failure mechanism of barrier dam overtopping. KSCE J Civ Eng. 23(4):1548–1559. doi: 10.1007/s12205-019-0375-9.
- Zhong Q, Chen S, Shan Y. 2020a. Numerical modeling of barrier dam overtopping - induced breach process considering barrier soil erodibility variations along depth. Yangtze River. 51(1):180–186.
- Zhong Q, Chen S, Shan Y. 2020b. Numerical modeling of breaching process of Baige dammed lake on Jinsha River. Adv Eng Sci. 52(2):29–37.
- Zhong Q, Wang L, Chen S, Chen Z, Shan Y, Zhang Q, Ren Q, Mei S, Jiang J, Hu L, et al. 2021. Breaches of embankment and landslide dams; state of the art review. Earth-Sci Rev. 216:103597. doi: 10.1016/j.earscirev.2021.103597.
- Zhong QM, Chen SS, Mei SA, Cao W. 2018a. Numerical simulation of landslide dam breaching due to overtopping. Landslides. 15(6):1183–1192. doi: 10.1007/s10346-017-0935-3.
- Zhong QM, Chen S, Deng Z. 2018b. Breach mechanism and numerical modeling of barrier dam due to overtopping failure. Sci Sin-Technol. 48(9):959–968. doi: 10.1360/N092017-00213.