
 ?Mathematical formulae have been encoded as MathML and are displayed in this HTML version using MathJax in order to improve their display. Uncheck the box to turn MathJax off. This feature requires Javascript. Click on a formula to zoom.
Abstract
Natural disasters are becoming increasingly regional, frequent, and complex. Semi-quantitative risk assessments based on risk indices or relative risk levels lack quantitative parameters to characterize losses adequately. This study focuses on earthquakes and geological disasters, quantitatively assessing the risk of probable maximum loss (PML) from multi-hazard on the Tibet Plateau (TP) in terms of both absolute and relative values. The results indicate that total PML from multi-hazard on the TP is estimated at 465.5 billion CNY, with a relative value of 5.3%. The total loss value of towns with very high absolute PML is estimated at 254.8 billion CNY, while the relative loss value of towns with very high relative PML is 25.1%. Towns with high absolute value of PML for multi-hazard may have higher fixed asset values, while those with high relative value imply higher vulnerability. Adjusting building structures and reducing the vulnerability of buildings could effectively mitigate the risk of disaster losses caused by multiple hazards.
1. Introduction
Due to its strong tectonic activity and complex topography, the Tibet Plateau (TP) is prone to multiple natural disasters, including earthquakes, landslides, debris flows, and flash floods (Cui and Jia Citation2015). Since 2000, earthquake-triggered landslide events on the TP have accounted for 42% of the total number of such events worldwide (Zhao et al. Citation2023a). Multi-hazard events with characteristics such as spatio-temporal clustering or chain triggering have broadened the scope of disaster impact and the extent of losses on the TP (Cui et al. Citation2017). For instance, on September 5, 2022, an Ms 6.8 (Mw 6.6) earthquake struck Luding County, Sichuan Province, China, triggering at least 5336 landslides, affecting 545000 people, and resulting in a direct economic loss (DEL) of 15.5 billion CNY (Dai et al. Citation2023). Similarly, on June 1, 2022, an Ms 6.1 earthquake occurred in Lushan County, Ya’an City, Sichuan Province, China, leading to approximately 2352 landslides and affecting 14427 people (Shao et al. Citation2022). Furthermore, on April 25, 2015, the Mw 7.8 Gorhka earthquake hit Nepal, triggering at least 4312 landslides and resulting in the loss of approximately 9000 lives (Kargel et al. Citation2016).
Around the world, the consecutive hazardous events caused by the 2023 Turkey earthquake and the 2024 Japan earthquake resulted in significant losses. On February 6, 2023, a series of earthquakes with magnitudes of Mw 7.8 and 7.6 struck Mala, Kahraman, Turkey, killing more than 52000 people (Dal Zilio and Ampuero Citation2023) and causing direct infrastructure losses exceeding 34 billion USD (Ozkula et al. Citation2023). This event triggered at least 3673 landslides (Görüm et al. Citation2023). On January 1, 2024, an earthquake with a magnitude of Mw 7.5 on the Nengden Peninsula in Japan killed at least 241 people (Ishikawa Citation2024), followed by a tsunami with a maximum rise of 6.2 meters (Heidarzadeh et al. Citation2024) and at least 930 landslides in mountainous areas (Gomez Citation2024).
The expansion of infrastructure and socio-economic development has heightened asset exposure risks amidst the prevalence of multiple hazards on the TP (Wu et al. Citation2019; Ran et al. Citation2022). Between 2000 and 2020, the annual urbanization growth rate on the TP stood at 12.6%, with a significant portion of this expansion occurring in regions highly susceptible to geological, hydrological, and other hazards (Yin et al. Citation2024). Moreover, infrastructure such as roads, cable channels, railways, and associated facilities on the TP are extensively distributed in areas prone to debris flows and floods (Chang et al. Citation2021; Cui et al. Citation2022). For instance, along the Ya’an to Nyingchi section of the Qinghai–Tibet Railway, a total of 1702 instances of rockfalls, landslides, and debris flows were recorded (Zou et al. Citation2020).
The United Nations’ Agenda for Sustainable Development for the twenty first Century first introduced the concept of ‘multi-hazard’ (UNEP 1992). Assessing the risks posed by multiple potential hazards is essential for comprehensive disaster risk management and the formulation of disaster reduction measures. Some scholars have developed multi-hazard susceptibility zoning maps using factors like hazard-influencing factors and land use data to assess the exposure to multi-hazard within susceptibility zoning maps (Nachappa et al. Citation2020; Yanar et al. Citation2020; Karakas et al. Citation2023).
The primary challenges in current multi-hazard risk assessment research include scientifically and reasonably depicting the relationships and impacts of multiple hazards, as well as quantitatively expressing the risks associated with them (De Angeli et al. Citation2022; López-Saavedra and Martí Citation2023). Gill and Malamud (Citation2016) summarized the relationship between multiple hazards as triggering, increased probability, and catalysis/impedance. Tilloy et al. (Citation2019) classified the relationship among multiple hazards into triggering, change condition, compound, independence, and mutually exclusive categories. Lee et al. (Citation2024) utilized the Global Hazard Database to categorize global multi-hazard events into four categories: preconditioned/triggering, multivariate, temporally compounding, and spatially compounding multi-hazard events, and highlighted landslides as the primary secondary hazards. Karatzetzou et al. (Citation2022) devised an earthquake-flood hazard scenario and evaluated the individual and combined (triggered) hazard risks confronting the road network. Liu et al. (Citation2021) examined the triggering relationships among different hazards using a hazard matrix, employed radar maps to assess the multi-hazard intensity influenced by the hazard coupling effect in Beijing Huairou Science City, and integrated land use data to perform multi-hazard risk analysis.
Currently, research in the field of multi-hazard events on the TP primarily focuses on two main areas. First, combining the susceptibility of individual hazards to obtain the spatial distribution characteristics of multi-hazard susceptibility. Secondly, exploring multi-hazard chains within a small scale through historical disaster cases and numerical simulations, including scenario reconstruction of formula characteristics. Rusk et al. (Citation2022) combined susceptibility maps of floods, landslides, and wildfires in the Hindu Kush Himalayas to identify areas with high susceptibility to multi-hazard events. Zhu et al. (Citation2021) conducted a hypothetical scenario simulation of the landslide-flood disaster chain based on the heavy rainfall–debris flow–dam break–landslide disaster chain in Aniangzhai, Sichuan Province, China, on June 17, 2020. Based on field surveys and remote sensing interpretation, Zhao et al. (Citation2021) identified the locations of landslides and barrier lakes triggered by the Linzhi earthquake on November 18, 2017, and then constructed a landslide susceptibility map.
Disaster risk is commonly defined as the likelihood of life or asset loss or destruction within a specified timeframe (UNISDR Citation2015). Several studies have examined disaster risks on the TP focusing on economic losses. Yang et al. (Citation2023) integrated inundation range, flood depth, land use, and socioeconomic data to produce a flood loss risk map for the Yarkand River Basin in Xinjiang, China. Chen et al. (Citation2024) employed probabilistic models and numerical simulations to estimate the DEL incurred by buildings from the Yangling Gully debris flow. Wei et al. (Citation2022) assessed the risk of building loss in two villages in Jiuzhaigou by considering the intensity of debris flow and rockfall disasters, along with building vulnerability.
However, there remains a paucity of studies focusing on multiple hazard events and conducting quantitative analyses of economic risks on a large scale on the TP. Quantifying the DEL risks associated with various hazards on the TP, estimating their potential financial impact, and mitigating the accumulation of ‘bad assets’ will aid decision-makers in conducting cost-effective analyses of disaster impacts, avoiding capital inflow into high-risk areas, allocating resources judiciously, and enhancing the future development prospects of the social economy (UNISDR Citation2013, Citation2015; Wu et al. Citation2017; Inter-Agency Standing Committee and the European Commission Citation2020).
Therefore, our focus lies on earthquakes and geological hazards, which inflict severe damage and occur frequently on the TP. We quantitatively assessed the probable maximum loss (PML) risk from multi-hazard to economic assets. The primary objective of this study is to identify regions with high values of loss risk and loss rates, providing a quantitative depiction of the risk patterns associated with the multi-hazard on the TP in terms of loss magnitude. Furthermore, we explored the impact of changes in vulnerability indicators on mitigating PML from multi-hazard on the TP.
2. Materials and methods
2.1. Study area
The study area is situated on the TP, spanning from 24°16′24″N to 40°1′9″N and 73°29′56″E to 105°40′29″E (). The interior of the TP is relatively flat, whereas the topography at the plateau’s edge is undulating and characterized by steep slopes (Fielding et al. Citation1994; Liu-Zeng et al. Citation2008). Notably, all peaks in the world over 7000 m are located on the TP (Yao et al. Citation2021). The altitude range in the study area is 86–8682 m, with a relative height difference of 8596 m. The annual mean temperature of the TP decreases from east to west, while the annual mean precipitation decreases from southeast to northwest (Kuang and Jiao Citation2016). In the future, the plateau is expected to experience a general warming trend, which will increase the risk of geological hazards (Cui and Jia Citation2015; You et al. Citation2021; Ya et al. Citation2023). In the study area, numerous rivers are predominantly distributed in the east and south, with many of their valleys characterized by deep terrain, rendering them more susceptible to landslides (Wang et al. Citation2021; Zhao et al. Citation2023b).
Figure 1. Location of the study area: the names of 6 provinces are shown.
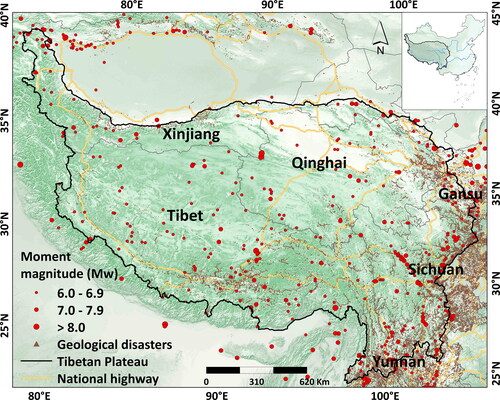
Owing to crustal uplift and intense river downcutting, mountain disasters like landslides and debris flows occur frequently (Cui et al. Citation2019). It is estimated that there are over 2000 debris flows and more than 1500 landslides on the TP (Cui and Jia Citation2015). The increasing frequency of geological hazards in China corresponds to a rising trend in economic losses. As per the China Statistical Yearbook, the DEL attributed to geological disasters in China amounted to 2.3 billion CNY and 5.0 billion CNY in 2019 and 2020, respectively. Notably, Sichuan Province incurred the highest DEL due to geological disasters, totaling 2.3 billion CNY and securing the top rank. Gansu Province and Yunnan Province followed, with losses ranking second and third, respectively.
The TP is one of the most seismically active regions in the contemporary era, characterized by six major fault zones and six active blocks (Zhang et al. Citation2003). According to statistics, approximately 118 earthquakes of Mw 7 or higher have been recorded on the TP, with the majority of them concentrated on the southern and eastern margins (Deng et al. Citation2014). Notably, earthquakes with Mw 7 or above were predominantly located in the Qilian Mountains. Additionally, eight significant earthquakes of Mw 7 or above occurred along the four boundary zones of the Bayan Har Block. The giant arc-shaped Himalayan front thrust-nappe fault zone is known for frequently experiencing Mw 8 earthquakes (Li et al. Citation2021). Earthquakes occurring on the periphery of the TP are characterized by large magnitudes and result in severe disasters (Xu et al. Citation2023). In contrast, earthquakes in the central and eastern regions of the plateau also exhibit large magnitudes and lead to significant disasters (Xu et al. Citation2023). However, earthquakes in the central and western regions of the plateau tend to have moderate magnitudes and cause comparatively minor disasters (Xu et al. Citation2023).
2.2. Methods
In the context of the study, multi-hazard risk pertains to the risk of PML resulting from the clustering of earthquakes and geological disasters (such as landslides and collapses) in either space or time. PML, in this study, refers to the maximum loss expected to occur within the 475-year return period (UNISDR Citation2013), encompassing direct damage to buildings, infrastructure, equipment, etc. The risk outcome is expressed through the absolute or relative value of the expected annual loss that the disaster may induce. According to GAR2013 (UNISDR Citation2013), the relative value of multi-hazard PML denotes the absolute value of multi-hazard PML as a percentage of fixed assets. Initially, we estimated the PML caused by earthquakes and geological disasters separately using their respective PML models. Subsequently, we aggregated and combined the results to obtain a quantitative assessment of multi-hazard PML risks at the township level on the TP, alongside risk zoning maps ().
Figure 2. Methodology flow chart of this study.
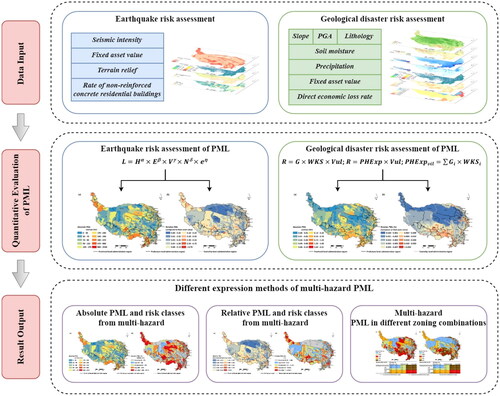
2.2.1. Earthquake risk assessment of PML
According to the disaster risk framework for establishing a disaster loss risk assessment model (Wu et al. Citation2019), the functional relationship between the regional earthquake PML value (L) and hazard factors (H), exposure factors (E), vulnerability factors (V), and physical environmental conditions (N) is as follows,
(1)
(1)
Based on data from 192 seismic events in mainland China spanning from 1990 to 2015, seismic intensity, fixed asset value, non-steel-concrete residential building (NSCRB) proportion, and terrain undulation were ultimately chosen as input variables for the assessment model (He Citation2019). The analysis of the relationship between the assessed value and the observed value indicated that the model, with R2 = 0.7 (p < 0.05), can explain 70% of the changes in PML. The results of the PML risk assessment were found to be satisfactory, with the calibrated parameters for
and
being 8.05, 0.64, 3.25, 0.11, and −16.26, respectively.
2.2.2. Geological disaster risk assessment of PML
PML model of geological hazards is given by Nadim et al. (Citation2006),
(2)
(2)
(3)
(3)
where
is the risk of geological hazards,
is the hazard of geological hazards,
is the value of fixed assets exposed to the risk of geological disasters,
is the DEL rate,
is the exposure.
The calculation of geological hazard model is given by Nadim et al. (Citation2006),
(4)
(4)
where
is the relative geological hazard (Figure S1),
is the slope factor,
is the lithological condition factor,
is the soil moisture condition,
represents the precipitation factor, and
represents the seismic condition.
The exposure is estimated by multiplying the occurrence frequency of geological disasters by the value of fixed assets in the exposed area, that is, the exposure degree of township i (),
(5)
(5)
where
represents the probability of occurrence of disaster events within a 1 km2 spatial grid unit (), and
is the value of fixed assets within a 1 km2 spatial grid unit. Assuming that a typical severe geological disasters event impacts, on average, 10% of the assets in the exposed area.
Table 1. The probability of occurrence of geological hazard events within a 1 km2 spatial grid unit.
2.2.3. Multi-hazard risk assessment of PML
The PML from multi-hazard on the TP are obtained by accumulating the PML of earthquakes (Figure S2) and geological disasters (Figure S3). The classification method for PML risk of multi-hazard refers to the World Resources Institute (WRI) and adopts a quantile classification method to classify them. The PML for multi-hazard were divided into five risk levels: very low, low, moderate, high and very high.
The PML from earthquakes and geological disasters are divided into five grades using a grading method. Different risk zones of PML from multi-hazard were obtained by combining the risk grades of individual disasters (). The risk classification of multi-hazard on the TP was divided into five levels: low multi-hazard risk (LMR), moderate multi-hazard risk (MMR), high multi-hazard risk (HMR), high earthquake risk (HER), and high geological risk (HGR).
Table 2. Multi-hazard risk classification method based on the expected DEL risk level induced by a single hazard.
2.3. Data
This study used four types of data (Figure S4). First, the peak ground acceleration (PGA) data and seismic intensity data for the 475-year return period were acquired from the Chinese Earthquake Administration (https://www.csi.ac.cn/).
Second, asset value data were obtained from Wu et al. (Citation2014, Citation2018). They established Chinese prefecture-level asset values, then used fixed asset value spatialization technology combined with population density, night lighting, and road network density, created the grid distribution map of the fixed assets value of China in 2015. Subsequently, by drawing on the research findings of Wu et al. (Citation2017), we updated and generated the spatial distribution map of fixed assets value in the study area for 2020.
Third, NSCRB proportion was derived from Chinese census data (https://data.cnki.net/), which included the number of houses based on load-bearing types at the county level across the entire study area in 2010 and at the county level in Tibet in 2020. The DEL value of geological disasters was sourced from the statistical yearbook of China (https://data.cnki.net/) from 2004 to 2022. The proportion of DEL for geological disasters to exposed fixed assets was calculated to obtain the DEL rate of geological disasters year by year. Then, the multi-year average was calculated to obtain the DEL rate of geological disasters.
Fourth, the terrain relief and slope factor were calculated based on SRTM digital elevation data provided by USGS (https://www.usgs.gov/). The lithological condition factor was derived from the global lithology map (Hartmann and Moosdorf Citation2012). Soil moisture conditions were assessed using terrestrial soil moisture data of China from 2002 to 2018 (Mao Citation2021), with the average soil moisture calculated over this period. The 100-year extreme monthly rainfall was determined based on monthly precipitation data from CN051, released by the Climate Change Research Center of the Chinese Academy of Sciences (Wu and Gao Citation2013).
3. Results
3.1. Absolute PML and risk classes from multi-hazard
The total PML for multi-hazard on the TP is estimated at 465.5 billion CNY. In terms of regional distribution, 30.3% of the total PML for multi-hazard on the TP is concentrated in Sichuan Province, 24.3% in Yunnan Province, 17.2% in Gansu Province, 16.8% in Tibet, 9.3% in Qinghai Province, and 2.2% in Xinjiang (). According to the classification of absolute loss, the absolute value in very high PML risk areas is estimated at 254.8 billion CNY. The absolute value in very high PML risk areas is estimated at 97.4 billion CNY ().
Figure 3. Township-level absolute value (a) and risk class (b) of multi-hazard PML on the TP.
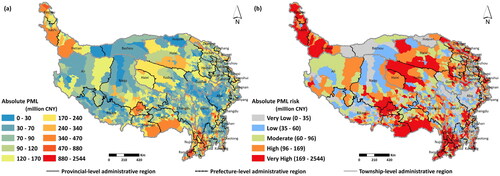
Areas on the TP experiencing very high and high absolute PML for multi-hazard are likely to coincide with regions of significant asset valuation. For instance, the total asset value of towns classified as very high risk amounts to 4191.4 billion CNY, representing 48.0% of the TP's asset value. Meanwhile, the absolute value of PML incurred by towns within these very high-risk areas account for 54.7% of the TP's total PML.
3.2. Relative PML and risk classes from multi-hazard
The relative value of PML could better express the economic impact of disaster events (UNISDR Citation2013). The relative value of PML for multi-hazard on the TP is 5.3%. The relative value of PML in 64 towns was greater than 50%, accounting for 1.7% of all towns (). According to the classification of relative losses, the relative value in very high PML risk areas is 25.1%. The relative value in high PML risk areas is 14.2% ().
Figure 4. Township-level relative value (a) and risk class (b) of multi-hazard PML on the TP.
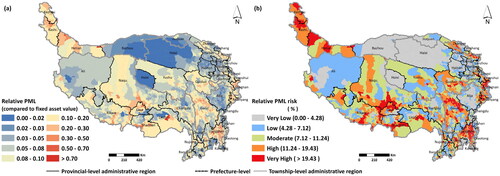
Although the absolute loss value and fixed asset value within townships with very high and high relative value risk levels may not be very high, the value of their exposed assets may be more vulnerable compared to other townships. For example, the absolute value of PML in towns with very high relative value risk level is 72.0 billion CNY, and their fixed asset value account for 3.3% of the TP's total asset value. However, the relative value of PML in these towns is 4.7 times higher than that of the TP.
3.3. Multi-hazard PML in different zoning combinations
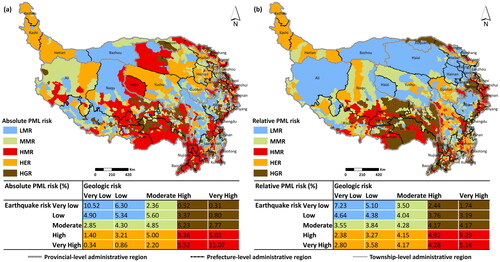
According to the absolute loss combination risk classification (), 13.0% of towns are confronting HER, with the same percentage facing HGR, while an additional 27.0% are encountering HMR. The PML in the HER is estimated at 77.6 billion CNY, with HGR accounting for 33.4 billion CNY, and HMR totaling 274.6 billion CNY. Based on the relative loss combination risk classification (), 20.3% of towns are facing HER, 19.5% are facing HGR, and 19.6% are facing HMR. The relative value of PML in the HER is 17.0%, in HGR it is 4.8%, and for HMR, it is 17.1%.
Figure 5. Absolute risk class (a) and relative risk class (b) of multi-hazard PML at the township-level on the TP.
4. Discussion
4.1. Regional differences in risk of multi-hazard PML on the TP
Disasters are inevitable, but their impact can be mitigated through government-promulgated disaster mitigation measures (Li et al. Citation2017). Comprehending the PML in different regions is of great significance for the government to formulate disaster reduction measures and minimize economic losses (De Moel et al. Citation2009; Whitman et al. Citation1997).
We calculated the multi-hazard PML and the value of fixed assets in six provinces (). The absolute value of multi-hazard PML from high to low are Sichuan, Yunnan, Gansu, Tibet, Qinghai, and Xinjiang. The relative value from high to low is Xinjiang, Sichuan, Tibet, Yunnan, Gansu, and Qinghai. The multi-hazard PML in Sichuan Province reached 140.8 billion CNY, making it the largest on the TP. Sichuan Province is situated in the southeastern part of the TP. Earthquakes with a magnitude greater than 7.0 on the Richter scale are primarily distributed along the southern and eastern edges of the TP (Deng et al. Citation2014). These regions undergo intense tectonic activity, feature steep terrain, and have abundant fragmented materials. The likelihood of landslides triggered by earthquakes is high, presenting a significant risk and resulting in substantial losses (Liu et al. Citation2015; Kargel et al. Citation2016). On May 12, 2008, the Wenchuan earthquake occurred, with its epicenter in Wenchuan County, Aba, Sichuan Province. By April 25, 2009, the earthquake had triggered over 50000 landslides, causing 69225 deaths, 374640 injuries, and extensive property losses (Qi et al. Citation2010).
Table 3. PML for multi-hazard and fixed asset values in six provinces.
For relative losses, Xinjiang has the highest loss rate, reaching 14.5%. The loss rate is associated with the vulnerability of the affected structures, and the resilience of building structures is one of the key factors influencing the extent of losses (Yamin et al. Citation2017). Xinjiang had the highest average proportion of non-reinforced concrete structures. Structures like bricks and stones, which lack reinforcement, are more vulnerable to earthquakes and geological disasters (Işık et al. Citation2023; Adanur Citation2010).
4.2. The impact of changes in vulnerability indicators on PML
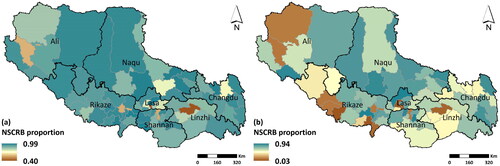
The extent of building damage is closely related to the type of building structure (Kang and Kim Citation2016). The NSCRB are commonly used to assess vulnerability to natural hazards (Luo et al. Citation2023). Mitigating disaster risks can be effectively achieved through reducing the vulnerability of buildings (de Ruiter et al. 2021). illustrates the spatial changes in the proportion of NSCRB in Tibet for 2010 and 2020. Compared to 2010, Tibet’s NSCRB ratio decreased by 0.2. Particularly notable is the region of Rikaze, which experienced the most significant decrease in NSCRB, with the average ratio dropping from 0.9 in 2010 to 0.6 in 2020.
Figure 6. Proportion of NSCRB in Tibet in 2010 (a) and 2020 (b).
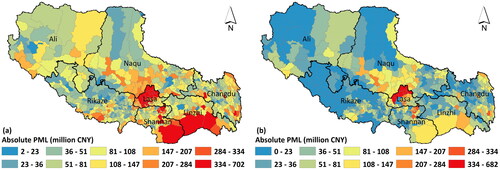
With the decrease in the number of NSCRB, Tibet’s multi-hazard PML decreased by 39.2 billion CNY, representing a decrease of 50.1%. The multi-hazard PML in Rikaze experienced the most substantial decrease, reaching 63.1% (). This outcome underscores the beneficial impact of improving housing building structures in Tibet on reducing the risk of multi-hazard PML.
Figure 7. The multi-hazard PML in Tibet for 2010 (a) and 2020 (b).
4.3. Limitation
This study has two main limitations. First, there are limitations in expressing risk. Given the complexity of earthquake and geological hazard mechanisms, the PML of multi-hazard events in this study was computed by aggregating and combining the PML of individual hazards. The explicit modeling of disaster mechanism processes was lacking, and the distinctive characteristics of multi-hazard factors could not be adequately captured, including interaction relationships and the extent of cascading risks.
Secondly, there is uncertainty in the risk assessment results. We used PML to quantify the DEL risk of multi-hazard. However, according to the concept of PML, we may have underestimated the PML. There are three primary reasons for this. First, the probability of occurrence and the DEL rate of geological disasters in the geological disaster PML model tend to reflect annual averages. This results in significant neglect of years with high historical disaster frequencies and substantial losses, leading to an underestimation of the final loss results. Secondly, with economic development, fixed assets continue to accumulate, and exposure continues to increase, suggesting that risks will expand in the future. Thirdly, we failed to take into account the impact and damage inflicted on individuals by multi-hazard events.
In future research on multiple hazards on the TP, we could focus on a more comprehensive consideration of the various types of hazards occurring on the TP. Additionally, we could aim to more accurately depict the relationships between the effects and impacts of different hazards, while also fully considering the dynamic changing trends of hazards on the TP within the context of climate change. For instance, Shugar et al. (Citation2021) investigated the ice avalanche–mudslide disaster chain in Uttarakhand, India, which occurred in February 2021. Their analysis of the dynamic process, causes, and social impacts of the event contributes to a better understanding of the heightened hazard risks and increased impacts of disasters in the Himalayas amid climate warming. Peng et al. (Citation2023) employed the HEC–RAS hydrodynamic model to analyze the process of ice avalanche–landslide–dam breach and its impact range on two glacial lakes (Ranzeria Co and Jiweng Co) in the Nyainqentanglha Mountains of the TP. Their research contributes to understanding the mechanisms of glacial lake dam breaches and to better managing glacial lake disasters.
5. Conclusion
While academic research on multiple hazards on the TP is growing, there remains a scarcity of studies that quantitatively evaluate risks from the standpoint of PML. Through the integration of models assessing PML stemming from earthquakes and geological disasters, we have estimated the PML for multi-hazard on the TP. Our study offers a more intuitive quantification of the severity of multi-hazard occurrences on the TP and the efficacy of measures aimed at mitigating disaster risks at the building level.
The total PML for multi-hazard on the TP is estimated at 465.5 billion CNY, with a relative value of 5.3%. Risk classification results based on the absolute value indicate that the absolute losses in very high PML risk areas amount to 254.8 billion CNY, while in high PML risk areas, the absolute losses are calculated at 97.4 billion CNY. Regarding risk classification results based on relative values, the relative losses in very high PML risk areas are 25.1%, and in high PML risk areas, they are 14.2%. Towns with very high and high absolute values of PML for multi-hazard often have higher fixed assets value. Conversely, towns with very high and high relative values imply a higher proportion of fixed assets value lost due to earthquakes and geological disasters, indicating greater vulnerability.
Reducing the vulnerability of residential buildings is paramount to mitigating the risk of PML from multi-hazard. In Tibet, the average proportion of NSCRB decreased by 0.2, leading to a 50.1% reduction in PML. Consequently, the implementation of more stringent seismic building codes for existing non-seismically resistant structures and the execution of relocation measures for high-vulnerability communities will diminish potential future property losses.
Supplemental Material
Download MS Word (14 MB)Disclosure statement
The authors declare that they have no known competing financial interests or personal relationships that could have appeared to influence the work reported in this paper.
Data availability statement
The data that support the findings of this study are available from the corresponding author on reasonable request.
Additional information
Funding
References
- Adanur S. 2010. Performance of masonry buildings during the 20 and 27 December 2007 Bala (Ankara) earthquakes in Turkey. Nat Hazards Earth Syst Sci. 10(12):2547–2556. doi: 10.5194/nhess-10-2547-2010.
- Chang M, Cui P, Dou X, Su F. 2021. Quantitative risk assessment of landslides over the China–Pakistan economic corridor. Int J Disaster Risk Reduct. 63:102441. doi: 10.1016/j.ijdrr.2021.102441.
- Chen M, Luo Y, Tang C, Li N. 2024. Quantitative assessment of expected direct economic losses of buildings for debris flows in multiple rainfall intensity scenarios in Yangling Gully, Southwest China. Nat Hazards. 120(3):2993–3014. doi: 10.1007/s11069-023-06315-0.
- Cui P, Ge Y, Li S, Li Z, Xu X, Zhou GGD, Chen H, Wang H, Lei Y, Zhou L, et al. 2022. Scientific challenges in disaster risk reduction for the Sichuan–Tibet railway. Eng Geol. 309:106837. doi: 10.1016/j.enggeo.2022.106837.
- Cui P, Guo X, Jiang T, et al. 2019. Disaster effect induced by Asian water tower change and mitigation strategies. Bull Chinese Acad Sci. (Chinese Version) 34(11):1313–1321. doi: 10.16418/j.issn.1000-3045.2019.11.014.
- Cui P, Jia Y. 2015. Mountain hazards in the Tibetan Plateau: research status and prospects. Nat Sci Rev. 2(4):397–399. doi: 10.1093/nsr/nwv061.
- Cui P, Jia Y, Su F, et al. 2017. Natural hazards in Tibetan Plateau and key issue for feature research. Bull Chinese Acad Sci. (Chinese Version) 32(9):985–992. doi: 10.16418/j.issn.1000-3045.2017.09.008.
- Dai L, Fan X, Wang X, Fang C, Zou C, Tang X, Wei Z, Xia M, Wang D, Xu Q, et al. 2023. Coseismic landslides triggered by the 2022 Luding Ms6.8 earthquake, China. Landslides. 20(6):1277–1292. doi: 10.1007/s10346-023-02061-3.
- Dal Zilio L, Ampuero JP. 2023. Earthquake doublet in Turkey and Syria. Commun Earth Environ. 4(1):71. doi: 10.1038/s43247-023-00747-z.
- De Angeli S, Malamud BD, Rossi L, Taylor FE, Trasforini E, Rudari R. 2022. A multi-hazard framework for spatial–temporal impact analysis. Int J Disaster Risk Reduct. 73:102829. doi: 10.1016/j.ijdrr.2022.102829.
- De Moel HD, Van Alphen J, Aerts JCJH. 2009. Flood maps in Europe – methods, availability and use. Nat Hazards Earth Syst Sci. 9(2):289–301. doi: 10.5194/nhess-9-289-2009.
- de Ruiter MC, de Bruijn JA, Englhardt J, Daniell JE, de Moel H, Ward PJ. 2021. The asynergies of structural disaster risk reduction measures: comparing floods and earthquakes. Earth’s Fut. 9(1):e2020EF001531. doi: 10.1029/2020EF001531.
- Deng QD, Cheng SP, Ma J, et al. 2014. Seismic activities and earthquake potential in the Tibetan Plateau. Chin J Geophys. 57(5):678–697. doi: 10.1002/cjg2.20133.
- Fielding E, Isacks B, Barazangi M, Duncan C. 1994. How flat is Tibet? Geology. 22(2):163–167. 10.1130/0091-7613(1994)022<0163:HFIT>2.3.CO;2
- Gill JC, Malamud BD. 2016. Hazard interactions and interaction networks (cascades) within multi-hazard methodologies. Earth Syst Dyn. 7(3):659–679. doi: 10.5194/esd-7-659-2016.
- Gomez C. 2024. The January 1st 2024 Noto Peninsula co-seismic landslides hazards: preliminary results. 31 January 2024, PREPRINT (Version 1) available at Research Square. doi: 10.21203/rs.3.rs-3904468/v1.
- Görüm T, Tanyas H, Karabacak F, Yılmaz A, Girgin S, Allstadt KE, Süzen ML, Burgi P. 2023. Preliminary documentation of coseismic ground failure triggered by the February 6, 2023 Türkiye earthquake sequence. Eng Geol. 327:107315. doi: 10.1016/j.enggeo.2023.107315.
- Hartmann J, Moosdorf N. 2012. The new global lithological map database GLiM: a representation of rock properties at the Earth surface. Geochem Geophys Geosyst. 13:Q12004. doi: 10.1029/2012GC004370.
- He X. 2019. A study on direct loss assessment method of earthquake disaster [MSc thesis]. Beijing: Normal University.
- Heidarzadeh M, Ishibe T, Gusman AR, Miyazaki H. 2024. Field surveys of tsunami runup and damage following the January 2024 Mw 7.5 Noto (Japan sea) Tsunamigenic earthquake. Ocean Eng. 307:118140. doi: 10.1016/j.oceaneng.2024.118140.
- Inter-Agency Standing Committee and the European Commission. 2020. INFORM report 2020: shared evidence for managing crises and disasters. Luxembourg: EUR 30173 EN Publications Office of the European Union. doi: 10.2760/953633.
- Işık E, Avcil F, Büyüksaraç A, İzol R, Hakan Arslan M, Aksoylu C, Harirchian E, Eyisüren O, Arkan E, Şakir Güngür M, et al. 2023. Structural damages in masonry buildings in Adıyaman during the Kahramanmaraş (Turkiye) earthquakes (Mw 7.7 and Mw 7.6) on 06 February 2023. Eng Fail Anal. 151:107405. doi: 10.1016/j.engfailanal.2023.107405.
- Ishikawa P. 2024. Regarding the status of damage caused by the 2024 Noto Peninsula earthquake (Crisis Management Office), PDF file in Japanese. Crisis Management Office. Ishikawa Prefecture, 7 February 2024. https://www.pref.ishikawa.lg.jp/saigai/documents/higaihou_82_0207_1400.pdf. (Accessed 30 May 2024).
- Karakas G, Kocaman S, Gokceoglu C. 2023. A hybrid multi-hazard susceptibility assessment model for a basin in Elazig Province, Türkiye. Int J Disaster Risk Sci. 14(2):326–341. doi: 10.1007/s13753-023-00477-y.
- Karatzetzou A, Stefanidis S, Stefanidou S, Tsinidis G, Pitilakis D. 2022. Unified hazard models for risk assessment of transportation networks in a multi-hazard environment. Int J Disaster Risk Reduct. 75:102960. doi: 10.1016/j.ijdrr.2022.102960.
- Kang H, Kim Y. 2016. The physical vulnerability of different types of building structure to debris flow events. Nat Hazards. 80(3):1475–1493. doi: 10.1007/s11069-015-2032-z.
- Kargel JS, Leonard GJ, Shugar DH, Haritashya UK, Bevington A, Fielding EJ, Fujita K, Geertsema M, Miles ES, Steiner J, et al. 2016. Geomorphic and geologic controls of geohazards induced by Nepal’s 2015 Gorkha earthquake. Science. 351(6269):aac8353. doi: 10.1126/science.aac8353.
- Kuang X, Jiao JJ. 2016. Review on climate change on the Tibetan Plateau during the last half century. JGR Atmos. 121(8):3979–4007. doi: 10.1002/2015JD024728.
- Lee R, White CJ, Adnan MSG, Douglas J, Mahecha MD, O'Loughlin FE, Patelli E, Ramos AM, Roberts MJ, Martius O, et al. 2024. Reclassifying historical disasters: from single to multi-hazards. Sci Tot Environ. 912:169120. doi: 10.1016/j.scitotenv.2023.169120.
- Li N, Zhang ZT, Chen X, et al. 2017. Importance of economic loss evaluation in natural hazard and disaster research. Prog Geogr. 36(02):256–263. doi: 10.18306/dlkxjz.2017.02.011.
- Li HB, Pan JW, Sun ZM, et al. 2021. Continental tectonic deformation and seismic activity: a case study from the Tibetan Plateau. Acta Geol Sin. 95:194. doi: 10.19762/j.cnki.dizhixuebao.2021051.
- Liu F, Li J, Yang S. 2015. Landslide erosion associated with the Wenchuan earthquake in the Minjiang River watershed: implication for landscape evolution of the Longmen Shan, Eastern Tibetan Plateau. Nat Hazards. 76(3):1911–1926. doi: 10.1007/s11069-014-1575-8.
- Liu B, Han X, Qin L, Xu W, Fan J. 2021. Multi-hazard risk mapping for coupling of natural and technological hazards. Geomat Nat Hazards Risk. 12(1):2544–2560. doi: 10.1080/19475705.2021.1969451.
- Liu‐Zeng J, Tapponnier P, Gaudemer Y, Ding L. 2008. Quantifying landscape differences across the Tibetan plateau: implications for topographic relief evolution. J Geophys Res. 113(F4):F04018. doi: 10.1029/2007JF000897.
- López-Saavedra M, Martí J. 2023. Reviewing the multi-hazard concept. Application to volcanic islands. Earth Sci Rev. 236:104286. doi: 10.1016/j.earscirev.2022.104286.
- Luo HY, Zhang LM, Zhang LL, He J, Yin KS. 2023. Vulnerability of buildings to landslides: the state of the art and future needs. Earth Sci Rev. 238:104329. doi: 10.1016/j.earscirev.2023.104329.
- Mao K. 2021. SMC dataset: soil moisture in China dataset. Beijing, China: National Tibetan Plateau Data Center; p. 2002–2018. doi: 10.5281/zenodo.4738556.
- Nachappa T, Ghorbanzadeh O, Gholamnia K, Blaschke T. 2020. Multi-hazard exposure mapping using machine learning for the State of Salzburg, Austria. Remote Sens. 12(17):2757. doi: 10.3390/rs12172757.
- Nadim F, Kjekstad O, Peduzzi P, Herold C, Jaedicke C. 2006. Global landslide and avalanche hotspots. Landslides. 3(2):159–173. doi: 10.1007/s10346-006-0036-1.
- Ozkula G, Dowell RK, Baser T, Lin J-L, Numanoglu OA, Ilhan O, Olgun CG, Huang C-W, Uludag TD. 2023. Field reconnaissance and observations from the February 6, 2023, Turkey earthquake sequence. Nat Hazards. 119(1):663–700. doi: 10.1007/s11069-023-06143-2.
- Peng M, Wang X, Zhang G, Veh G, Sattar A, Chen W, Allen S. 2023. Cascading hazards from two recent glacial lake outburst floods in the Nyainqêntanglha range, Tibetan Plateau. J Hydrol. 626:130155. doi: 10.1016/j.jhydrol.2023.130155.
- Qi S, Xu Q, Lan H, Zhang B, Liu J. 2010. Spatial distribution analysis of landslides triggered by 2008.5. 12 Wenchuan Earthquake, China. Eng Geol. 116(1–2):95–108. doi: 10.1016/j.enggeo.2010.07.011.
- Ran Y, Cheng G, Dong Y, Hjort J, Lovecraft AL, Kang S, Tan M, Li X. 2022. Permafrost degradation increases risk and large future costs of infrastructure on the third pole. Commun Earth Environ. 3(1):238. doi: 10.1038/s43247-022-00568-6.
- Rusk J, Maharjan A, Tiwari P, Chen T-HK, Shneiderman S, Turin M, Seto KC. 2022. Multi-hazard susceptibility and exposure assessment of the Hindu Kush Himalaya. Sci Tot Environ. 804:150039. doi: 10.1016/j.scitotenv.2021.150039.
- Shao X, Xu C, Ma S. 2022. Preliminary analysis of coseismic landslides induced by the 1 June 2022 Ms 6.1 Lushan earthquake, China. Sustainability. 14(24):16554. doi: 10.3390/su142416554.
- Shugar DH, Jacquemart M, Shean D, Bhushan S, Upadhyay K, Sattar A, Schwanghart W, McBride S, de Vries MVW, Mergili M, et al. 2021. A massive rock and ice avalanche caused the 2021 disaster at Chamoli, Indian Himalaya. Science. 373(6552):300–306. doi: 10.1126/science.abh4455.
- Tilloy A, Malamud BD, Winter H, Joly-Laugel A. 2019. A review of quantification methodologies for multi-hazard interrelationships. Earth Sci Rev. 196:102881. doi: 10.1016/j.earscirev.2019.102881.
- UNEP. 1992. Agenda 21. Technical Report, United Nations division for sustainable development, Rio de Janeiro, South Africa. https://www.un.org/esa/dsd/agenda21/res_agenda21_00.shtml.
- UNISDR. 2015. Global assessment report on disaster risk reduction 2015: making development sustainable: the future of disaster risk management. Geneva, Switzerland: United Nations International Strategy for Disaster Reduction.
- UNISDR. 2013. Global assessment report on disaster risk reduction 2013: from shared risk to shared value: the business case for disaster risk reduction. Geneva, Switzerland: United Nations International Strategy for Disaster Reduction.
- Wang X, Clague JJ, Crosta GB, Sun J, Stead D, Qi S, Zhang L. 2021. Relationship between the spatial distribution of landslides and rock mass strength, and implications for the driving mechanism of landslides in tectonically active mountain ranges. Eng Geol. 292:106281. doi: 10.1016/j.enggeo.2021.106281.
- Wei L, Hu K, Hu X, Wu C, Zhang X. 2022. Quantitative multi-hazard risk assessment to buildings in the Jiuzhaigou valley, a world natural heritage site in Western China. Geomat Nat Hazards Risk. 13(1):193–221. doi: 10.1007/10.1080/19475705.2021.2004244.
- Whitman RV, Anagnos T, Kircher CA, Lagorio HJ, Lawson RS, Schneider P. 1997. Development of a national earthquake loss estimation methodology. Earthq Spectra. 13(4):643–661. doi: 10.1193/1.1585973.
- Wu J, He X, Li Y, Shi P, Ye T, Li N. 2019. How earthquake-induced direct economic losses change with earthquake magnitude, asset value, residential building structural type and physical environment: an elasticity perspective. J Environ Manage. 231:321–328. doi: 10.1016/j.jenvman.2018.10.050.
- Wu J, Li Y, Li N, Shi P. 2018. Development of an asset value map for disaster risk assessment in China by spatial disaggregation using ancillary remote sensing data. Risk Anal. 38(1):17–30. doi: 10.1111/risa.12806.
- Wu J, Wang C, He X, Wang X, Li N. 2017. Spatiotemporal changes in both asset value and GDP associated with seismic exposure in China in the context of rapid economic growth from 1990 to 2010. Environ Res Lett. 12(3):034002. doi: 10.1088/1748-9326/aa5d47.
- Wu J, Li N, Shi P. 2014. Benchmark wealth capital stock estimations across China’s 344 prefectures: 1978 to 2012. China Econ Rev. 31:288–302. doi: 10.1016/j.chieco.2014.10.008.
- Wu J, Gao XJ. 2013. A gridded daily observation dataset over China region and comparison with the other datasets. Chin J Geophys. 56(4):1102–1111. doi: 10.6038/g20130406.
- Xu XW, Li F, Cheng J, et al. 2023. Advances in research on active faults and exploration of relevant frontier scientific problems. Coal Geol Explor. 51(12):1–16. doi: 10.12363/issn.1001-1986.23.12.0805.
- Yamin LE, Hurtado A, Rincon R, Dorado JF, Reyes JC. 2017. Probabilistic seismic vulnerability assessment of buildings in terms of economic losses. Eng Struct. 138:308–323. doi: 10.1016/j.engstruct.2017.02.013.
- Yanar T, Kocaman S, Gokceoglu C. 2020. Use of Mamdani fuzzy algorithm for multi-hazard susceptibility assessment in a developing urban settlement (Mamak, Ankara, Turkey). IJGI. 9(2):114. doi: 10.3390/ijgi9020114.
- Yang J, Wang J, Hu Y, Li B, Zhao J, Liang Z. 2023. Flood risk mapping for the area with mixed floods and human impact: a case study of Yarkant River Basin in Xinjiang, China. Environ Res Commun. 5(9):095005. doi: 10.1088/2515-7620/acf0a2.
- Yao T, Thompson LG, Mosbrugger V, Zhang F, Ma Y, Luo T, Xu B, Yang X, Joswiak DR, Wang W, et al. 2021. Third pole environment (TPE). Environ Dev. 3:52–64. doi: 10.1016/j.envdev.2012.04.002.
- Ya R, Wu J, Tang R, Zhou Q. 2023. Increased flood susceptibility in the Tibetan Plateau with climate and land use changes. Ecol Indic. 156:111086. doi: 10.1016/j.ecolind.2023.111086.
- Yin C, Zhu AL, Zhou Q, Meng F, Chen R, Liu F, Chen Q, Guo X. 2024. Rapid urban expansion and potential disaster risk on the Qinghai–Tibetan Plateau in the 21st century. Landsc Ecol. 39(2):1–23. doi: 10.1007/s10980-024-01825-z.
- You Q, Cai Z, Pepin N, Chen D, Ahrens B, Jiang Z, Wu F, Kang S, Zhang R, Wu T, et al. 2021. Warming amplification over the Arctic Pole and Third Pole: trends, mechanisms and consequences. Earth Sci Rev. 217:103625. doi: 10.1016/j.earscirev.2021.103625.
- Zhao B, Su L, Xu Q, Li W, Xu C, Wang Y. 2023a. A review of recent earthquake-induced landslides on the Tibetan plateau. Earth Sci Rev. 244:104534. doi: 10.1016/j.earscirev.2023.104534.
- Zhao B, Su L, Wang Y, Li W, Wang L. 2023b. Insights into some large-scale landslides in southeastern margin of Qinghai–Tibet Plateau. J Rock Mech Geotech Eng. 15(8):1960–1985. doi: 10.1016/j.jrmge.2022.09.005.
- Zhao B, Wang Y, Li W, Su L, Lu J, Zeng L, Li X. 2021. Insights into the geohazards triggered by the 2017 Ms 6.9 Nyingchi earthquake in the east Himalayan syntaxis, China. Catena. 205:105467. doi: 10.1016/j.catena.2021.105467.
- Zhang PZ, Deng QD, Zhang GM, et al. 2003. Strong earthquake activity and active blocks in Chinese mainland. Sci China. 33(S1):12–20.
- Zhu L, He S, Qin H, He W, Zhang H, Zhang Y, Jian J, Li J, Su P. 2021. Analyzing the multi-hazard chain induced by a debris flow in Xiaojinchuan River, Sichuan, China. Eng Geol. 293:106280. doi: 10.1016/j.enggeo.2021.106280.
- Zou Q, Jiang L, You Y, et al. 2020. Information management system for mountain hazards along Sichuan–Tibet Railway. J Yangtze River Sci Res Inst. 37(10):177. doi: 10.11988/ckyyb.2019158382.