
 ?Mathematical formulae have been encoded as MathML and are displayed in this HTML version using MathJax in order to improve their display. Uncheck the box to turn MathJax off. This feature requires Javascript. Click on a formula to zoom.
Abstract
The COVID-19 lockdown in early 2020 and subsequent lifting in late 2022 had a significant impact on air pollution levels in the Yangtze River Delta (YRD). Previous studies have not provided a clear understanding of the detailed spatiotemporal characteristics of PM2.5 concentrations in various functional areas of cities during different periods before and after the outbreak of the epidemic. However, by employing a deep neural network (DNN) model and integrating satellite data, meteorological reanalysis, and PM2.5 observations, established an estimation of high-resolution PM2.5 distribution during the period from 2019 to 2022. The DNN model performed well (R2 = 0.78). During the lockdown, PM2.5 concentrations in 14 YRD cities were over 50% lower than in previous years. Interestingly, even after the lockdown was lifted, PM2.5 levels remained relatively low due to reduced human activities caused by widespread infections. Found that PM2.5 reductions varied across different intra-city functional regions during both the lockdown and lift lockdown periods. Overall, the changes in PM2.5 levels during the 2022 lift lockdown were smaller than during the 2020 lockdown. These findings emphasize the need for tailored government policies to address COVID-19's impact on air pollution, considering diverse functional areas within the region.
1. Introduction
In recent decades, with the rapid economic growth and industrial development in China, air pollution has become a serious threat to public health. Atmospheric particulate matter smaller than 2.5 μm (PM2.5), has serious impacts on human health (Xie et al. Citation2011; Lim et al. Citation2012; Betha et al. Citation2014; Ma et al. Citation2016). PM2.5 is characterized by diverse sources, long transmission distances, and secondary particles which can form via complex chemical reactions (Ma et al. Citation2016; Tang et al. Citation2021). The Chinese government has set up a network of ground-based air quality monitoring sites nationwide since 2013, including PM2.5 measurements, but the limited regional representation and sparse distribution hinder detailed intra-city analysis. On the other hand, satellite remote sensing, offering broad geographical coverage, is crucial for monitoring remote or inaccessible areas, but has limitations to estimate surface concentrations at a high temporal resolution using polar satellites and with a certain level of uncertainty (Petitjean et al. Citation2014).
Surface air quality dataset with a high resolution can better reflect the spatial and temporal distribution of air pollution with more details, which can provide an in-depth understanding of surface air pollution conditions and provide more refined data support for further air pollution monitoring and management (Di et al. Citation2016; Wei et al. Citation2021). The current methods for estimating surface PM2.5 concentrations include statistical models (Hu et al. Citation2013; You et al. Citation2015; Ma and Jia Citation2016; Zhang et al. Citation2018), machine learning models (Zhang et al. Citation2018; Li et al. Citation2019; Chen et al. Citation2021; Carreño et al. Citation2022) and atmospheric chemical transport models (Zhang et al. Citation2013; Tao et al. Citation2014). The statistical models are not good enough for nonlinear relationships, sensitive to outliers, limited to specific regions and seasons, and the accuracy is low. Atmospheric chemical transport models have limitations because they are computationally intensive and depend heavily on the accuracy of pollutant emission inventories and meteorological conditions provided by other sources. In contrast, machine learning is a rising technology that can rapidly learn the relationship between PM2.5 and different factors, allowing for forecasting and discovering unknown mechanisms. Some studies have showed the advantages of machine learning algorithms such as the random forest (RF) model, extreme gradient boosting (XGBoost) model, and support vector regression (SVR) model in predicting PM2.5 concentrations (Shtein et al. Citation2019; Chen et al. Citation2021; Su et al. Citation2022). These studies highlight machine learning’s superior adaptability and nonlinear fitting compared to traditional regression models. Yet, as data volume and predictor complexity grow, deep learning has become a more prominent tool to accurately predict PM2.5 concentrations. The key distinction between deep learning and machine learning lies in deep learning’s performance enhancement with increasing data size, making it particularly suited for big data analysis. Deep learning methods excel in solving complex nonlinear problems, handling large datasets, and delivering highly accurate results. They also offer advantages such as fast prediction and high regression capability, ensuring the model’s accuracy and robustness in predicting input data or estimating output values . Factors commonly used for PM2.5 deep learning include meteorological conditions, other pollutant concentrations, land use types, pollutant emissions, and satellite remote sensing information (Li et al. Citation2017; Chen et al. Citation2021a). For example, Fan et al. and Lee et al. predicted PM2.5 concentrations using a DNN model and showed that the model performed better than traditional machine learning models and linear regression models (Fan et al. Citation2020; Lee et al. Citation2021). Chen et al. combined a convolutional neural network (CNN) with a long short-term memory (LSTM) model to estimate PM2.5 concentrations and the results confirmed the advantages of the hybrid model (Chen et al. Citation2013). Among various input data, satellites-based observations usually play a more important role by being able to provide not only large-scale spatial and temporal observation data, but also multi-spectral observation data (Fujii et al. Citation2001; Mahowald Citation2011; Chen et al. Citation2013; Renhe et al. Citation2014; Shen et al. Citation2018). High-resolution and high-accuracy PM2.5 data can provide a more comprehensive and detailed explanation of pollution distribution, which is essential for an in-depth understanding of surface air pollution conditions and providing refined data support for further air pollution monitoring and management. We utilizes DNN models to achieve this high-resolution and high-accuracy data, demonstrating their effectiveness in capturing the spatial and temporal variations of PM2.5 concentrations. The deep learning models constructed by current studies have a relatively coarse spatial-temporal resolution (e.g. 10 km) and are mostly limited to small scales or ground-based observation sites locations, which are difficult to cover rural or topographically complex areas. Also, due to the complex influence of meteorological factors and regional vegetation on the formation and distribution of atmospheric pollutants (Wang et al. Citation2015; Sharma et al. Citation2016; Cui et al. Citation2018; Cui et al. Citation2019), higher spatiotemporal resolution data and models are required for in-depth analysis.
Since the outbreak of COVID-19, global human activities have been greatly affected (Azeez et al. Citation2021; Van Zyl and Celik Citation2021), and in turn, more and more scholars have studied the response of the natural environment to changes in human activities (Misra et al. Citation2021; Fyfe et al. Citation2021; Chang et al. Citation2022; Liu et al. Citation2022) and found that the reduction in human activities during the COVID-19 led to a reduction in most atmospheric pollutant concentrations. However, the current studies focused on the period when the outbreak first started, a few on the period after the lockdown was lifted (lift lockdown period), and a lack of in-depth analysis of how different functional areas of the city were influenced. The impacts of satellite remote sensing based deep learning methods on the spatial distribution characteristics of surface PM2.5 concentrations during lockdown and lift lockdown periods with high spatial and temporal resolutions are still limited.
Therefore, this study takes the Yangtze River Delta (YRD) region as the study area, and uses satellite remote sensing products, meteorological reanalysis, and PM2.5 ground observation data as model factors to establish a DNN model for PM2.5 concentration estimation. The estimated PM2.5 dataset is then used to analyze the effect of COVID-19 on the spatial and temporal distribution of PM2.5 concentrations during 2019–2022. The materials and methods are presented in Chapter 2. The results and discussions are presented in Chapter 3. Chapter 4 provides a conclusion.
2. Materials and methods
2.1. Study area
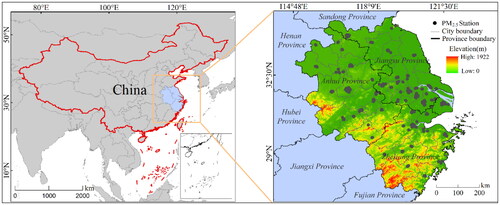
The YRD region (116.29-123.45°E, 27.14-35.33°N), located at the eastern coastal region of China, is composed of 26 cities including mega-cities such as Shanghai, Nanjing, Suzhou, etc. (). The region is highly developed, densely populated, and urbanized, and is currently facing increasing environmental challenges. These include substantial anthropogenic emissions, posing adverse impacts on residents’ health and overall environmental quality (Xue et al. Citation2017; Ma et al. Citation2021). After the COVID-19 outbreak in early 2020, the country quickly activated the level 1 response for major public health emergencies, with traffic control, school closures, factory shutdowns, and residential lockdowns. The lockdowns were fully lifted on Dec. 2022. The study period is then covered from 2019 to 2022. In this study, January 23-February 24th, 2020 was selected as the lockdown period, and December 2022 was selected as the lift lockdown period for the comparison of lockdown and lift lockdown effects on urban air quality.
Figure 1. Location of study area in China (left panel), terrain height (right panel, shaded, unit: m), and the distribution of PM2.5 ground monitoring sites (black dots).
2.2. Satellite data
Satellite-based observations are an important part of generating high resolution PM2.5 dataset. In this study, the remote sensing data used mainly consisted of the Normalized Difference Vegetation Index (NDVI) and Aerosol Optical Depth (AOD), which are highly correlated with PM2.5, with a spatial resolution of 1 km. The NDVI data were calculated from the Moderate-resolution Imaging Spectroradiometer (MODIS) daily surface reflectance data (MOD09GA) on board Terra and Aqua satellites and were de-clouded and de-watered based on quality assessment (QA) band (Xie and Wilson Citation2020). The AOD data were obtained from the MODIS 550 nm AOD dataset (MCD19A2, C6). The AOD algorithm is based on time series analysis and image-based processing for aerosol retrieval (Lyapustin et al. Citation2011; Lyapustin et al. Citation2012). Both satellite data for the study area were obtained from the MODIS data website (http://modis.gsfc.nasa.gov/).
2.3. PM2.5 observations
Hourly ground PM2.5 observations for the YRD region were obtained from the website of the China Environmental Monitoring Center (CEMC) (http://www.cnemc.cn/). Data from a total of 220 valid sites were obtained. The specific site distribution is shown in (black dots in the right panel). According to China’s ambient air quality standard (GB3095-2012), the PM2.5 mass concentrations from these stations are measured using a Tapered Element Oscillating Microbalance (TEOM) (Chen et al. 2018). Daily mean values were calculated based on the hourly observations.
2.4. Meteorological and other data
Meteorological and other related data for the study area were obtained from the ERA5 reanalysis dataset released by the European Centre for Medium-Range Weather Forecasts (ECMWF). ERA5 is the fifth-generation reanalysis dataset of ECMWF with a horizontal resolution of 0.25° × 0.25° by longitude and latitude and a temporal resolution of 1 h. The relative humidity (RH), boundary layer height (BLH), temperature at 2 m height above the ground level (AGL) (T2m), near-surface pressure (SP), eastward component wind speed at 10 m AGL (U10), northward component wind speed at 10 m AGL (V10), evapotranspiration, total column ozone (TCO3), high vegetation cover index (HCVI), and low vegetation cover index (LVCI) from the ERA5 reanalysis data were selected based on previous studies that considered the influence of meteorological factors on PM2.5(Shen et al. Citation2018; Chen et al. Citation2021a).
2.5. Data pre-processing
The factors from ERA5 reanalysis data were firstly interpolated to the MODIS km grid by the Normal Kriging interpolation method. Then the AOD, NDVI and ERA5 data were de-watered according to YRD water data. The AOD, NDVI, ERA5 data and PM2.5 ground station observations were checked for outliers and vacant values, and the outliers were removed. Finally, according to the time, latitude, and longitude of the PM2.5 ground station observation data, all daily average data from 2019 to 2022 are spatially and temporally matched to constitute the PM2.5 concentration inversion model dataset for training. The optimally trained model was then applied to the YRD region for PM2.5 estimation. The daily pixels of AOD, NDVI and ERA5 data were extracted according to the YRD, and the data set to be predicted was established. Finally, the established model was used to estimate the daily PM2.5 concentration.
In order to make each data in the same order of magnitude, all data were standardized in terms of magnitude. Standardization can avoid the negative impact of data on the model learning and make the model learn better. The standardization formula Equation(1)(1)
(1) is as follow:
(1)
(1)
where
is the standardized data,
is the original data,
is the mean of all sample data, and
is the standard deviation of all sample data. The study randomly selected 80% of the data for training and 20% for validation.
2.6. Deep neural networks
The input layer of the DNN model contains vectors composed of 12 elements such as NDVI, AOD and ERA5 meteorological reanalysis data. The input vector of each hidden layer is the output of all nodes in the previous layer. After activation function transformation, signals are transmitted layer by layer, and inversion results are obtained after passing through four hidden layers. The number of neurons in each hidden layer was 1000, 700, 400, and 100, respectively. The initial learning rate was set to 0.001, and during the training process, each iteration trained 15 rounds, the number of model training iterations was 180 rounds, and the output layer was the predicted distribution of PM2.5 concentration.
By synthesizing the previous research results, the accuracy standards of the model are clearly defined, such as root mean square error (RMSE), mean absolute error (MAE) and determination coefficient (R2). Then, use validation sets to evaluate the performance of the model. If find that its accuracy does not meet the pre-set standards (Chen et al. Citation2021b; Lee et al. Citation2021), continue to train by parameter adjustment until the optimal inversion model is determined. The model uses the Rectfier Linear Unit (ReLU) function as the activation function of the hidden layer neurons to prevent gradient disappearance. To prevent overfitting, a random deactivation algorithm (dropout) is added to the model, and the optimization algorithm for the adaptive learning rate is Adaptive moment estimation (Adam). The loss function used in the model is the mean square error function (MSE) with the following equation:
(2)
(2)
Where, n is the number of samples; is the estimated value of the model;
is the ground station observation.
In this research, utilized two quantitative metrics: the coefficient of determination (R², EquationEq. (3)(3)
(3) ) and root mean square error (RMSE, EquationEq. (4)
(4)
(4) ), for model evaluation.
Meanwhile, RMSE gauges the extent of dispersion between model estimates and ground station monitoring data. Smaller RMSE values indicate less error between model estimates and observed values, signifying higher accuracy.
(3)
(3)
(4)
(4)
where
is the observed value of the site,
is the mean value, and
is the estimated value of the model.
4. Results and discussion
4.1. Performance of the DNN model
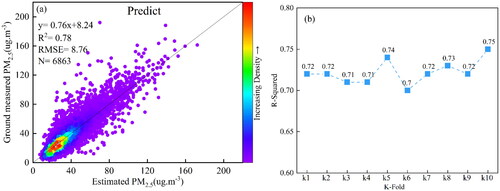
The daily PM2.5 concentration in the YRD during 2019–2022 was predicted by the DNN model. shows the evaluation of the predicted PM2.5 results for the model. The model performance was good, with a high R2 value of 0.78 and a low RMSE value of 8.76 μg/m3. However, the predicted PM2.5 levels were slightly lower than the observations. Despite this, the data points were evenly spread around the 1:1 line, indicating that the DNN model is suitable for estimating PM2.5 concentrations using ERA5 reanalysis and satellite data. In addition, we performed K-fold cross-validation of the DNN model, and in 10 validations, observed an R2 mean higher than 0.70, indicating that the model has good robustness (). Additional validation was conducted to assess the model stability of PM2.5 in the YRD under high (PM2.5 > 40 µg/m³) and low (PM2.5 ≤ 40 µg/m³) concentration conditions, as shown in Fig. S1. The results indicate that the model accuracy is higher under high PM2.5 conditions (R² = 0.63) compared to low PM2.5 conditions (R² = 0.45). The accuracy of the model in different seasons was further evaluated, as shown in Figure S2. The R2 between the estimated and the ground-measured PM2.5 concentrations in the four seasons were 0.76, 0.56, 0.81 and 0.89, respectively, indicating a good representative of the estimated PM2.5 concentration, especially during cold seasons. The relatively small R2 in summer could be attributed to the uncertainties existed in the meteorological datasets since the generation of summer meteorological factors such as rainfall, and cloud related processes based on numerical approaches is still of great challenge.
Figure 2. (a) Scatter plots of the predicted PM2.5 concentrations against observations, along with the values of R2, RMSE (µg m−3), and sample size (N), (b) Accuracy value for k-fold DNN classifiers (k = 1,2…,10).
4.2. General characteristics of PM2.5 over the YRD
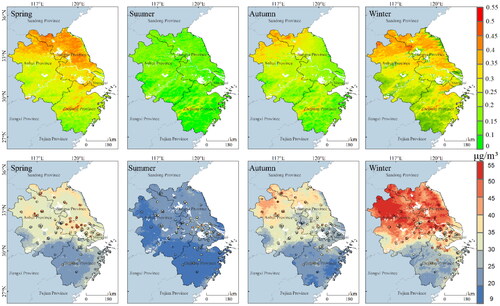
shows the seasonal spatial distribution of MODIS AOD products, the predicted PM2.5 concentrations, and the observed ground-level PM2.5 concentrations in the YRD region from 2019 to 2022. It can be clearly seen that the AOD levels in spring and winter are much larger than that in summer and autumn. The distribution map shows that the high value areas are located in the northern part of the YRD, and most of the low values are in the southern part of the YRD. As shown in the second row of , the spatial distribution of predicted PM2.5 concentrations showed a similar pattern to that of AOD, with concentrations significantly higher in winter than in other seasons. Furthermore, compared to ground-based observations, which are mostly located in urban areas, the predicted product shows obviously lower levels of PM2.5 concentrations in rural areas and northern coastal areas, especially in spring and summer. In contrast, large area of high levels of PM2.5 could be found in winter. Relatively high levels of PM2.5 concentrations over the southern coastal areas are also observed. These details give us the opportunity to further understand the underlying mechanisms of the formation, dispersion, and transportation of particle matters.
Figure 3. Seasonal spatial distributions of AOD from MODIS (first row), predicted PM2.5 concentrations (second row), and ground-based PM2.5 observations (solid circles, second row) in the YRD region from 2019 to 2022.
We found through Pearson correlation analysis that NDVI, BLH, wind speed, and T2m are significantly negatively correlated with PM2.5 concentrations, especially in summer and autumn, indicating that these factors help reduce PM2.5 levels. RH showed a positive correlation with PM2.5 in summer, likely due to high humidity promoting particle accumulation. Regions with weaker wind speed, and high anthropogenic emissions have higher PM2.5 levels, with spatial and seasonal variations influenced by temperature, BLH, and local topography. Figures S3, S4 and Table S1 provided a detailed analysis of the underlying mechanisms.
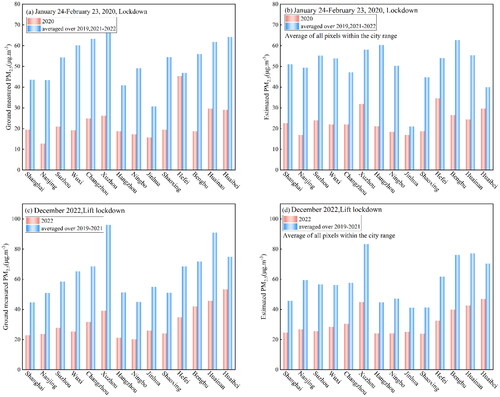
Figure 4. Variation of observed (a,c) and estimated (b,d) PM2.5 concentrations in 14 large cities in the YRD region during the lockdown period (a,b) and the lift lockdown period (c,d).
4.3. Variation characteristics of PM2.5 during the COVID-19
The Chinese government took a series of measures to cope with the outbreak of COVID-19 since the beginning of 2020. These measures have directly or indirectly influenced human activities and thus changed the air pollution level (since air pollution is mainly caused by human activities such as combustion, industrial production, transportation, etc. (Liu et al. Citation2022)). In order to study the effect of COVID-19 on PM2.5 concentration change, the PM2.5 concentration change characteristics of 14 economically and industrially developed large cities in the YRD region were analyzed. The lockdown period was from January 24 to February 23, 2020, and the lift lockdown period was December 2022, because the Chinese government decided to lift the lockdown measures nationwide on December 7th, 2022, and nucleic acid testing was no longer mandatory in any setting or area.
shows the comparison between the averaged observed PM2.5 concentrations in 14 large cities during the lockdown period of January 24–February 23, 2020 and the average concentrations of the same period of 2019, 2021, and 2022. It can be seen that PM2.5 concentrations changed significantly during the lockdown period. During the lockdown period, PM2.5 concentrations reduced sharply in all cities (except Hefei), with an average reduction of 56.94%, the largest reduction was found in Nanjing (70.72%). In the case of the estimated results (, average of all pixels within the city), all cities on average reduced by 53.11%, with the largest reduction in Nanjing (65.70%). The estimated values are generally consistent with the ground observations.
shows the observed PM2.5 concentrations in 14 large cities during the December 2022 lift lockdown period compared to the average concentrations for the same period in 2019–2021. It can be seen that the PM2.5 concentrations reduced substantially in each city, with an average reduction of 50.96%, the largest reduction was found in Wuxi (61.06%). As for the estimated results (, average of all pixels within the city), the concentration reduced by 46.32% in average, with the largest reduction of 55.16% in Nanjing. After the lifting of the seal, there was a spike in COVID-19 across the country, especially in large, densely populated cities. It has also led to a renewed focus on preventative measures, with many choosing to stay at home to avoid exposure. As a result, human activities, such as commuting, industry, and other outdoor activities, are greatly reduced. The decrease in human activities has had a direct impact on air pollution levels, leading to a significant reduction in PM2.5 concentrations in December 2022. It also highlights the complex interplay between public health events and air pollution.
In addition to this, selected Suzhou city, one of the most industrially developed areas in the YRD region with an annual gross domestic product exceeding 340 billion dollars in 2022, to study the changes of AOD and PM2.5 concentrations in urban areas, industrial areas, and sub-urban areas during the lockdown and lift lockdown periods.
shows the MODIS AOD in urban areas, industrial areas, and sub-urban areas (defined as regions in different circles in ) during the lockdown and lift lockdown period along with the average values of the same period in other years. The statistics were calculated from the average of all grids within each area. From and , it is evident that during the 2020 lockdown, the AOD witnessed a notable reduction by 47.6%, 46.0% and 49.5% in urban, industrial, and suburban areas, respectively, compared to the average of the corresponding period. Although much of the data during the corresponding month in 2022 was affected by cloud cover, leading to the removal of cloud-contaminated pixels, an overarching observation indicates that the AOD levels were generally higher than those observed in other years. During the lift lockdown in 2022 (), the AOD decreased by 18.5%, 17.5%, and 20.5% in urban, industrial, and suburban areas, respectively, as compared to the average of the same period. It is worth noting that, the AOD during the lift lockdown period in 2022 was still lower than the those in other years indicating that human activities during this period may not be fully recovered.
Figure 5. Comparison of AOD values in suzhou during the lockdown period (a–d) and the lift lockdown period (e–h). The red circles indicate urban areas, the blue circle indicates the industrial area and the purple circles indicate Sub-urban areas.
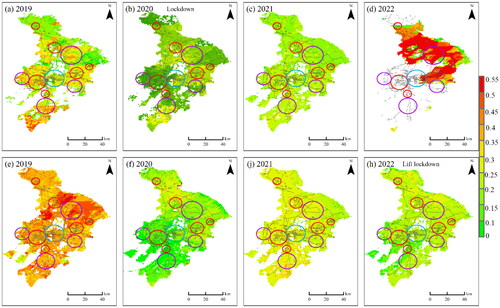
Table 1. Changes in intra-city AOD concentrations in Suzhou during the lockdown and lift lockdown periods.
Also plotted and calculated the PM2.5 concentration changes using the predicted and observed values as shown in . The present data can well reflect the distribution characteristics and response relationship of PM2.5 at the urban scale due to its high spatial resolution. Observations showed a 54%–63% reduction in PM2.5 concentrations in different areas compared to the average, while the estimated results were 48%–62% indicating a good representativeness of the model. From and , during the lockdown period in 2020, the observed and estimated PM2.5 concentrations in urban areas were 62.6% and 58.2% lower than the average of the same period, respectively, and that in industrial areas were 55.7% and 61.7% lower, respectively. These values are even higher than that of the AODs, implying that the COVID-19 pandemic did much stronger impacts on the near-surface PM2.5 concentrations than the total column abundance of PM2.5. The estimated results show a 57.1% reduction in the sub-urban areas (no observational sites located in the sub-urban areas), which is slightly smaller than that in urban and industrial areas. Also find that the differences between ground observations and estimates are greater in industrial areas than in urban areas, which could be the results of the uneven distributed ground observation stations (there is only one ground observation station in industrial areas). In terms of the lift lockdown period in 2022 (), the observed and estimated PM2.5 concentrations in urban areas respectively dropped by 54.0% and 54.3% compared to the average of the same period from 2019 to 2021, and that in industrial areas were 54.2% and 48.2% lower, respectively. In the case of the sub-urban area, PM2.5 concentration was 51.6% lower than the average of 2019–2021. The decreasing rates during the lift lockdown period are comparable to those during the lockdown period, indicating the human activities during the lift lockdown period are similar to that during the lockdown period. To confirm this hypothesis, further analyzed the total industrial output value in Suzhou (excluding the high tech manufacturing industry due to the missing data before 2021). It was found that the total output value during the lockdown period in 2020 was 329.9 billion, which was 203.0 billion less than the average of 532.9 billion in the same period in other years, indicating that the epidemic had a significant impact on industrial activities in 2020. The total industrial output value during the lift lockdown period in 2022 was 372.1 billion, which was 4.9 billion less than the average of 377.0 billion during the same period in 2021 (data source Wind: https://www.wind.com.cn/). This shows that after the lifting of lockdown measures, despite the recovery of industrial production, the concentration of PM2.5 is still significantly decreased. This suggests that it is caused by other human activities, not just industrial output. These activities may include reducing vehicle traffic, reducing the use of public transport, etc. This detailed observation highlights the multifaceted impact of COVID-19 on economic activity and the state of the environment in 2019. Therefore, in the event of similar public health emergencies, more detailed decisions should be made, such as taking corresponding measures according to the characteristics of different functional areas in each city. Instead, the spatio-temporal characteristics of air pollution can be analyzed to predict the risks that each functional area may face, allowing rapid development of response measures.
Figure 6. Same as but for predicted (shaded) and observed (dotted) PM2.5 concentrations.
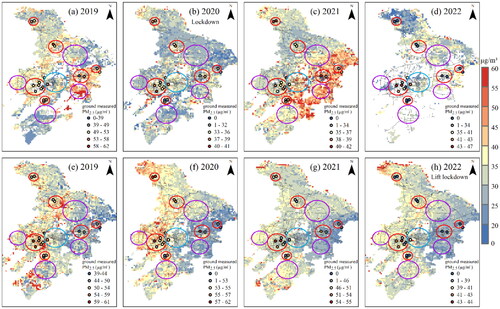
Table 2. Changes in intra-city PM2.5 concentrations in Suzhou during the lockdown and lift lockdown periods.
5. Conclusion
This study built a DNN model to construct a high-resolution (1 km × 1 km) daily PM2.5 concentration dataset for the YRD region from 2019 to 2022. The DNN model was trained on ERA5 meteorological data, ground-observed PM2.5 concentrations, and satellite data including MCD09GA NDVI, and MCD19A2 AOD products, In December 2022, the Chinese government announced the lifting of the national lockdown measures, leading to massive infection and reduced social activities again. Detailed analysis was carried out during both the lock down and lift lock down periods using multiple datasets including satellite-, ground-based observations, economic data, and deep learning generated data. The main conclusions of this paper are as follows:
The DNN model is suitable for estimating surface PM2.5 concentration and has good stability and accuracy, with R2 and RMSE of 0.78 and 8.76 μg/m3, respectively.
PM2.5 concentrations in 14 large cities in the YRD region show significantly reduced PM2.5 concentrations (both observed and estimated results showed an average reduction exceeding 50%) during the lockdown in 2020 and during the lift lockdown period in 2022 compared to the same period in other years.
The reductions in PM2.5 concentrations during both lockdown and lift lockdown periods were larger in urban areas than those in industrial areas, implied by the example of Suzhou (one of the most industrial developed cities in the YRD). Inconsistence was observed between observations and estimated results due to the uneven distribution of observational sites.
Lockdown measures in early 2020 reduced human activities and changed PM2.5 emissions. In December 2022, lockdown measures were lifted, but COVID-19 infections peaked and people were forced to quarantine at home, affecting normal activities. The full lift of lockdown had some impact on PM2.5 emissions, but it was lower than the initial lockdown period. When similar public health emergencies occur, measures shall be formulated according to the different functional areas of each city.
Supporting Information20240702.docx
Download MS Word (8.8 MB)Acknowledgements
The authors would like to thank the team that helped with the data integration to present this study.
Data availability statement
The datasets are not publicly available due to data privacy but are available from the corresponding author on reasonable request.
Disclosure statement
No potential conflict of interest was reported by the authors.
Additional information
Funding
References
- Azeez EPA, Negi DP, Rani A, A P SK. 2021. The impact of COVID-19 on migrant women workers in India. Eurasian Geogr Econ. 62(1):93–112. doi: 10.1080/15387216.2020.1843513.
- Betha R, Behera SN, Balasubramanian R. 2014. 2013 Southeast Asian smoke haze: fractionation of particulate-bound elements and associated health risk. J Environ Sci Technol. 48(8):4327–4335. doi: 10.1021/es405533d.
- Carreño G, López CXA, Marchant CJM. 2022. Machine learning models to predict critical episodes of environmental pollution for PM2.5 and PM10 in Talca, Chile. J Atmos Chem. 10(3):373.
- Chang Y, Du T, Song X, Wang W, Tian P, Guan X, Zhang N, Wang M, Guo Y, Shi J, et al. 2022. Changes in physical and chemical properties of urban atmospheric aerosols and ozone during the COVID-19 lockdown in a semi-arid region. J Atmos Environ. 287:119270. doi: 10.1016/j.atmosenv.2022.119270.
- Chen B, You S, Ye Y, Fu Y, Ye Z, Deng J, Wang K, Hong Y. 2021a. An interpretable self-adaptive deep neural network for estimating daily spatially-continuous PM2.5 concentrations across China. Sci Total Environ. 768:144724. doi: 10.1016/j.scitotenv.2020.144724.
- Chen X, Kong P, Jiang P, Wu Y. 2021b. Estimation of PM2.5 concentration using deep Bayesian model considering spatial multiscale. Remote Sens. 13(22):4545. doi: 10.3390/rs13224545.
- Chen Y, Ebenstein A, Greenstone M, Li H. 2013. Evidence on the impact of sustained exposure to air pollution on life expectancy from China’s Huai River policy. Proc Natl Acad Sci USA. 110(32):12936–12941. doi: 10.1073/pnas.1300018110.
- Cui L, Wang L, Singh RP, Lai Z, Jiang L, Yao R. 2018. Association analysis between spatiotemporal variation of vegetation greenness and precipitation/temperature in the Yangtze River Basin (China). Environ Sci Pollut Res Int. 25(22):21867–21878. doi: 10.1007/s11356-018-2340-4.
- Cui L, Wang L, Qu S, Singh RP, Lai Z, Yao R. 2019. Spatiotemporal extremes of temperature and precipitation during 1960–2015 in the Yangtze River Basin (China) and impacts on vegetation dynamics. Theor Appl Climatol. 136(1-2):675–692. doi: 10.1007/s00704-018-2519-0.
- Di Q, Kloog I, Koutrakis P, Lyapustin A, Wang Y, Schwartz J. 2016. Assessing PM2.5 exposures with high spatiotemporal resolution across the continental United States. Environ Sci Technol. 50(9):4712–4721. doi: 10.1021/acs.est.5b06121.
- Fan W, Qin K, Cui Y, Li D, Bilal M. 2020. Estimation of hourly ground-level PM2.5 concentration based on Himawari-8 apparent reflectance. IEEE Trans Geosci Remote Sens. 59(1):1–10. doi: 10.1109/TGRS.2020.2990791.
- Fujii T, Hayashi S, Hogg JC, Vincent R, Van Eeden SF. 2001. Particulate matter induces cytokine expression in human bronchial epithelial cells. Am J Respir Cell Mol Biol. 25(3):265–271. doi: 10.1165/ajrcmb.25.3.4445.
- Fyfe JC, Kharin VV, Swart N, Flato GM, Sigmond M, Gillett NP. 2021. Quantifying the influence of short-term emission reductions on climate. Sci Adv. 7(10):eabf7133. doi: 10.1126/sciadv.abf7133.
- Li Y, Xue Y, Guang J, She L, Chen G, Fan C. 2019. Hourly ground level PM 2.5 estimation for the Southeast of China based on Himawari-8 observation data. In IGARSS 2019-2019 IEEE International Geoscience and Remote Sensing Symposium. IEEE. p. 7850–7853.
- Hu X, Waller LA, Al-Hamdan MZ, Crosson WL, Estes MG, Estes SM, Quattrochi DA, Sarnat JA, Liu Y. 2013. Estimating ground-level PM2.5 concentrations in the southeastern US using geographically weighted regression. Environ Res. 121:1–10. doi: 10.1016/j.envres.2012.11.003.
- Lee C, Lee K, Kim S, Yu J, Jeong S, Yeom J. 2021. Hourly ground-level PM2.5 estimation using geostationary satellite and reanalysis data via deep learning. Remote Sensing. 13(11):2121. doi: 10.3390/rs13112121.
- Li T, Shen H, Yuan Q, Zhang X, Zhang L. 2017. Estimating ground-level PM2.5 by fusing satellite and station observations: a geo-intelligent deep learning approach. Geophys Res Lett. 44(23):11,985–11,993. doi: 10.1002/2017GL075710.
- Lim SS, Vos T, Flaxman AD, Danaei G, Shibuya K, Adair-Rohani H, Amann M, Anderson HR, Andrews KG, Aryee M, et al. 2012. A comparative risk assessment of burden of disease and injury attributable to 67 risk factors and risk factor clusters in 21 regions, 1990–2010: a systematic analysis for the Global Burden of Disease Study 2010. Lancet. 380(9859):2224–2260. doi: 10.1016/S0140-6736(12)61766-8.
- Liu W, Mao Y, Hu T, Shi M, Zhang J, Zhang Y, Kong S, Qi S, Xing X. 2022. Variation of pollution sources and health effects on air pollution before and during COVID-19 pandemic in Linfen, Fenwei Plain. Environ Res. 213:113719. doi: 10.1016/j.envres.2022.113719.
- Lyapustin A, Wang Y, Laszlo I, Kahn R, Korkin S, Remer L, Levy R, Reid JS. 2011. Multiangle implementation of atmospheric correction (MAIAC): 2. Aerosol algorithm. J Geophys Res. 116 (3):1–15. doi: 10.1029/2010JD014986.
- Lyapustin A, Wang Y, Laszlo I, Korkin S. 2012. Improved cloud and snow screening in MAIAC aerosol retrievals using spectral and spatial analysis. Atmos Meas Tech. 5(4):843–850. doi: 10.5194/amt-5-843-2012.
- Ma X, Jia H. 2016. Particulate matter and gaseous pollutions in three megacities over China: situation and implication. J Appl Ecol. 140:476–494. doi: 10.1016/j.atmosenv.2016.06.008.
- Ma X, Yan P, Zhao T, Jia X, Jiao J, Ma Q, Wu D, Shu Z, Sun X, Habtemicheal B. 2021. Evaluations of surface PM10 concentration and chemical compositions in MERRA-2 aerosol reanalysis over Central and Eastern China. J Remote Sens. 13(7):1317. doi: 10.3390/rs13071317.
- Ma Z, Hu X, Sayer AM, Levy R, Zhang Q, Xue Y, Tong S, Bi J, Huang L, Liu Y. 2016. Satellite-based spatiotemporal trends in PM2.5 concentrations: China, 2004–2013. Environ Health Perspect. 124(2):184–192. doi: 10.1289/ehp.1409481.
- Mahowald N. 2011. Aerosol indirect effect on biogeochemical cycles and climate. Science. 334(6057):794–796. doi: 10.1126/science.1207374.
- Misra P, Takigawa M, Khatri P, Dhaka SK, Dimri AP, Yamaji K, Kajino M, Takeuchi W, Imasu R, Nitta K, et al. 2021. Nitrogen oxides concentration and emission change detection during COVID-19 restrictions in North India. Sci Rep. 11(1):9800 10.1038/s41598-021-87673-2.PMC:33963208
- Petitjean F, Inglada J, Gancarski P. 2014. Assessing the quality of temporal high-resolution classifications with low-resolution satellite image time series. IEEE J Sel Top Appl Earth Obs Remote Sens. 7(7):2693–2712.
- Renhe Z, Qiang LI, Ruonan Z. 2014. Meteorological conditions for the persistent severe fog and haze event over eastern China in January 2013. Sci China Earth Sci. 57(1):10.
- Sharma M, Singh RP, Kumar R. 2016. Dynamical characteristics of atmospheric aerosols over IG region. In Proceedings of the Remote Sensing of the Atmosphere, Clouds, and Precipitation VI. p. 98761B.
- Shen H, Li T, Yuan Q, Zhang L. 2018. Estimating regional ground-level PM2.5 directly from satellite top-of-atmosphere reflectance using deep belief networks. J Geophys Res. 123(24):13,875–13,886.
- Shtein A, Kloog I, Schwartz J, Silibello C, Michelozzi P, Gariazzo C, Viegi G, Forastiere F, Karnieli A, Just AC, et al. 2019. Estimating daily PM2.5 and PM10 over Italy using an ensemble model. Environ Sci Technol. 54(1):120–128. doi: 10.1021/acs.est.9b04279.
- Su Z, Lin L, Chen Y, Hu H. 2022. Understanding the distribution and drivers of PM2.5 concentrations in the Yangtze River Delta from 2015 to 2020 using random forest regression. Environ Manag. 194(4):284.
- Tang Y, Deng R, Li Jun, Liang Y, Xiong L, Liu Y, Zhang R, Hua Z. 2021. Estimation of Ultrahigh Resolution PM2.5 Mass Concentrations Based on Mie Scattering Theory by Using Landsat8 OLI Images over Pearl River Delta. Remote Sensing. 13(13):2463 doi: 10.3390/rs13132463.
- Tao J, Gao J, Zhang L, Zhang R, Che H, Zhang Z, Lin Z, Jing J, Cao J, Hsu S-C. 2014. PM2.5 pollution in a megacity of southwest China: source apportionment and implication. Atmos Chem Phys. 14(16):8679–8699. doi: 10.5194/acp-14-8679-2014.
- Van Zyl TL, Celik T. 2021. Did we produce more waste during the COVID-19 lockdowns? A remote sensing approach to landfill change analysis. IEEE J Sel Top Appl Earth Observations Remote Sens. 14:7349–7358. doi: 10.1109/JSTARS.2021.3097446.
- Wang M, Cao C, Li G, Singh RP. 2015. Analysis of a severe prolonged regional haze episode in the Yangtze River Delta, China. Atmos Environ. 102:112–121. doi: 10.1016/j.atmosenv.2014.11.038.
- Wei J, Li Z, Lyapustin A, Sun L, Peng Y, Xue W, Su T, Cribb M. 2021. Reconstructing 1-km-resolution high-quality PM2.5 data records from 2000 to 2018 in China: spatiotemporal variations and policy implications. Remote Sens Environ. 252(1):112136. doi: 10.1016/j.rse.2020.112136.
- Xie P, Liu X, Liu Z, Li T, Zhong L, Xiang Y. 2011. Human health impact of exposure to airborne particulate matter in Pearl River Delta, China. Water Air Soil Pollut. 215(1-4):349–363. doi: 10.1007/s11270-010-0483-0.
- Xie Y, Wilson AM. 2020. Change point estimation of deciduous forest land surface phenology. Remote Sens Environ. 240:111698. doi: 10.1016/j.rse.2020.111698.
- Xue T, Zheng Y, Geng G, Zheng B, Jiang X, Zhang Q, He K. 2017. Fusing observational, satellite remote sensing and air quality model simulated data to estimate spatiotemporal variations of PM2.5 exposure in China. J Remote Sens. 9(3):221. doi: 10.3390/rs9030221.
- You W, Zang Z, Pan X, Zhang L, Chen D. 2015. Estimating PM2.5 in Xi’an, China using aerosol optical depth: a comparison between the MODIS and MISR retrieval models. Sci Total Environ. 505:1156–1165. doi: 10.1016/j.scitotenv.2014.11.024.
- Zhang R, Jing J, Tao J, Hsu S-C, Wang G, Cao J, Lee CSL, Zhu L, Chen Z, Zhao Y, et al. 2013. Chemical characterization and source apportionment of PM2.5 in Beijing: seasonal perspective. Atmos Chem Phys. 13(14):7053–7074. doi: 10.5194/acp-13-7053-2013.
- Zhang T, Zhu Z, Gong W, Zhu Z, Sun K, Wang L, Huang Y, Mao F, Shen H, Li Z, et al. 2018. Estimation of ultrahigh resolution PM2.5 concentrations in urban areas using 160 m Gaofen-1 AOD retrievals. Remote Sens Environ. 216:91–104. doi: 10.1016/j.rse.2018.06.030.