
 ?Mathematical formulae have been encoded as MathML and are displayed in this HTML version using MathJax in order to improve their display. Uncheck the box to turn MathJax off. This feature requires Javascript. Click on a formula to zoom.
Abstract
This study investigated the temporal and spatial patterns of heat wave (HW) events in Jiangxi, China. Our analysis is based on the observation data, including daily maximum temperature and daily average air relative humidity from 81 meteorological stations from 1959 to 2023. We also examined the impact of HW events on summer electricity consumption by taking the capital city of Jiangxi, Nanchang, as a case study. The results reveal an overall increase in the frequency of HW events over the past 65 years, with a pronounced increase since 1997, particularly in central and southern Jiangxi. The onset of HW events has generally occurred earlier, while their cessation has been delayed across most areas of Jiangxi Province, resulting in extended HW periods. Economic growth in regions like the Jitai Basin, the Ganfu Plain, and the hilly areas of northeastern Jiangxi has been accompanied by more intense and prolonged HW events. In Nanchang City, the summer electricity load increased by approximately 9% on holidays compared to working days and by about 20% on high-temperature days compared to normal conditions. These insights highlight the need for adaptive strategies to mitigate the impacts of increasing HW occurrences.
1. Introduction
Global surface temperature has increased more rapidly since 1970 than in any other 50-year period over at least the last 2000 years. Emissions of greenhouse gases from human activities are responsible for approximately 1.1 °C of warming since 1850–1900. Over the next 20 years, global temperature is projected to reach or exceed 1.5 °C of warming (IPCC 2021). Concurrently, the frequency of extreme temperature events has increased globally. For example, since June 25, 2021, an unprecedented HW has continued to affect the western United States and western and southwestern Canada. By July 3, nearly 500 fatalities had been reported in the western provinces of Canada. The persistent high temperature and dry conditions have also caused water shortages and severely affected agricultural production and power supply in the affected regions. Consequently, investigating the frequency and intensity of extreme climate events in specific areas is critically important.
In recent years, considerable research has been conducted on various aspects of HW events, including their characteristics (Bu et al. Citation2021; Liu et al. Citation2024), formation mechanisms (An and Zuo Citation2021), risk assessments (Deng et al. Citation2022), and impacts on human health or agriculture (Jiang et al. Citation2016; Luo et al. Citation2016; Feng and Li Citation2016; Zhan Citation2018; Liu and Sun Citation2020). In specific, Shu et al. (Citation2023) used the Weather Research and Forecast (WRF) model with a spatial resolution of 1 km to study urban climates before, during, and after a heatwave. Zhang and Qian (Citation2020) applied linear trend analysis to investigate the frequency of heatwaves in China from 1960 to 2018, identifying a statistically significant increase in high-temperature occurrences primarily in Southern and Northwestern China, with heatwave events predominantly located in Southern China and Xinjiang autonomous region. Shen et al. (Citation2018) analyzed the characteristics of HW in China and revealed the temporal span of national HW events from early July to early September over the period 1961 to 2014. Wang et al. (Citation2015) selected strong climate models to conduct an ensemble projection of hot spell intensity, frequency, and duration and their trends in future decades and found that the HW events increased significantly in northern China and coastal areas while decreasing significantly in central China. Based on the data from 110 meteorological stations in the coastal region of China in 1960-2013, Huang et al. (Citation2016) analyzed the variation of extreme temperature indices and showed that in the last 54 years the absolute indices, i.e. coldest day, warmest day, coldest night and warmest night, have increased significantly, with an increasing rate of 0.40 °C per decade. Xing et al. (Citation2020) studied the spatiotemporal variation characteristics of HW events (frequency, duration, intensity) in North China and showed that the annual average HW had an increasing trend and increased significantly since the mid-1990s. The high temperatures were often recorded in the southern and western parts of North China, with increasing heatwave days observed at most weather stations (Xing et al. Citation2020). Further, regional persistent HW events were extensively studied, and their intensity was normally investigated from the regional average. A significant linear growth trend was observed in the persistent heat event index in South China, North China, and the Yangtze River (Lin et al. Citation2021).
Given China’s vast and complex terrain, HW events display varied patterns across different regions. As an example, HW events within the Yangtze River Economic Belt exhibit a consistent pattern described as ‘one belt and one point,’ and the exposure index to heat waves within the belt shows a clear tendency to decrease from northwest to southeast. The Yangtze River Economic Belt covers several provinces (e.g. Sichuan, Hubei, Jiangxi, and Zhejiang) and cities (e.g. Chongqing and Shanghai) that span the length of the Yangtze River, from its upper reaches in the Tibetan Plateau through the fertile lands of central China to its mouth in Shanghai on the East China Sea. In this belt, the high-temperature intensity in most parts of central and northern Jiangxi Province reaches 36.2 °C-36.6 °C. As one of the most HW-impacted regions, the districts and counties with high frequency, duration, and intensity of HW events have all been located in Jiangxi Province (Zhang et al. Citation2023). Jiangxi has also experienced an evident increase in persistent regional high-temperature events, with a maximum frequency of eight occurrences per year over the past 62 years. The annual maximum index of these persistent regional high-temperature events initially decreased and then significantly increased, particularly since 1993 (Liu et al. Citation2021). Along the belt, in the Jianghuai and most of the Jiangnan regions, as well as the eastern Sichuan Basin, there has been a high frequency, number of days, and intensity of HW events, with northern Jiangxi and northern Zhejiang experiencing the highest frequencies and longest durations, and northern Zhejiang facing the highest intensities. Since the 1990s, the frequency, duration, and intensity of heat waves across China have markedly increased, with an expansion in their spatial extent (Ye et al. Citation2013).
The influence of climate change predicts that future HW events will occur with greater frequency and intensity, posing severe risks to the global economy, society, and human well-being. As living standards improve, there is a growing demand for a better quality of life, which warrants the need to conduct an in-depth analysis of HW events in highly impacted regions. Therefore, this study aims to analyze interdecadal characteristics, seasonal changes, and regional differences of HW events in Jiangxi, by expanding the research period and spatial dimension. We also used the capital city of Jiangxi, Nanchang City, as a case study to explore the impact of HW events on summer electricity consumption. Such efforts are crucial for developing a vulnerability assessment framework of HW events, providing references for early warning of regional HW risk, and informing disaster prevention, mitigation and response strategies. Ultimately, the findings of this study could offer a scientifically sound basis for mitigating extreme HW disasters and increasing adaptability to future HW events.
2. Data and method
2.1. Study area
Jiangxi Province, situated on the southern bank of the middle and lower reaches of the Yangtze River (24°29′∼30°04′ N, 113°34′∼118°28'E, area:166,900 km2; see ), experiences a subtropical humid monsoon climate. The region receives an annual total precipitation of 1,700 mm to 1,943 mm and an annual mean temperature between 16.3 °C and 19.5 °C. The topography predominantly features high terrain in the south and low elevations in the north, resembling a dustpan opening northward. This configuration is characteristic of the Jiangnan hills, with the province surrounded by mountains on the east, west and south sides. The landscape of the region includes a mix of hills and valley plains, with Poyang Lake Plain located in the northern part of Jiangxi.
Figure 1. Spatial distribution of terrain and meteorological stations in Jiangxi Province, China.
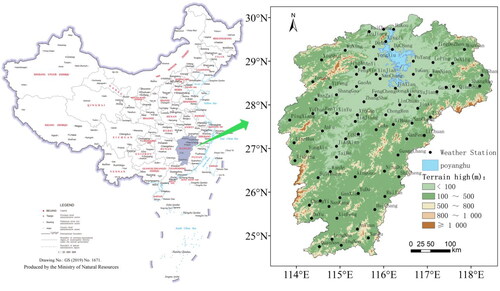
Influenced by the western Pacific subtropical high, Jiangxi frequently experiences persistent or intermittent abnormal HW post the annual flood season (July-September). This period marks Jiangxi as one of the region’s most severely affected by HW events, exacerbated by high air humidity and elevated temperature, which contributes to the sultry conditions felt by local residents.
2.2. Data
The daily observation data from 1959-2023 were downloaded from 81 meteorological stations that were established before 1959 and have consistently conducted regular operational observations without any data interruptions or gaps (the black-filled circles in ). These data include daily maximum temperature and daily average air relative humidity. Two stations (Lushan Station with an altitude of 1,164.5 m, and Jinggang Mountain Station with an altitude of 843 m) were further excluded from the analysis owing to their high altitudes, which are not representative of typical heat wave conditions. In addition, this study incorporates daily summer electricity load data from Nanchang, the capital city of Jiangxi Province, for the period from 2014 to 2017.
2.3. Methods
2.3.1. HW index calculation
The criteria and the corresponding parameters to calculate HW events vary across different regions and depend on the specific objective of the research. The World Meteorological Organization (WMO) recommends that a daily maximum temperature ≥32 °C as the index to identify HW events, while the China Meteorological Administration (CMA) sets a higher threshold, issuing high temperature warnings when the daily maximum temperature reaches ≥35 °C (Order No. 16 of China Meteorological Administration Citation2007). For this study, an intermediate threshold of ≥33 °C was adopted as the initial value for calculating the HW index (Huang et al. Citation2011).
There are two threshold methods (absolute and relative) for the identification and assessment of HW events. The absolute method is simple to calculate but does not consider the regional difference in climate (Jia and Hu Citation2017). The relative method, on the other hand, considers regional differences by using a specific percentile of the maximum temperature of a station as the standard to distinguish HW events (Wang et al. Citation2017).
Most studies, such as those by Cowan et al. (Citation2014), use air temperature as the sole variable to determine the intensity and frequency of HW events. For example, the CMA defines HW events when the ‘daily maximum temperature ≥35 °C and lasting for more than 3 days.’ However, research has indicated that HW events in southern China are highly impacted by humidity conditions (Huang et al. Citation2011). Humidity not only affects human perception during HW events (Kovats and Hajat Citation2008), but also elevates the peak somatosensory temperature (Russo et al. Citation2017). Therefore, both temperature and humidity were considered in this study of HW events in Jiangxi Province. HW index (HI) was computed as follows (Huang et al. Citation2011):
(1)
(1)
Where is heat index of one day;
is the critical value of heat index;
is the heat index of the I day before one day;
is the number of days from the day before the i day;
is the duration of the high temperature weather process. The heat index (
was calculated as follows:
(2)
(2)
(3)
(3)
Where Tc is the daily maximum temperature (°C); is the daily average relative humidity of air (%).
2.3.2. Determination of the critical value of heat ( )
)
The critical value of heat is a necessary parameter for calculating the HW index and determining whether the high-temperature events qualify as HW events. Given the significance of regional differences in defining HW events, this study adopted a quantile method to calculate the critical value of heat, which involves the following steps: 1) utilizing daily observational meteorological data from May to October for the years 1959 to 2023, samples where the daily maximum temperature is ≥33 °C were selected; 2) the heat index for these selected samples was calculated to assess the intensity of the heat; and 3) the calculated heat index was sorted in ascending order. The 50th quantile was selected as the critical value of heat for Jiangxi Province. The quantile calculation formula is given as follows (Hyndman and Fan Citation1996):
(4)
(4)
(5)
(5)
(6)
(6)
Where is the jth quantile;
is the sample sequence of HW after ascending order;
is the quantile value (0.5 in this study);
is the total number of sequences;
is the sequences of the jth number;
is the weight of the (j + 1) number of sequences.
2.3.3. Classification of HW
The calculated HW index was categorized into three distinct severity levels: mild HW event defined as 2.8 ≤ HI < 6.5, moderate HW event as 6.5 ≤ HI <10.5, and severe HW event as HI ≥ 10.5.
2.3.4. Statistical methods
Using a variety of statistical methods including the T distribution, F distribution significance tests (all of which passed the 0.05 significance level, unless otherwise noted), cumulative anomaly, and linear trend analysis, the temporal and spatial characteristics of HW events in Jiangxi Province were analyzed.
The linear trend analysis method employed a linear equation to model the temporal variation of each variable, representing how data changes over time. The formula is given as follows:
(7)
(7)
Where = d
/dt is the climate tendency rate, representing the change of meteorological elements over time.
In this study, the frequency of HW events refers to the number of occurrences, the duration of HW events refers to the number of days of HW events, and the HW index represents the intensity of HW events. The distribution maps in this study were obtained by inverse distance weight interpolation of all selected stations.
3. Characteristics analysis of HW events
3.1. Frequency and variation of HW events
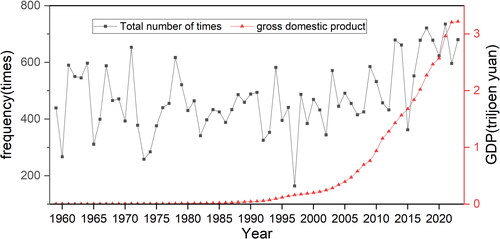
From 1959 to 2023, Jiangxi province experienced 30,984 HW events, with an average duration of 3.1 days per event. The annual distribution of these events varied significantly, reaching a peak of 735 events in 2021 and a low of 164 events in 1997. Overall, there was a marked increase in the frequency of HW events, averaging an annual rate of 2.4 additional events per year (p < 0.002; ). From 1997 to 2023, the trend showed a significant increase of 12.76 events per year (p < 0.0001). Compared to the 1990s and 2000s, the frequency of HW events in the 2010s significantly intensified, indicating a continuing upward trend in Jiangxi.
Figure 2. Change in the frequency of HW events in Jiangxi Province (1959-2023).
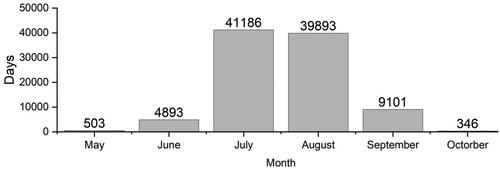
Monthly data analysis () revealed that HW days in Jiangxi occurred from May to October, predominantly between July and August, which accounted for 84.5% of the total during the study period. September followed with 9.5% of the total. June comprised 5.1% of days, typically occurring in late June. The fewest days were in May and October, making up only 0.9% of the total.
Figure 3. Monthly change in the frequency of HW days in Jiangxi Province (1959 -2023).
Spatially, the cumulative frequency of HW events at various meteorological stations in Jiangxi is shown in . The areas with the highest frequency were predominantly in the central, northeastern, and northwestern parts of the province, generally exceeding 1,300 days, with the maximum frequency recorded at Xiaping station (1,603 days). Considering topographical influences, it was observed that HW events were frequent in basins and valleys.
Figure 4. Spatial distribution of cumulative frequency (a) and its trends (b) of HW events in Jiangxi (1959-2023) (shading indicates cumulative frequency (a) and the trend significance level (b). Solid triangles indicate passing 0.05 significance test).
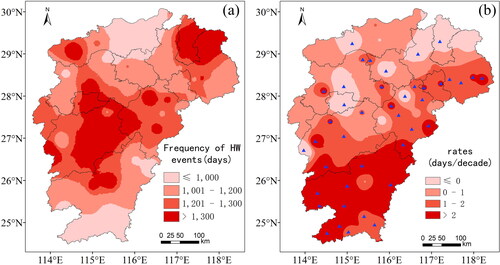
The trend analysis at most meteorological stations in Jiangxi, shown in , indicates an increasing frequency of HW events. The rate of increase was generally higher in the southern parts of the region than in the north. Stations in southern Jiangxi, experiencing more than a 1-day increase per decade (maximum: 4.37 days/decade at Shangyou station), indicate the fastest increase in HW event frequency. Conversely, the rate in the northern part displayed a decreasing trend, with increases of less than 0 days/decade (minimum: −3.42 days/decade at Xiaping station). The Jitai Basin not only exhibited the highest frequency of HW events but also showed the most significant increase in frequency.
3.2. Distribution characteristics of the longest duration of HW events
During 1959-2023, HW events occurred at all meteorological stations of the study area, but with a large spatial variation during the study period (). The centers of long HW durations, where HW events exceeded 30 days, were predominantly located in the central and northeastern parts of the study areas. In contrast, the areas with short HW durations, fewer than 20 days, were mainly in southern regions. The maximum duration of HW events across most Jiangxi Province from 1959 to 2023 followed an increasing trend. This trend was particularly pronounced in most parts of southern Jiangxi and the southeastern section of northern Jiangxi, where the increase exceeded 0.5 days per decade. However, a few areas in northern Jiangxi exhibited a decreasing trend in the duration of HW events (). Further research is necessary to identify the specific factors contributing to this trend.
Figure 5. Spatial distribution of the longest duration (a) and its trend (b) of HW events in Jiangxi Province (1959–2023) (shading indicates the longest duration (a) and the trend significance level (b). Solid triangles indicate passing 0.05 significance test).
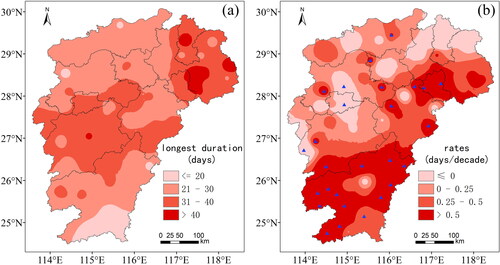
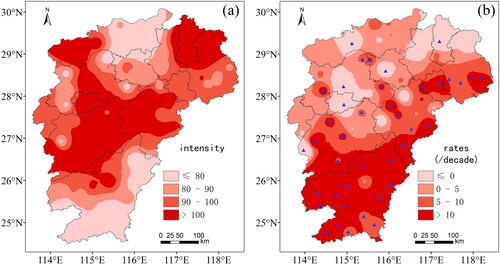
3.3. Intensity distribution of HW events
illustrates that the spatial distribution pattern of HW events in Jiangxi Province was similar to that of its cumulative frequency, mainly affected by factors such as altitude and large bodies of water. The overall distribution showed greater intensity in the northern part (>80) than in the south (80) of the study area. High-intensity values (>100) were concentrated in the central, northeastern and northwestern areas. Like the number of HW events, the intensity of HW events has also displayed an increasing trend across most regions of Jiangxi Province, with changes ranging from 0 to 27.37 per decade. The stations with relatively modest growth were located in the northern part of Jiangxi Province, possibly due to the large intensity in this region. In contrast, the stations with the greatest increases were concentrated in southern and central areas (10/decade; max:27.36/decade at Suichuan Station), where the intensity of HW events was generally lower at most stations. Unlike the northern and southern parts of Jiangxi Province, the intensity and its trend were great in the central part of the Province, potentially linked to topography; the area experiences more HW events in the hills compared to the plains. We also noted that the intensity of HW events increased significantly after 1997, which might be related to the rapid development of urbanization in the region.
Figure 6. Spatial distribution (a) and its trends (b) of intensity of HW events in Jiangxi Province (1959-2023) (shading indicates intensity (a) and the trend significance level (b). Solid triangles indicate passing 0.05 significance test).
3.4. Characteristics of the onset and cessation of HW events
HW events in Jiangxi Province have well-characterized stages during high-temperature seasons, with each phase distinguished by the earliest onset and latest cessation dates recorded at each station. The onset date refers to the first day of an HW event each year, while the cessation date marks the final day of an HW event.
In the northern part of Jiangxi Province, HW events typically began in early to mid-June. However, some stations in the southwestern part of the province reported earlier onset dates, with the earliest recorded on May 3, 2020, at Suichuan Station. In most other regions, HW events generally started in mid to late May. HW events extending to early October constituted 96.3% of occurrences, while those that persist into mid-October accounted for only 3.7% of the total, with the latest recorded cessation date being October 15, 1994, at Taihe (Zhangshu) ().
Figure 7. Spatial distribution of the earliest start date (a) and its trend significance level (c), the latest end date (b) and its trend significance level (d) of HW events in Jiangxi (1959-2023) (solid triangles indicate passing 0.05 significance test).
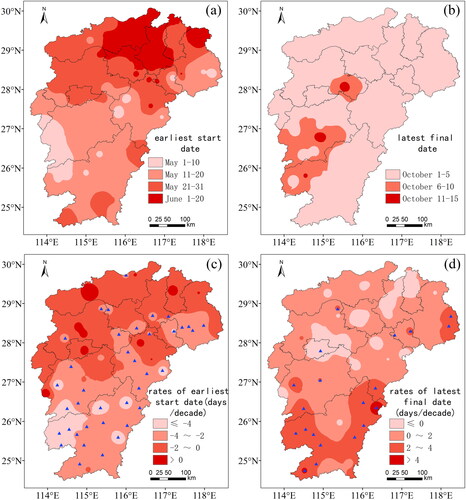
The onset dates for HW events across Jiangxi Province have shown a trend of advancing over time (). Generally, the advancement rate at most stations in the southern part of the province (mean: 2-4 days/decade; maximum: 6.8 days/decade at Shangyou Station) was greater than in the northern part (mean < 2 days/decade). Conversely, the cessation dates for HW events have demonstrated a trend of delay across all regions (). Similarly, the delay at most stations in the southern part (mean: 2-4 days/decade; maximum: 4.83 days/decade at Shicheng Station) exceeded that in the northern part (mean <2 days/decade). The combined trends of earlier onsets and later cessations in the southern part of Jiangxi Province were pronounced, indicating a significantly increased risk of HW disasters in this area.
4. Grade of HW events
HW events were categorized into three levels: severe (HI ≥ 10.5), moderate (6.5 ≤ HI < 10.5), and mild (2.8 ≤ HI < 6.5) (). From 1959 to 2023, Jiangxi Province experienced a total of 30,984 HW events. Of these, 24,182 were mild HW events, constituting 78.0% of the total, with an average duration of 2.1 days per event and an average intensity of 8.5 per event. There were 6,134 moderate HW events, making up 19.8% of the total, with an average duration of 6.1 days per event and an average intensity of 35.7 per event. Additionally, there were 654 severe HW events, accounting for 2.2% of the total, with an average duration of 12.2 days per event and an average intensity of 95.7 per event. As the classification of HW events escalated from mild to moderate, both the duration and intensity of the events increased significantly.
Table 1. Rank distribution of HW events, the corresponding average duration and intensity in Jiangxi Province (1959–2023).
4.1. Annual and monthly changes of HW events
From 1959 to 2023, the annual average occurrences of mild, moderate, and severe HW events in Jiangxi Province were 372.0, 94.4 and 10.3 times, respectively. The highest annual counts for these categories were recorded at 643 mild in 2021, 230 moderate in 1967, and 85 severe in 2003. Notably, there were 17 years without any severe HW events, with 16 of these years occurring before the year 2000. Overall, the frequency of HW events in all categories has shown a year-over-year increase, with severe, moderate, and mild HW events increasing by 0.25, 0.98, and 1.79 events per year, respectively.
The monthly distribution of HW events is detailed in , showing a concentration of occurrences from June to September. July experienced the highest number of HW events annually, peaking at 41,186. In August, the numbers remained relatively stable, with 39,893 events, followed by 9,101 in September and 3,228 in June. When examined by severity, the highest number of severe HW events occurred in August, totaling 882 events. Conversely, the peak numbers for mild and moderate HW events both occur in July, with counts of 32,284 for mild and 8,310 for moderate events. In terms of intensity, the primary peak across all grades occurs in August, followed by a secondary peak in July.
Table 2. Days and intensity of different grades of HW events during June to September in Jiangxi Province (1959–2023).
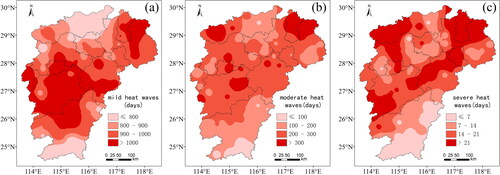
4.2. Spatial distribution of the frequency of HW events by grade
The regions affected by different grades of heat wave (HW) events varied slightly across space (). Like the overall frequency of HW events, the high-frequency areas for mild HW events were primarily located in the northeastern and central parts of Jiangxi Province, while the lower-frequency areas were primarily in the northern and southern regions. Differently, the high-frequency areas for moderate and severe HW events were mostly located in the northern part of the province, excluding the Poyang Lake area, with some high-frequency stations for these more intense events also found in the central region. The southern part of South Jiangxi and the areas surrounding Poyang Lake typically exhibited lower frequencies for all grades of HW events.
Figure 8. Spatial distribution of frequency of mild (a), moderate (b) and severe (c) HW events in Jiangxi Province (1959–2023).
5. Comparison of typical HW events and electricity load
The daily data from May to October of 2014-2017 were divided into two categories according to holidays (including weekends, Labor Day, Dragon Boat Festival, National Day, Mid-Autumn Festival) and working days, and the electricity load data of Nanchang City were analyzed respectively. We found that electricity consumption during holidays in 2014-2017 increased by 8.0%, 9.2%, 11.5% and 7.7%, respectively, compared to working days. According to the classification of high-temperature days (daily maximum temperature greater than or equal to 35 °C) and non-high temperature days, the electricity consumption of high-temperature days in 2014-2017 increased by 22.7%, 28.9%, 19.5% and 21.3% respectively compared to non-high temperature days. These results suggest that high temperatures have a much greater impact on electricity consumption than holidays.
The daily average power load data of Nanchang City from July to August (2014-2017) were selected to test the effect of the HW index. A correlation analysis showed a significant positive correlation between electricity load and the HW index (p < 0.0001; ), with a correlation coefficient of 0.8313 in 2014. This finding is consistent with research by Burillo et al. (Citation2019) and Sathaye et al. (Citation2013), which attribute the increased electricity load primarily to the heightened use of cooling appliances such as air conditioners during high temperatures.
Table 3. Correlation coefficients between daily HW index and electricity load in Nanchang from July to August (2014–2017).
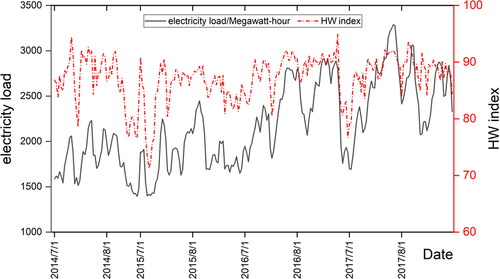
Electricity load patterns mirrored the HW events (). During prolonged HW events, there were notable peaks in electricity demand, such as those observed from July 17-27, 2014, July 24 to August 1, 2016, and July 22-30, 2017.
Figure 9. Comparison of daily power load and HW index in July - August of Nanchang from (2014–2017).
6. Conclusions
This study constructed a Heat Wave (HW) index for Jiangxi Province using daily maximum temperature and average air relative humidity data over the past 65 years to analyze the spatial and temporal distribution of HW events, identify areas susceptible to frequent and severe HW occurrences, and explore the underlying causes of these patterns and trends including topography and economic development. Additionally, the impact of high temperatures on power supply was examined in relation to electricity load dynamics in the capital city of Jiangxi. We have the following three key findings: 1) geographic and topographic influences on HW events: the central and northeastern parts of Jiangxi province, characterized by hilly and plain areas, experienced more intense HW events than the mountainous regions. The central northern part, containing the Poyang Lake Basin, was influenced by large water bodies, which mitigated the occurrence of HW events; 2) trends in HW events: HW events in Jiangxi Province have been intensifying. This trend was evidenced by earlier onset dates, delayed cessation dates, and increasing trends in the maximum duration and cumulative intensity of HW events across most areas; and 3) impact on electricity load: the effect of high temperatures on electricity load was significant in Nanchang city, exceeding the impacts observed during holidays. High temperatures drove increased use of cooling systems, leading to substantial spikes in power consumption.
Future work could expand the analysis of the occurrence, distribution, and drivers of HW events in Jiangxi Province and explore the impact of HW disasters on various sectors in combination with the environmental conditions, aiming to develop more comprehensive strategies for mitigation and response.
Disclosure statement
No potential conflict of interest was reported by the author(s).
Additional information
Funding
References
- An N, Zuo ZY. 2021. Changing structures of summertime heatwaves over China during 1961-2017. Sci Sin (Terrae). 51(8):1214–1226. (in Chinese).
- Bu FR, Sun P, Yao R, et al. 2021. High temperature heat waves in the Huaihe River Basin and relation to the Madden-Julian oscillation: spatio temporal properties and causes. Sci Geogr Sin. 41(4):705–716. (in Chinese).
- Burillo D, Chester MV, Pincetl S, Fournier ED, Reyna J. 2019. Forecasting peak electricity demand for Los Angeles considering higher air temperatures due to climate change. Appl Energy. 236:1–9. doi: 10.1016/j.apenergy.2018.11.039.
- China Meteorological Administration. 2007. Measures for the issuance and dissemination of meteorological disaster early warning signals. Order No. 16 of China Meteorological Administration. EB/OL. (in Chinese). https://www.cma.gov.cn/zfxxgk/gknr/flfgbz/gz/202005/t20200528_1694399.html.
- Cowan T, Purich A, Perkins S, Pezza A, Boschat G, Sadler K. 2014. More frequent, longer and hotter heat waves for Australia in the twenty-first century. J Clim. 27(15):5851–5871. doi: 10.1175/JCLI-D-14-00092.1.
- Deng TT, Geng GP, Yang R, et al. 2022. Temporal and spatial variation characteristics of high temperature and heat wave in the Weihe River Basin from 1980 to 2020. Arid Land Geogr. 46(2):211–221. (in Chinese).
- Feng L, Li XD. 2016. Effects of heat waves on human health: a review of recent study. J Environ Health. 33(12):182–188. (in Chinese).
- Huang Z, Chen H, Tian H. 2011. Research on the heat wave index. Meteorol Mon. 37(3):345–351. (in Chinese).
- Huang XY, Wang XP, Wang JS, et al. 2016. Variation of extreme temperature events in coastal region of China in 1960-2013. Sci Geogr Sin. 6(4):12–620. (in Chinese).
- Hyndman RJ, Fan YN. 1996. Sample quantiles in statistical packages. Am Stat. 50(4):361–365. doi: 10.1080/00031305.1996.10473566.
- Jia J, Hu ZY. 2017. Spatial and temporal features and trend of different level heat waves over China. Adv Earth Sci. 32(5):546–559. (in Chinese).
- Jiang R, Chen L, Xiang WN. 2016. Characteristics of extreme high temperature weather in Shanghai. J Meteorol Environ. 32(1):66–74. (in Chinese).
- Kovats RS, Hajat S. 2008. Heat stress and public health: a critical review. Annu Rev Public Health. 29(1):41–55. doi: 10.1146/annurev.publhealth.29.020907.090843.
- Lin AL, Gu DJ, Peng DD, et al. 2021. Climatic characteristics of regional persistent heat event in the Eastern China during recent 60 years. J Appl Meteor Sci. 32(3):302–314. (in Chinese).
- Liu WY, Sun SQ. 2020. Study on the characteristics of single-season rice heat injury in Jiangxi province. Meteorol Disaster Reduct Res. 43(4):307–313. (in Chinese).
- Liu WY, Sun SQ, Liu DM, et al. 2021. Characteristics of persistent regional high temperature processes in Jiangxi Province during 1959—2020. Meteorol Disaster Reduct Res. 44(4):251–256. (in Chinese).
- Liu WY, Sun SQ, Zhu XQ, et al. 2024. Analysis and assessment of regional high temperature and drought processes in Jiangxi Province. J Arid Meteorol. 42(2):187–196. (in Chinese).
- Luo XL, Du YD, Zheng J. 2016. Risk regionalization of human health caused by high temperature & heat wave in Guangdong Province. Clim Change Res. 12(2):139–146. (in Chinese).
- Russo S, Sillmann J, Sterl A. 2017. Humid heat waves at different warming levels. Sci Rep. 7(1):7477. doi: 10.1038/s41598-017-07536-7.
- Sathaye JA, Dale LL, Larsen PH, Fitts GA, Koy K, Lewis SM, de Lucena AFP.,. 2013. Estimating impacts of warming temperatures on California’s electricity system. Global Environ Change. 23(2):499–511. doi: 10.1016/j.gloenvcha.2012.12.005.
- Shen HJ, You QL, Wang PL, et al. 2018. Analysis on heat waves variation features in China during 1961-2014. J Mereorol Sci. 38(1):28–36. (in Chinese).
- Shu C, Gaur A, Wang L, Lacasse MA. 2023. Evolution of the local climate in Montreal and Ottawa before, during and after a heatwave and the effects on urban heat islands. Sci Total Environ. 890:164497. doi: 10.1016/j.scitotenv.2023.164497.
- Wang P, Tang J, Sun X, Wang S, Wu J, Dong X, Fang J.,. 2017. Heat waves in China: definitions, leading patterns, and connections to large-scale atmospheric circulation and SSTs. JGR Atmos. 122(20):10,679–10,699. doi: 10.1002/2017JD027180.
- Wang W, Zhou W, Li Y, Wang X, Wang D.,. 2015. Statistical modeling and CMIP5 simulations of hot spell changes in China. Clim Dyn. 44(9-10):2859–2872. doi: 10.1007/s00382-014-2287-1.
- Xing P, Yang RZ, Du WP, et al. 2020. Spatiotemporal variation of high temperature day and heat wave in north China during 1961—2017. Sci Geogr Sin. 40(8):1365–1376. (in Chinese).
- Ye DX, Yin JF, Chen ZH, et al. 2013. Spatiotemporal change characteristics of summer heatwaves in China in 1961—2010. Clim Change Res. 9(1):15–20. (in Chinese).
- Zhan MJ. 2018. Impact of high temperature on human health and energy consumption in China southern cities under global warming. PhD thesis, Chinese Academy of Meteorological Sciences. (in Chinese)
- Zhang YX, Huang XJ, Zheng DY. 2023. Temporal and spatial characteristics of heat waves and assessment of vulnerability in the Yangtze River economic belt. Res Environ Yangtze Basin. 32(2):440–450. doi: 10.11870/cjlyzyyhj202302019. (in Chinese).
- Zhang JY, Qian C. 2020. Linear trends in occurrence of high temperature and heat waves in China for the 1960–2018 period: method and analysis results. Clim Environ Res. 25(3):225–239. (in Chinese).