
 ?Mathematical formulae have been encoded as MathML and are displayed in this HTML version using MathJax in order to improve their display. Uncheck the box to turn MathJax off. This feature requires Javascript. Click on a formula to zoom.
Abstract
The multidisciplinary approach outlined in this paper aims to assess the correlation between geophysical and social vulnerability for disaster risk reduction. To achieve this, two multi-criteria methods based on Geographic Information Systems (GIS) techniques have been integrated to assess the risk to natural hazards in the North-East Development Region. The Analytical Hierarchy Process (AHP) was utilized to conduct a comprehensive hazard analysis, including floods, landslides, and earthquakes. The Principal Component Analysis (PCA) method was applied to examine the spatial distribution of social vulnerability at the Local Administrative Unit (LAU level), utilizing 24 variables to generate 6 principal components. Based on these results a Regional Risk Index (RRI) was developed using the bivariate method, combining the multi-hazard distribution with social vulnerability. The results showed that the north-eastern part of the region presents the highest risk, encompassing 10.68% of administrative units. These results can contribute to the design of risk reduction programs and policies.
1. Introduction
Natural hazards can be defined as phenomena associated with geophysical processes in the environment that have the potential to cause damage or loss in the presence of a vulnerable community (Stillwell Citation1992). Globally, the frequency and intensity of natural hazards have increased, driven by climate change, rapid urbanization, population growth, and social inequalities, especially in developing countries (IPCC Citation2021). As a result, an increasing number of regions are becoming more vulnerable. Following the adoption of the Sendai Framework for Disaster Risk Reduction (DDR) 2015–2030, social and economic risk management measures have been proposed to address the rising occurrence of natural disasters.
The multi-hazard approach is primarily based on analyzing the main geohazards associated with a particular region while also giving significant importance to the social dimensions (Zhang et al. Citation2023). Rarely is a specific territory exposed to a single natural hazard. Often, multiple events occur simultaneously or cascade, disrupting various economic sectors and social systems (Kappes et al. Citation2012).
The multi-hazard approach is currently considered an important research direction, but the complexity of the subject makes it difficult to identify critical general dimensions to address this challenge. In multi-hazard assessment, several barriers are identified. These include epistemological issues from the lack of a commonly accepted definition, methodological challenges in integrating different hazards into the analysis. Additionally, there are problems related to the availability of existing data (Aksha et al. Citation2020). Thus, only a few studies integrate multiple hazards into risk and impact assessments (Bathrellos et al. Citation2012; Skilodimou et al. Citation2019; Gautam et al. Citation2021; Lyu and Yin Citation2023).
Vulnerability is determined by the susceptibility of communities and individuals exposed to a hazard and their capacity to cope with or recover from the event (Cutter et al. Citation2003). Integrating multi-hazard and social vulnerability assessment provides a realistic perspective on potential impacts, considering social, economic, and cultural elements alongside geophysical factors (Johnson et al. Citation2016). Approaching social vulnerability from a multi-hazard perspective provides a holistic understanding of how populations interact with various natural hazards and explains different capacities to cope and recover based on their characteristics. Population vulnerability is influenced by demographic and social factors, living standards, access to resources, socio-economic status, health status (Rufat et al. Citation2015), and indicators that can describe how vulnerable groups may cope with disasters during and after the event (Bucherie et al. Citation2022). Natural hazards can exacerbate social vulnerability, impacting communities differently based on their varying capacities to cope and recover, which are determined by specific social vulnerability factors. These causal factors, which can vary with exposure levels, explain why similarly exposed populations experience different impacts from natural hazards (Drakes and Tate Citation2022).
In the scientific literature, risk (R) has been characterized as an intersection of hazard exposure (H) and vulnerability (V) of affected systems. This dynamic is represented by the pseudo-equation R = H × V (Wisner et al. Citation2004). Consequently, the assessment of risk in a particular area arises from various sources (hazards) interacting with exposed elements.
Hence, it is essential to consider social vulnerability in risk analyses to achieve a holistic approach and a comprehensive understanding of the impact of natural hazards on communities (Zhang et al. Citation2023). Assessing the risk of a region is challenging in a scientific context because it requires integrating complex interactions between natural hazards and the vulnerability of exposed social systems.
Multi-hazard approaches are based on the Multi-Criteria Decision-Making (MCDM) technique, and the results are integrated into GIS environment to perform a comprehensive analysis (Lyu and Yin Citation2023). One of the most widely used MCDM methods is the Analytical Hierarchy Process (AHP), a quantitative method widely applied to multiple decision problems (Saaty Citation1990; Bathrellos et al. Citation2017). Thus, in this study, expert judgments were utilized to obtain weights on the decision-making process (Malczewski Citation2006).
Social vulnerability is measured by the Social Vulnerability Index (SoVI), which highlights the spatial distribution of communities with vulnerable groups that have a reduced capacity to respond and recover (Cutter and Finch Citation2008). The SoVI methodology has become the principal tool for quantifying social vulnerability (Wang et al. Citation2021), offering broad applicability and adaptability depending on the study′s purpose and data availability. This index is developed using the factorial technique of Principal Component Analysis (PCA), which aims to reduce the dimensionality of a dataset and generate new principal components (Abdi and Williams Citation2010).
Most previous studies in Romania follow a conventional approach to natural hazard assessment (Patriche et al. Citation2016; Romanescu et al. Citation2018; Bălteanu et al. Citation2020) or socio-economic vulnerability assessment (Armaș and Gavriș Citation2013; Bănică and Muntele Citation2015; Botezan et al. Citation2021). However, for reliable and valid results in risk analyses, both physical and socio-economic variables must be considered.
Efficient risk management requires identify areas with high social vulnerability that correlate with a high degree of natural hazard. This study introduces a spatial multi-hazard risk assessment model applicable to the North-East Development Region of Romania.
The aim is to produce a composite risk model using publicly available geospatial and statistical data to help decision-makers effectively develop DRR resources. The overall objectives of the study are: (i) to produce an individual hazard assessment of the area (i.e. for floods, landslides, and earthquakes) followed by multi-hazard mapping; (ii) to calculate social vulnerability at the LAU level; (iii) to integrate the results into a comprehensive Regional Risk Index (RRI) using the bivariate representation method.
The novelty of the study lies in the development of a composite risk index and the identification of areas with significant exposure in terms of both geospatial and socio-economic dimensions within the poorest region in Romania and the European Union, according to Gross Domestic Product (GDP). This type of analysis has not yet been applied in Romania. It employs a hybrid model that conceptualizes risk as a joint product of spatially relevant natural hazards and the current vulnerability of social systems. This is done at the smallest spatial scale where socio-economic data are available. The results of these assessments can contribute to improving emergency management, providing a new methodological approach to assessing DRR at the regional level. The result provides a holistic risk assessment of the North-East Development Region. This study improves emergency management by providing a new approach to understanding the interactions between natural hazards and social vulnerability.
1.1. Study area
Among Central European countries, Romania is significantly affected by natural hazards, particularly floods, which highlight the vulnerability of communities, especially in the eastern region (Bălteanu et al. Citation2010; Romanescu et al. Citation2018).
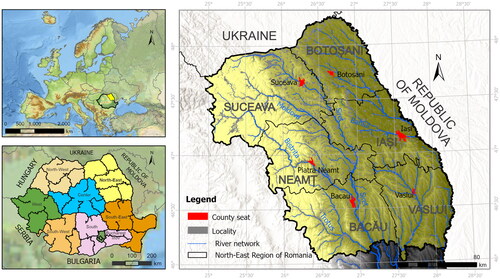
The north-east region is composed of six counties (Botoșani, Suceava, Iași, Neamț, Vaslui, and Bacău) and represents about 15.46% of Romania’s surface area ().
Figure 1. Location of the study region.
The studied area represents a complex region from a physical-geographical point of view. It has low hills in the eastern part, where altitudes vary between 30 and 200 m, and a mountainous area in the western part, with altitudes between 1600 and 1800 m. The climatic conditions, highly variable from one season to the next, frequently generate extreme phenomena due to abundant rainfall, often exceeding 100–200 mm in 24 h (Sandu et al. Citation2008). The main river systems draining this area are the Siret and Prut, which recorded maximum flows in 2005, 2008, 2010, and 2013, not only along their main course but also across numerous tributaries, spanning both mountainous and foothill sectors (Iosub et al. Citation2020). The frequency and magnitude of floods, influenced by climate change, cause significant damage to the population and the environment (Chelariu et al. Citation2019).
Increased precipitation will lead to more frequent landslides or reactivation of existing landslides, which cover about 20% of the area of the Moldavian Plateau (Mărgărint and Niculiţă Citation2017). Another geo-hazard-triggering landslide is represented by earthquakes; the study area is located in the proximity of the Vrancea Seismic Region (Micu et al. Citation2023).
The region is considered a strategic location as it constitutes the eastern border of the European Union. The north-east region is ranked first in the number of people among the eight regions of Romania (16.49% of the population), which highlights the major anthropogenic pressure and a high population density at risk. However, within the region, twice as many inhabitants live in marginalized rural areas (11.3%) than the national average (6.2%) (Teșliuc et al. Citation2015), thus accentuating regional and economic disparities. These disparities are correlated with other dimensions of inequality, such as unemployment rates, public and private material resources, schooling, illiteracy, and life expectancy.
According to European Employment Services (EURES Citation2023), the north-east region has the lowest employment rate in the country, 49.3%, and an unemployment rate of 4.3% in 2023. These values cause labour migration, which has led to an ageing population, a decrease in the number of active people, and other socio-economic phenomena with negative impacts, especially in rural areas (Horea-Șerban and Fîrțală Citation2022).
The social, economic, and demographic characteristics of the north-east region, which interact with geophysical and hydro-meteorological processes, are reflected in the distribution of social vulnerability within this area.
2. Materials and methods
2.1. Data used
From a multi-hazard perspective, the study focused on three types of hazards: floods, landslides, and earthquakes, which are considered the most significant and destructive. High population density, inadequate infrastructure, and limited resource access contribute to significant risks, reflected in multiple economic losses and human damages (Țîncu et al. Citation2020).
To assess hazard, vulnerability, and risk in the north-east region, databases containing natural hazard triggers and socio-economic variables were collected. Additionally, fieldwork was conducted to gather administrative data, landslide, and flood maps. The natural hazard assessment database is derived from a numerical terrain model extracted from Forest and Buildings removed Copernicus Digital Elevation Model (FABDEM) database at a resolution of 30 m, from which the elevation, slope, aspect, and drainage density were generated. Geological and pedological maps, scaled at 1:200.000 from the Geological Institute and the Institute of Pedological and Agrochemical Research, were digitized. This process generated thematic layers such as lithology, soil texture, and rock permeability. Land use information was extracted from the Copernicus database for 2018. Precipitation distribution was generated from the Romanian Climate Dataset (ROCADA) (Bîrsan and Dumitrescu Citation2014). The seismic hazard assessment was based on data from the European Facilities for Earthquake Hazard and Risk (EFEHR) platform and seismic design standards.
To evaluate social and economic vulnerability at the LAU level, data from the National Institute of Statistics (NIS) and the Ministry of Regional Development and Public Administration for 552 LAUs in 2020 were utilized. PCA was conducted using the Statistical Package for Social Sciences (SPSS) version 23 to produce the spatial distribution of social vulnerability. The results were overlaid onto the multi-hazard map to generate a composite risk index.
2.2. Methodology
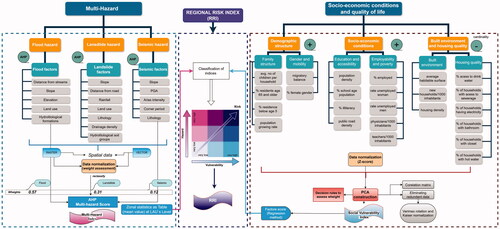
The proposed methodology includes three major steps in achieving the composite Regional Risk Index: the spatial distribution of natural hazards using multi-criteria methods, the determination of social vulnerability at the LAU level, and the mapping and assessment of the results obtained. The integrated methodology is outlined in and the detailed steps are explained in the following subsections.
Figure 2. Flowchart of the methodology.
2.3. Geospatial interaction of multi-hazard and socio-economic vulnerability
The application of the methodology will analyze the interactions between the distribution of natural hazards and socio-economic vulnerability by developing a Regional Risk Index (RRI) calculated at the LAU level.
The bivariate approach facilitates the identification of different levels of risk, with individual contributions derived from hazard and vulnerability (Mohanty et al. Citation2020).
Considering the bivariate matrix, this was realized based on the hazard and vulnerability components and expressed mathematically by Equationequation (1)(1)
(1) (Jibhakate et al. Citation2023):
(1)
(1)
where: RRI = {
∈
= (MHI, SoVI)}; ∀MHI ∈ hazard and SoVI ∈ vulnerability. where, m and n are the cardinality of MHI and SoVI, and * is a cartesian product of Hazard and Vulnerability. MHI is Multi-Hazar Index, SoVI is Social Vulnerability Index.
The graphical representation is a 3 × 3 diagram. Each multi-hazard class is combined with another social vulnerability class to identify all possible combinations of risk.
The quantitative relationship between these two components offers valuable information for the development of mitigation strategies and the identification of hotspots that should be prioritized for risk reduction measures.
The following subsections cover the application of the methodology in the selection of triggers, multi-hazard rating, and assessment of socio-economic vulnerability.
2.4. Hazard assessment
2.4.1. Factors influencing multi-hazards
The flood hazard assessment is based on the most affected region by floods being the north-eastern part of Romania, which overlaps the Siret and Prut River basins (Enea et al. Citation2024). Significant material, human and environmental damage has been recorded. Floods in the last decades (i.e. 2008, 2010, and 2020) have been the most important events since instrumental data became available (Ionita and Nagavciuc Citation2021).
A major problem in developing countries is the lack of adequate data for hydraulic modelling. Consequently, GIS-based MCDM methods are used to estimate exposed areas. Triggers are analyzed and included into the assessment.
Proximity to the river is considered a crucial factor, with the areas most affected being those in close proximity to rivers. According to the Strahler classification, buffers have been generated around streams. Order II and III buffer zones were created at 50, 100, 150, and 200 m, and order IV and V buffers were created at 100, 200, 300, 600, and 800 m (Chelariu et al. Citation2023). Other morphological parameters are influenced by altitude and slope. Consequently, areas with low slopes, and lower elevations, decrease runoff velocity and accelerate flooding.
Land use changes influence infiltration through artificial surfaces and lead to higher runoff. Natural vegetation cover (forests, orchards, pastures) reduces water velocity and increases water retention and infiltration capacity.
Hydro-lithological formations were classified according to the hydrogeological characteristics of the rocks, where the impermeable rock category was given the highest value because it affects the infiltration rate and favours the occurrence of floods (Chelariu et al. Citation2023).
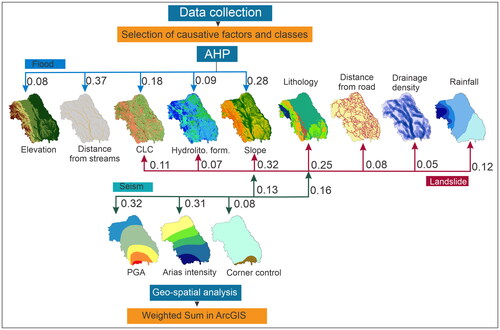
Since the factors do not have the same weight in the flood distribution, the AHP methodology was applied to determine the weights for each factor (), which were integrated into GIS environment.
Figure 3. AHP analysis for causative factors for natural hazards and weight assessment.
Landslide hazard assessment is based on several factors that interact and influence topographic surface dynamics. One of the most important factors is the slope of the terrain, where increasing slopes trigger landslides. For the study area, slopes between 20 and 30° are considered the most susceptible (Bălteanu et al. Citation2010).
Rainfall is considered one of the essential factors in triggering landslides, and slope instability is determined by lithological, pedological, and vegetation cover characteristics (Chitu et al. Citation2017). The analysis used the spatial distribution of annual average rainfall. Another parameter is the drainage network density, which can cause rapid runoff at the watershed surface, followed by soil saturation and landslide triggering or activation.
Hydrological soil groups are an essential component in the study of landslides due to soil texture characteristics. Thus, soils with high clay content form stable and landslide resistant aggregates. At the opposite pole are soils with high sand content or thick clays which are unstable and generate conditions favourable for landslides (Sharma et al. Citation2012).
In landslides, slope instability is directly related to land use, with areas covered by grassland, scrubland, and orchards being highly susceptible. (Gullà et al. Citation2021).
From a lithological point of view, the geotechnical properties and the geological formation genesis were considered. The geological factor presents a significant control in analyzing landslides and earthquakes (Pascariu et al. Citation2015). For these considerations, the deposits formed by friable sandstones, clays, siltstones, evaporite deposits, sandy clays, and argillaceous siltstones (Juravle et al. Citation2019) were given the maximum evaluation.
The construction of roads can generate mass movement and lead to slope instability (Lee and Pradhan Citation2006), especially in the plateau area where road density is also higher. Areas near roads were considered the most susceptible, receiving the highest score (class 0–100 m), with susceptibility decreasing with distance from roads.
The seismic hazard assessment is based on the following factors: peak ground acceleration (PGA), which represents the maximum value recorded in a given location (Ardeleanu et al. Citation2020) and Arias intensity (Ai), which is determined by the parameters of the most representative earthquakes in Romania. The seismic zonation of the Code P100-1/2013 (Citation2013) standard was integrated into the analysis of the study area. Another important factor is the slope instability, with slope values of more than 30° receiving the highest rating in the analysis.
2.4.2. Factor weighting with AHP methodology
For a coherent database analysis, each parameter was represented in five classes (1 very low; 5 very high); the assessment was based on the land’s susceptibility to the occurrence of natural hazards (Chelariu et al. Citation2023). Standardization was performed based on field studies, stakeholder discussions, and relevant literature.
The weights for each layer were determined using the AHP, which is an MCDM tool that involves pairwise comparison matrices for analysis (Saaty Citation1990). Comparative ratings are evaluated on a scale of 1 to 9, indicate the relative importance of each factor in comparison to others. Subsequently, the ratings provided by the expert judgments in the pairwise comparison matrices are validated. A Consistency Ratio (CR) value of 0.1 or less indicates the accuracy of the assessments (Shelar et al. Citation2023). The CR was calculated using the EquationEquation (2)(2)
(2) as follows:
(2)
(2)
where, RI is the random index whose value depends on the order of the matrix. And the following EquationEquation (3)
(3)
(3) was used to determine the Consistency Index (CI):
(3)
(3)
where: λmax – is the largest eigenvalue of the matrix; n – matrix size.
To generate the individual hazard maps, the weights obtained from the matrices were integrated into GIS environment (). Individual assessment of natural hazards was performed using the following linear combination EquationEquation (4)(4)
(4) :
(4)
(4)
where, IHI is the Individual Hazard Index, n is the total number of integrated factors, Ri is the rating of the factor i, and Wi is the weight of the factor i.
2.4.3. Multi-hazard assessment
To generate the multi-hazard map, a matrix with 3 variables represented by the individual natural hazards was developed to determine the corresponding weights. Subsequently, the Equationequation (5)(5)
(5) was applied to obtain the spatial distribution of multi-hazards:
(5)
(5)
where, MHI is Multi-Hazar Index, FHI is Flood Hazard Index, LHI is Landslide Hazard Index and EHI is Earthquake Hazard Index.
The maps obtained were classified into 5 susceptibility classes using the standard deviation method. Average values for each LAU were extracted from the thematic multi-hazard distribution using the Zonal Statistical tool from ArcGIS.
2.5. Social vulnerability assessment
In recent years, assessing social vulnerability from the perspective of natural hazards has become integral to management processes. It is embedded within policies and strategies aimed at identifying ways to reduce risk and enhance community resilience. Social vulnerability is a latent variable of a region that cannot be observed directly but can be assessed based on indicators that can influence communities’ susceptibility (Lloyd et al. Citation2022).
The social vulnerability index is determined by applying PCA using the relevant variables for the analysis. PCA is a statistical technique based on a matrix of related socio-economic variables and creates a new set of principal components in which important variations are extracted, reducing uncertainty and data redundancy (Cutter et al. Citation2003, Stafford and Abramowitz Citation2017). After selecting and collecting data for each community, values were normalized to produce a comparable dataset.
Due to the diversity of parameters used prior to the application of the PCA method, the data were standardized by applying the Z-score using the EquationEquation (6)(6)
(6) :
(6)
(6)
where: Xi is the value of the analyzed component,
is the mean of the data series Xi,j, and σ is the standard deviation of the data series Xi,j.
Varimax rotation has been used to simplify the structure of the underlying dimensions and produce more independence between factors (Mavhura et al. Citation2017). Varimax rotation minimizes the number of variables with high loadings on a single factor, increasing the percentage variance for each factor (Armaș and Gavriș Citation2013).
Two Kaiser-Meyer-Olkin (KMO) statistical tests of sampling adequacy and the Bartlett test of sphericity were conducted to check the robustness of the PCA method. Bartlett′s test verifies redundancy in variables, and if the variables used are adequate, then p ≤ 0.05 (Abson et al. Citation2012).
2.5.1. Vulnerability assessment indicators
The study used a database of 24 variables, including demographic structure characteristics, socio-economic indicators, and housing quality indicators.
Population and housing density indicate hazard exposure and pressure on the system’s response and recovery mode. In addition, territorial expansion in built-up areas is frequently located in vulnerable areas due to anthropogenic pressure (Rehman et al. Citation2019), and built-up (impermeable areas) affect the infiltration process and rainfall runoff.
Another critical factor in vulnerability analysis is the age of the population, which influences mobility in a disaster. Thus, vulnerable categories are children under five and the elderly. These categories of people are considered more vulnerable due to mobility constraints, post-disaster psychological stress, and the cognitive ability to process existing hazard information.
Another indicator included is the percentage of the female population, as they are considered to have more difficulties adapting and responding to disasters due to inequality and family care responsibilities (Ajtai et al. Citation2023).
Socio-economic status is an important indicator for measuring a region’s vulnerability. The share of employed and unemployed people influences the availability of financial resources and is related to the capacity to absorb losses.
Housing quality is analyzed in terms of the facilities provided to each household, including access to piped water, hot water, electricity, and buildings with bathrooms, toilets, and sewerage.
The infrastructure available is represented by the number of physicians per 1000 inhabitants and the number of beds in health institutions. These are how a region can respond to disaster regarding health services, thus disadvantaging rural communities.
Education is a socio-economic indicator dependent on employment opportunities and health. Lower levels of education limit the ability to understand hazard and warning information (Cutter et al. Citation2003). People with higher levels of education have access to information about associated risks, better employability prospects, and higher incomes. For the analysis of this parameter, the percentage of illiterate people, school-age population, and teachers/1000 inhabitants were included in the study.
Each component was named and assigned cardinality based on its impact in the final equation (+ increases vulnerability and - decreases vulnerability) (Aksha et al. Citation2020; Török et al. Citation2021). Factor loadings, represent correlations between factors and variables, and factor scores were obtained using the multiple regression method (Aroca-Jimenez et al. Citation2017).
2.5.2. Composite socio-economic vulnerability
The vulnerability index was developed by performing the PCA, which obtained six main components named after the variables that are parts of these components ().
Table 1. Main components and related variables on the development of social vulnerability.
The results were obtained by applying the PCA, which multiplied the regression factor score has been by the variance. The next step was to apply SoVI at the LAUlevel for the study area by applying the EquationEquation (7)(7)
(7) :
(7)
(7)
Social vulnerability ratings were classified into five vulnerability classes using the standard deviation method.
In order to assess the geographic variability of the results, the Global Moran′s I and Local Moran′s I test were applied (Armaș and Gavriș Citation2013). These methods perform autocorrelation calculations between LAUs and determine the patterns of statistical similarity.
3. Results
The multi-hazard analysis was conducted based on the premise that the region is exposed to multiple natural hazards, which can occur simultaneously or in cascades and have the potential to have a major impact on socio-economically vulnerable communities.
The bivariate risk assessment provides an integrated approach to visualize the individual contributions of natural hazards using the GIS-based MCDM method and the socio-economic vulnerability of systems using the PCA method. Hence, the results identify hotspot areas where both components present values corresponding to classes with major impacts on communities.
3.1. Spatial distribution of multi-hazard
The multi-hazard map for the North-East Region of Romania evaluates areas according to the susceptibility of the terrain to floods, landslides and earthquakes. The result was classified into five hazard classes using the standard deviation method.
Regarding flooding exposure, 3.23% of the area is classified as very high hazard, while 19.04% was considered high. These areas correspond to streams and their proximity (). The most representative percentage, 33%, belongs to the moderate flood hazard class, and 21.61% corresponds to the very low.
Figure 4. Spatial distribution of natural hazard susceptibility: a. floods, b. landslides and c. earthquakes.
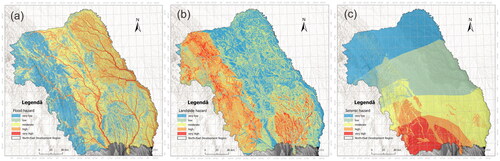
The low and very low flood susceptibility class presents a western distribution, overlapping the mountainous.
The flooding issues are relevant due to the longitudinal distribution of settlements along river network. Favourable relief conditions have led to their chaotic extension into the floodplain. During the last two decades, floods exceeding historical values have been recorded on numerous rivers, especially in the northeastern part of Romania (Stoleriu et al. Citation2020).
Concerning landslides, two areas can be identified: one overlaping the mountainous region, especially in the Subcarpathian area with a western distribution on Molasse deposits, and another in the central southern part, belonging to the Central Moldavian Plateau and the Tutova Hills (). The analysis revealed that 4.35% of the area has very high susceptibility, and 18.62% belongs to the high susceptibility class ().
Figure 5. The surface area of each hazard class (%).
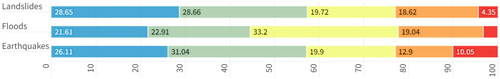
The south-eastern region is one of the most active seismogenic areas. The destructive character is significant, with areas of very high susceptibility representing 10% of the analyzed area, predominantly in the south-western part (). However, earthquakes are also considered significant triggers of landslides, influencing landscape evolution and causing substantial disruption to human activity (Micu et al. Citation2023).
The multi-hazard analysis allows the assessment of terrain susceptibility and can be considered an essential tool for territorial development planning. Hazard distribution maps where integrated into GIS environment and weighted using the AHP methodology (Bathrellos et al. Citation2017; Chelariu et al. Citation2023). Floods had the highest contribution (0.57%), followed by landslides (0.31%), and earthquakes.
The Multi-Hazard Index distribution indicates that the areas with very high and high susceptibility are distributed along the river network and represent 10.25% and 23.83% of the surface, respectively. According to these results, several critical locations are identified, which are localized in the contact zone between the mountainous and plateau areas, on the Moldavian Subcarpathian alignment and the confluence zone between the main rivers ().
Figure 6. Distribution of multi-hazard classes in northeastern Romania.
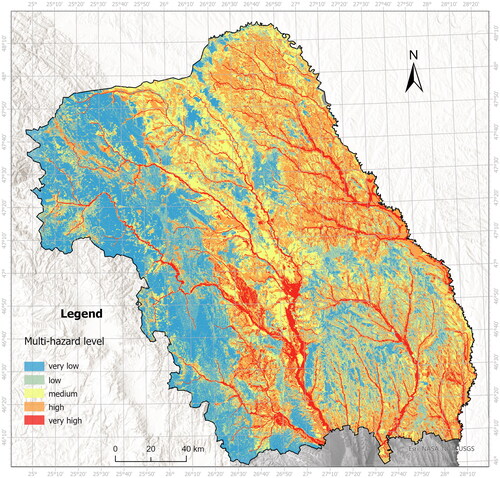
This area registered the most significant extreme hydrological events, especially on the Siret River and at its confluence with the main tributaries (Suceava, Moldova, and Bistrița). Additionally, as well as considerable landslides caused by molasse deposits, characterized by slope instability.
The results indicate that the eastern part of the region, largely overlapping with the Moldavian Plateau, presents a higher degree of susceptibility. Furthermore, areas with low elevations and slopes, which are more susceptible in terms of lithology, hydrography, vegetation cover, and land use, are more susceptible due to insufficient land improvement measures.
Regarding the analysis of the settlements, the class with a very high susceptibility covers a percentage of 20.62%, followed by the class with a high degree of 45.55%. Consequently, the vulnerability of social and economic systems increases significantly when natural hazards are analyzed simultaneously.
3.2. Socio-economic vulnerability assessment
The socio-economic vulnerability was assessed using the NIS database through the application of the PCA method. Statistical test results obtained in SPSS show that the KMO index contains values above 0.70 and a Bartlett sphericity test value of <0.01 is considered suitable for PCA analysis (). The category containing the variables on socio-economic conditions shows a total explained variance of 67.72%, the demographic structure 67.43%, and the category of variables on housing quality 91.32%. The results were integrated into GIS environment, and a spatial distribution at the LAU level comprised the principal components ().
Figure 7. Spatial distribution of principal component values at LAU level on: (a) socio-economic conditions; (b) demographic structure; (c) built environment.
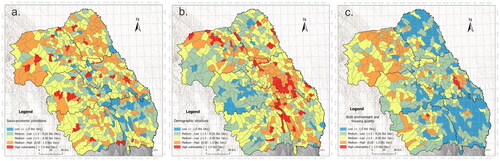
Regarding socio-economic factors, 4.16% of the LAUs are classified as high-vulnerability, with a random distribution within the territory ().
The PCA analysis divided demographic indicators into family structure/gender and mobility components. Thus, a high vulnerability is evidenced mainly in Iasi County, followed by Suceava and Vaslui counties, representing 7.97% of the total LAUs analyzed ().
Regarding built environment indicators, Valea Lupului and Miroslava stand out, but Suceava County exhibiting the highest pressure ().
The social vulnerability index reveals that counties in the eastern part of the region (Botoșani, Iași, and Vaslui) are more vulnerable. In the north-east region, 60 LAUs, representing 10.86% were identified as having high vulnerability. Additionally, 27.35% of the administrative units analyzed fall into the medium-high vulnerability category, mostly located in the eastern part of the region (). LAUs with SoVI values in the medium and low-medium vulnerability class (33.96% and 27.53%, respectively) are generally clustered in the western part of the region, overlapping the mountainous area and the contact zone.
Figure 8. Spatial distribution of the social vulnerability index (a) and associated clusters (b).
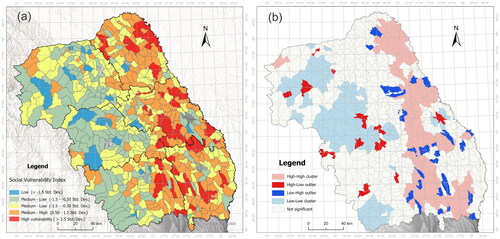
Global Moran′s I identified a positive autocorrelation with a value of 0.363 (p-value < .001) and a Z-score of 18.184, indicating significant spatial clustering.
According to the distribution of clusters within the North-East Development Region, two main clusters are identified (). The eastern counties are identified as having high vulnerability, with a significant cluster identified with a north-south distribution. The western part of the region is included in the low vulnerability class.
Thus, social vulnerability presents a gradient from west to east. This distribution is influenced by access to exploitable, economically usable subsoil resources, forestry, and agriculture in the West, where vulnerability shows low values. In the eastern part, the main economic activity is agriculture; thus, regional disparities have been identified, which are reflected in the degree of vulnerability.
3.3. Bivariate risk assessment
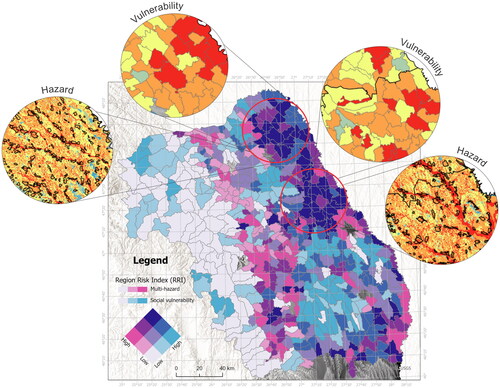
The dimensions of hazard and vulnerability (geophysical and socio-economic) are integrated within the Regional Risk Index (RRI) model. The bivariate choropleth approach reveals a critical correlation, where communities characterized by high multi-hazard but also high vulnerability values present a significant threat.
This double-scale representation facilitates the observation of areas with high vulnerability and significant exposure to natural hazards, indicating the prioritization in extreme event management strategies.
Thus, nine classes were derived by combining the two datasets. The risk analysis shows that 10.68% of the LAUs are in the high-high class and have a predominantly northeastern distribution (). Within these 3.44% show a random distribution in the territory. Notably, the LAUs in the southern part show mostly high socio-economic vulnerability and the contact zone is characterized by high hazard values.
Figure 9. Spatial distribution of the Regional risk index (RRI).
The results can support decision-makers, policymakers, and spatial planners in understanding patterns of vulnerability to multiple hazards and their comparative analysis. These results highlight the social inequalities of hazard-prone communities.
The high degree of vulnerability is caused by limited infrastructure, high dependence on agriculture, low institutional attention, limited access to development funding, and low preparedness and adaptation to potentially destructive events.
The socio-economic, historical, and cultural context has contributed to significant development disparities across Romania. In affluent rural areas, particularly in mountainous regions popular among tourists, the risk of natural hazards is relatively low. Conversely, in eastern regions, socioeconomic challenges are accentuated due to extensive land fragmentation and the decline in agricultural productivity. These factors have perpetuated economic and social underdevelopment in the affected areas (Mitrică et al. Citation2020). The high degree of rurality results in a reduced capacity to absorb funds for basic social infrastructure, which hinders economic development.
4. Discussion
Risk assessment and mapping is an essential step towards the efficient management of associated hazards in vulnerable areas. This approach is widely recognized as a non-structural measure to identify critical areas. It is a valuable tool for local governments, disaster management authorities, and citizens equally (Jibhakate et al. Citation2023).
Multi-criteria decision-making plays a critical role in the study of composite risk assessment indices incorporating social vulnerability to multi-hazards, which can inform decision-making processes. By integrating these components, risk can be anticipated, and actions can be prioritized at the local and regional administrative levels (Bucherie et al. Citation2022).
This study introduced a Regional Risk Index that emphasizes the impact of natural hazards on specific areas. The index reveals that disadvantaged communities are the most affected by natural hazards and possess limited adaptive capacity due to socio-economic vulnerability. The analysis includes integrating the hazards to which the area is exposed based on a several factors that favour the distribution within the territory. Thus, the results of flood hazard analysis indicate that proximity to the river and slope are the most important factors in flood prediction (). Therefore, areas with a low slope near rivers are the most susceptible and are often used as residential areas (Pourghasemi et al. Citation2020; Diriba et al. Citation2024). The study area is characterized by a distribution of settlements along the hydrological network (Chelariu et al. Citation2023).
Regarding landslides, the most important factors are slope, lithological conditions, rainfall, and land use. The occurrence of landslides increases with slope and is influenced by soil texture characteristics, which favour landslides (Sharma et al. Citation2012). These characteristics are increased by precipitation, as saturated soils reduce slope stability (Ullah et al. Citation2022).
In earthquake mapping, the significant contribution of Ai, PGA (ground motion parameters as a relation to distance from the source), and lithology factors that control slopes are revealed.
In the socio-economic analysis, the highest factor loadings from PCA were attributed to age indicators (percentage of population over 65 and under 5) and the female population. These indicators may directly influence community vulnerability in terms of resilience and adaptive capacity (Lloyd et al. Citation2022). The significant share attributed to the unemployed population, both female and male, is also observed. Thus, vulnerable communities are characterized by low resilience and a high rate of vulnerable groups that may be affected to an even higher extent. The high-dimensional nature of the SoVI index in integrating different variables across time and space presents challenges in empirically validating the results (Blackwood and Cutter Citation2023). This complexity affects mitigation measures and community responses, particularly for low-income households, renters, minorities, and other disadvantaged groups, who often receive inequitable social assistance (Tate et al. Citation2021). Under this context, multi-hazard exacerbates pre-existing vulnerabilities and social inequalities, such as poverty, inadequate infrastructure and limited access to resources (Zhang et al. Citation2023). Furthermore, financial subsidies frequently favour urban areas over rural ones and create favour urban areas over rural ones (Elliott et al. Citation2020) and create significant disparities in the management of crisis situations generated by the manifestation of extreme natural phenomena.
Adopting an egalitarian approach to addressing disparities in social vulnerability is crucial for effective natural risk management. This approach emphasizes reducing vulnerability and implementing publicly funded risk management strategies for disadvantaged communities (Thaler and Hartmann Citation2016).
The study develops a compressive framework for quantifying the interaction between multi-hazard and socio-economic vulnerability, hence risk distribution. The present study proposes an RRI where multiple hazards are intersected with vulnerability based on bivariate representation using a unique 3 × 3 choropleth.
The methodology was applied to the North-East Development Region, being considered the poorest region in Romania according to GDP and the fifth poorest region in the European Union (Mihăilă et al. Citation2019). The areas located in the north-east recorded high and very high values of the Social Disadvantage Index, being considered the most disadvantaged area in terms of analysis of the social level of development with economic performance and poverty (Mitrică et al. Citation2020). In addition to a very high social vulnerability, the region is affected by extreme phenomena related in particular to floods and landslides.
The north-east region requires actions to be implemented with the support of local government on increasing living standards, access to basic services and cooperation. Composite risk estimation and mapping is a principal stage in developing a comprehensive crisis management strategy for a region. A risk map could serve as an essential tool, both for the general public and for experts or decision-makers on the implementation of non-structural measures, as well as structural measures (Deroliya et al. Citation2022).
A significant advantage, of applying this index is the ability to develop profiles of vulnerable communities based on their predominant characteristics, facilitating targeted risk mitigation, disaster response, and recovery planning.
The study has some limitations due to the restricted availability of datasets, which may affect the accuracy of the results. Additionally, outdated data that do not fully reflect the current situation are often available only at the LAU level. Another area for improvement is the use of small-scale geological and pedological maps that do not allow a full assessment of natural features that may amplify or reduce the risk of landslides and earthquakes and have not been available for recent periods. The cascading effects of hazards have also not been fully considered due to these limitations. Long-term data on the magnitude and intensity of hazards are necessary for such analyses.
The results are highly relevant regarding the territorial expansion of settlements in the region in recent decades. They identify areas of major vulnerability that require targeted measures for emergency management.
Empirical studies are essential because they provide a situational understanding of the causes of social vulnerability (Rufat et al. Citation2015), identify potential inequalities in flood-affected rural areas, and explain how disaster planning can be conducted.
5. Conclusions
The study quantified the risk components of multi-hazard (floods, landslides, and earthquakes) and vulnerability through a bivariate representation exemplified by the Regional Risk Index. An innovative aspect of this study is the multiple hazards analysis, which incorporates 12 representative trigger factors. Additionally, the integration of 24 relevant socio-economic indicators at the lowest administrative level facilitated the development of a risk classifier utilizing a bivariate choropleth approach. This methodology employs a 3 × 3 matrix to represent hazard and vulnerability, thereby identifying the level of risk.
A compressive characterization of an area regarding socio-economic vulnerabilities and natural hazards allows a prediction of the spatial characteristics of multiple hazard events. The result helps to identify the socio-economic inequality of the population exposed to hazards.
The study results highlight that, in terms of multiple hazard distribution, 10.25% of the area exhibits a high susceptibility to extreme events. This assessment applied the AHP methodology in order to determine the weights of the factors integrated in the analysis. The second component of risk, socio-economic vulnerability, was obtained by considering a set of 24 variables using the PCA method through which the main components were identified. Thus, from this perspective, 10.86% of the analyzed localities show a high degree of vulnerability, which is mainly distributed in the eastern counties. The risk map derived from the intersection of hazard and vulnerability results was produced using the bivariate approach. In this way, communities have been identified, and the influence of hazards, vulnerability, or both factors can be observed. LAUs showing high-high risk values represent 10.68% and 7.24% clustered in the northeastern part of the region.
The methodology can be extremely useful for identifying hotspots that are characterized by areas of high hazard, high exposure and vulnerability and low resilience. This tool is essential for developing countries because the result can contribute to managing destructive impacts on vulnerable communities through a participatory policy mechanism and technical and financial support systems.
The results can assist decision-makers in understanding the overall risk to which a region is exposed and in implementing more effective solutions targeted at communities facing the highest risk. This result can raise awareness and support the development of policies and disaster risk management that focus on vulnerable areas.
Data availability statement
The data that support the findings of this study are available upon request.
Disclosure statement
No potential conflict of interest was reported by the author(s).
Additional information
Funding
References
- Abson DJ, Dougill AJ, Stringer LC. 2012. Using principal component analysis for information-rich socio-ecological vulnerability mapping in Southern Africa. Appl Geogr. 35(1-2):515–524. doi: 10.1016/j.apgeog.2012.08.004.
- Abdi H, Williams LJ. 2010. Principal component analysis. Wiley Interdiscip Rev Comput Stat. 2(4):433–459. doi: 10.1002/wics.101.
- Ajtai I, Ștefănie H, Maloș C, Botezan C, Radovici A, Bizău-Cârstea M, Baciu C. 2023. Mapping social vulnerability to floods. A comprehensive framework using a vulnerability index approach and PCA analysis. Ecol Indic. 154:110838. doi: 10.1016/j.ecolind.2023.110838.
- Aksha SK, Resler LM, Juran L, Carstensen Jr LW. 2020. A geospatial analysis of multi-hazard risk in Dharan, Nepal. Geomatics, Nat Hazards Risk. 11(1):88–111. doi: 10.1080/19475705.2019.1710580.
- Ardeleanu L, Neagoe C, Ionescu C. 2020. Empirical relationships between macroseimic intensity and instrumental ground motion parameters for the intermediate-depth earthquakes of Vrancea region, Romania. Nat Hazards. 103(2):2021–2043. doi: 10.1007/s11069-020-04070-0.
- Armaș I, Gavriș A. 2013. Social vulnerability assessment using spatial multi-criteria analysis (SEVI model) and the social vulnerability index (SoVI model) – a case study for Bucharest, Romania. Nat Hazards Earth Syst Sci. 13(6):1481–1499. doi: 10.5194/nhess-13-1481-2013.
- Aroca-Jimenez E, Bodoque JM, Garcia JA, Diez-Herrero A. 2017. Construction of an integrated social vulnerability index in urban areas prone to flash flooding. Nat Hazards Earth Syst Sci. 17(9):1541–1557. doi: 10.5194/nhess.
- Bălteanu D, Chendeş V, Sima M, Enciu P. 2010. A country-wide spatial assessment of landslide susceptibility in Romania. Geomorphology. 124(3-4):102–112. doi: 10.1016/j.geomorph.2010.03.005.
- Bălteanu D, Micu M, Jurchescu M, Malet J-P, Sima M, Kucsicsa G, Dumitrică C, Petrea D, Mărgărint MC, Bilaşco Ş, et al. 2020. National-scale landslide susceptibility map of Romania in a European methodological framework. Geomorphology. 371:107432. doi: 10.1016/j.geomorph.2020.107432.
- Bănică A, Muntele I. 2015. Urban vulnerability and resilience in post-communist Romania (Comparative case studies of Iași and Bacău cities and metropolitan areas). Carpath J Earth Environ Sci. 10(4):159–171.
- Bathrellos GD, Gaki-Papanastassiou K, Skilodimou HD, Papanastassiou D, Chousianitis KG. 2012. Potential suitability for urban planning and industry development using natural hazard maps and geological–geomorphological parameters. Environ Earth Sci. 66(2):537–548. doi: 10.1007/s12665-011-1263-x.
- Bathrellos GD, Skilodimou HD, Chousianitis K, Youssef AM, Pradhan B. 2017. Suitability estimation for urban development using multi-hazard assessment map. Sci Total Environ. 575:119–134. doi: 10.1016/j.scitotenv.2016.10.025.
- Bîrsan MV, Dumitrescu A. 2014. ROCADA: Romanian daily gridded climatic dataset (1961–2013) V1.0. Bucharest, Romania: Meteorology National Administration.
- Blackwood L, Cutter SL. 2023. The application of the social vulnerability index (SoVI) for geo-targeting of post-disaster recovery resources. Int J Disaster Risk Reduct. 92:103722. doi: 10.1016/j.ijdrr.2023.103722.
- Botezan CS, Radovici A, Ajtai I. 2021. The challenge of social vulnerability assessment in the context of land use changes for sustainable urban planning—case studies: developing cities in Romania. Land. 11(1):17. doi: 10.3390/land11010017.
- Bucherie A, Hultquist C, Adamo S, Neely C, Ayala F, Bazo J, Kruczkiewicz A. 2022. A comparison of social vulnerability indices specific to flooding in Ecuador: principal component analysis (PCA) and expert knowledge. Int J Disaster Risk Reduct. 73:102897. doi: 10.1016/j.ijdrr.2022.102897.
- Chelariu OE, Iațu C, Tomașciuc AI, Minea I, Chelariu C. 2019. Flood assessment based on multi-criteria analysis in Moldova region and the impact on territorial development. 19th SGEM International Multidisciplinary Scientific GeoConference EXPO Proceedings. p. 193–200. doi: 10.5593/sgem2019/3.1/S12.025.
- Chelariu OE, Minea I, Iațu C. 2023. Geo-hazards assessment and land suitability estimation for spatial planning using multi-criteria analysis. Heliyon. 9(7):e18159. doi: 10.1016/j.heliyon.2023.e18159.
- Chitu Z, Bogaard T, Busuioc A, Burcea S, Sandric I, Adler M-J. 2017. Identifying hydrological pre-conditions and rainfall triggers of slope failures at catchment scale for 2014 storm events in the Ialomita Subcarpathians, Romania. Landslides. 14(1):419–434. doi: 10.1007/s10346-016-0740-4.
- Code P100-1/2013. 2013. Seismic Design Code—Part I—Provisions for the Design of Buildings. Indicative P100-1 (In Romanian) Elaborated by UTCB, Endorsed by MDRAP; Part I, n. 558 of 03. 09. 2013; Bucharest, Romania: Official Journal of Romania.
- Cutter SL, Boruff BJ, Shirley WL. 2003. Social vulnerability to environmental hazards. Soc Sci Q. 84(2):242–261. doi: 10.1111/1540-6237.8402002.
- Cutter SL, Finch C. 2008. Temporal and spatial changes in social vulnerability to natural hazards. Proc Natl Acad Sci U S A. 105(7):2301–2306. doi: 10.1073/pnas.0710375105.
- Deroliya P, Ghosh M, Mohanty MP, Ghosh S, Rao KD, Karmakar S. 2022. A novel flood risk mapping approach with machine learning considering geomorphic and socio-economic vulnerability dimensions. Sci Total Environ. 851(Pt 1):158002. doi: 10.1016/j.scitotenv.2022.158002.
- Diriba D, Takele T, Karuppannan S, Husein M. 2024. Flood hazard analysis and risk assessment using remote sensing, GIS, and AHP techniques: a case study of the Gidabo Watershed, main Ethiopian Rift, Ethiopia. Geomatics, Nat. Hazards Risk. 15(1):2361813.
- Drakes O, Tate E. 2022. Social vulnerability in a multi-hazard context: a systematic review. Environ Res Lett. 17(3):033001. doi: 10.1088/1748-9326/ac5140.
- Elliott JR, Brown PL, Loughran K. 2020. Racial inequities in the federal buyout of flood-prone homes: a nationwide assessment of environmental adaptation. Socius. 6:237802312090543. doi: 10.1177/2378023120905439.
- Enea A, Stoleriu CC, Iosub M, Niacsu L. 2024. A GIS automated tool for morphometric flood analysis based on the Horton–Strahler river classification system. Water. 16(4):536. doi: 10.3390/w16040536.
- EURES. 2023. Labour market information: Romania. [accessed 2024 June 25]. https://eures.europa.eu/living-and-working/labour-market-information/labour-marketinformation-romania_ro
- Gautam D, Thapa S, Pokhrel S, Lamichhane S. 2021. Local level multi-hazard zonation of Nepal. Geomat Nat Hazards Risk. 12(1):405–423. doi: 10.1080/19475705.2021.1879941.
- Gullà G, Conforti M, Borrelli L. 2021. A refinement analysis of the shallow landslides susceptibility at regional scale supported by GIS-aided geo-database. Geomat Nat Hazards Risk. 12(1):2500–2543. a. doi: 10.1080/19475705.2021.1967204.
- Horea-Șerban R, Fîrțală G. 2022. Demographic ageing vulnerabilities in the North-East Region of Romania. Present Environ Sustain Dev. 2(2):173–182. doi: 10.47743/pesd2022162013.
- Ionita M, Nagavciuc V. 2021. Changes in drought features at the European level over the last 120 years. Nat Hazards Earth Syst Sci. 21:1685–1701. doi: 10.5194/nhess-21-1685-2021.
- Iosub M, Minea I, Chelariu OE, Ursu A. 2020. Assessment of flash flood susceptibility potential in Moldavian Plain (Romania). J Flood Risk Manag. 13(4):e12588. doi: 10.1111/jfr3.12588.
- IPCC. 2021. Summary for policymakers. In Masson-Delmotte V. Zhai P. Pirani A. Connors SL. Péan C. Berger S. et al., editors. Climate change 2021: the physical science basis. Contribution of working group I to the sixth assessment report of the intergovernmental panel on climate change. Cambridge University Press.
- Jibhakate SM, Timbadiya PV, Patel PL. 2023. Multiparameter flood hazard, socioeconomic vulnerability and flood risk assessment for densely populated coastal city. J Environ Manag. 344:118405. doi: 10.1016/j.jenvman.2023.118405.
- Johnson K, Depietri Y, Breil M. 2016. Multi-hazard risk assessment of two Hong Kong districts. Int J Disaster Risk Reduct. 19:311–323. doi: 10.1016/j.ijdrr.2016.08.023.
- Juravle DT, Ursu A, Chelariu C, Juravle V. 2019. Distribution of Cretacic/Miocene petrofacies at the contact of the Carpathian Orogene and Moldavian Platform. Morphometric particularities of the mountain-plateau relief transition, between Suceava and Moldova valley (Obcina Mare/Suceava Plateau, Romania). 19th SGEM International Multidisciplinary Scientific GeoConference EXPO Proceedings; p. 147–161. doi: 10.5593/sgem2019/1.1/S01.019.
- Kappes MS, Keiler M, von Elverfeldt K, Glade T. 2012. Challenges of analyzing multi-hazard risk: a review. Nat Hazards. 64(2):1925–1958. doi: 10.1007/s11069-012-0294-2.
- Lee S, Pradhan B. 2006. Probabilistic landslide hazards and risk mapping on Penang Island, Malaysia. J Earth Syst Sci. 115(6):661–672. doi: 10.1007/s12040-006-0004-0.
- Lloyd S, Gray J, Healey S, Opdyke A. 2022. Social vulnerability to natural hazards in the Philippines. Int J Disaster Risk Reduc. 79:103103. doi: 10.1016/j.ijdrr.2022.103103.
- Lyu HM, Yin ZY. 2023. An improved MCDM combined with GIS for risk assessment of multi-hazards in Hong Kong. Sustain Cities Soc. 91:104427. doi: 10.1016/j.scs.2023.104427.
- Malczewski J. 2006. GIS‐based multicriteria decision analysis: a survey of the literature. Int J Geogr Inf Sci. 20(7):703–726. doi: 10.1080/13658810600661508.
- Mărgărint MC, Niculiţă M. 2017. Landslide type and pattern in Moldavian Plateau, NE Romania. In: Rădoane M, Vespremeanu–Stroe A, editors. Landform dynamics and evolution in Romania. Cham: Springer Geography; p. 271–304. doi: 10.1007/978-3-319-32589-7_12.
- Mavhura E, Manyena B, Collins AE. 2017. An approach for measuring social vulnerability in context: the case of flood hazards in Muzarabani district, Zimbabwe. Geoforum. 86:103–117. doi: 10.1016/j.geoforum.2017.09.008.
- Micu M, Micu D, Havenith HB. 2023. Earthquake-induced landslide hazard assessment in the Vrancea Seismic Region (Eastern Carpathians, Romania): constraints and perspectives. Geomorphology. 427:108635. doi: 10.1016/j.geomorph.2023.108635.
- Mihăilă D, Bistricean PI, Briciu AE. 2019. Assessment of the climate potential for tourism. Case study: the North-East development region of Romania. Theor Appl Climatol. 137(1-2):601–622. doi: 10.1007/s00704-018-2611-5.
- Mitrică B, Şerban P, Mocanu I, Grigorescu I, Damian N, Dumitraşcu M. 2020. Social development and regional disparities in the rural areas of Romania: focus on the social disadvantaged areas. Soc Indic Res. 152(1):67–89. doi: 10.1007/s11205-020-02415-7.
- Mohanty MP, Vittal H, Yadav V, Ghosh S, Rao GS, Karmakar S. 2020. A new bivariate risk classifier for flood management considering hazard and socioeconomic dimensions. J Environ Manage. 255:109733. doi: 10.1016/j.jenvman.2019.109733.
- Pascariu F, Negru C, Şaramet MR, Chelariu C. 2015. Invasive vs. non-invasive methods in estimating slope stability, with application in the Copou Area, Iaşi, Romania. Acta Phys Pol A. 128(2B):B-193–B-197. doi: 10.12693/APhysPolA.128.B-193.
- Patriche CV, Pirnau R, Grozavu A, Rosca B. 2016. A comparative analysis of binary logistic regression and analytical hierarchy process for landslide susceptibility assessment in the Dobrov River Basin, Romania. Pedosphere. 26(3):335–350. doi: 10.1016/S1002-0160(15)60047-9.
- Pourghasemi HR, Gayen A, Edalat M, Zarafshar M, Tiefenbacher JP. 2020. Is multi-hazard mapping effective in assessing natural hazards and integrated watershed management? Geosci. Front. 11(4):1203–1217. doi: 10.1016/j.gsf.2019.10.008.
- Rehman S, Sahana M, Hong H, Sajjad H, Ahmed BB. 2019. A systematic review on approaches and methods used for flood vulnerability assessment: framework for future research. Nat Hazards. 96(2):975–998. doi: 10.1007/s11069-018-03567-z.
- Romanescu G, Hapciuc OE, Minea I, Iosub M. 2018. Flood vulnerability assessment in the mountain-plateau transition zone. Case study for Marginea village (Romania). J Flood Risk Manag. 11(S1):S502–S513. doi: 10.1111/jfr3.12249.
- Rufat S, Tate E, Burton CG, Maroof AS. 2015. Social vulnerability to floods: review of case studies and implications for measurement. Int J Disaster Risk Reduct. 14:470–486. doi: 10.1016/j.ijdrr.2015.09.013.
- Saaty TL. 1990. The analytic hierarchy process. New York: mcGraw Hill. International, Translated to Russian, Portuguese, and Chinese, Revised editions, Paperback (1996, 2000). Pittsburgh: RWS Publications.
- Sandu I, Pescaru VI, Poiana I. 2008. Clime of Romania. Bucharest: Romanian Academy Press.
- Sharma LP, Patel N, Debnath P, Ghose MK. 2012. Assessing landslide vulnerability from soil characteristics—A GIS-based analysis. Arab J Geosci. 5(4):789–796. doi: 10.1007/s12517-010-0272-5.
- Shelar RS, Nandgude SB, Pande CB, Costache R, El-Hiti GA, Tolche AD, Son CT, Yadav KK. 2023. Unlocking the hidden potential: groundwater zone mapping using AHP, remote sensing and GIS techniques. Geomat Nat Hazards Risk. 14(1):2264458.
- Skilodimou HD, Bathrellos GD, Chousianitis K, Youssef AM, Pradhan B. 2019. Multi-hazard assessment modeling via multi-criteria analysis and GIS: a case study. Environ Earth Sci. 78(2):1–21. doi: 10.1007/s12665-018-8003-4.
- Stafford S, Abramowitz J. 2017. An analysis of methods for identifying social vulnerability to climate change and sea level rise: a case study of Hampton Roads, Virginia. Nat Hazards. 85(2):1089–1117. doi: 10.1007/s11069-016-2622-4.
- Stillwell HD. 1992. Natural hazards and disasters in Latin America. Nat Hazards. 6(2):131–159. doi: 10.1007/BF00124620.
- Stoleriu CC, Urzica A, Mihu‐Pintilie A. 2020. Improving flood risk map accuracy using high‐density LiDAR data and the HEC‐RAS river analysis system: a case study from north‐eastern Romania. J Flood Risk Management. 13(S1):e12572. doi: 10.1111/jfr3.12572.
- Tate E, Rahman MA, Emrich CT, Sampson CC. 2021. Flood exposure and social vulnerability in the United States. Nat Hazards. 106(1):435–457. doi: 10.1007/s11069-020-04470.
- Teșliuc E, Grigoraș V, Stănculescu MS, Sandu D. 2015. Atlas of marginalized rural areas. Bucharest: World Bank.
- Thaler T, Hartmann T. 2016. Justice and flood risk management: reflecting on different approaches to distribute and allocate flood risk management in Europe. Nat Hazards. 83(1):129–147. doi: 10.1007/s11069-016-2305-1.
- Țîncu R, Zêzere JL, Crăciun I, Lazăr G, Lazăr I. 2020. Quantitative micro-scale flood risk assessment in a section of the Trotuș River, Romania. Land Use Policy. 95:103881. doi: 10.1016/j.landusepol.2019.02.040.
- Török I, Croitoru AE, Man TC. 2021. Assessing the impact of extreme temperature conditions on social vulnerability. Sustainability. 13(15):8510. doi: 10.3390/su13158510.
- Ullah K, Wang Y, Fang Z, Wang L, Rahman M. 2022. Multi-hazard susceptibility mapping based on convolutional neural networks. Geosci. Front. 13(5):101425. doi: 10.1016/j.gsf.2022.101425.
- Wang Y, Gardoni P, Murphy C, Guerrier S. 2021. Empirical predictive modeling approach to quantifying social vulnerability to natural hazards. Ann Assoc Am Geogr. 111(5):1559–1583. doi: 10.1080/24694452.2020.1823807.
- Wisner B, Blaikie P, Cannon T, Davis I. 2004. At risk: natural hazards, people’s vulnerability and disasters. London: Routledge.
- Zhang T, Wang D, Lu Y. 2023. Machine learning-enabled regional multi-hazards risk assessment considering social vulnerability. Sci Rep. 13(1):13405. doi: 10.1038/s41598-023-40159-9.