
ABSTRACT
The importance of data quality assessment has significantly increased with the boom of information technology and the growing demand for remote sensing (RS) data. The Remote Sensing Data Quality Working Group of the International Society for Photogrammetry and Remote Sensing aimed to conduct an investigation on the principles of data quality. Literature review revealed that most publications introduce data quality models for application specific processing chains and quality schemes are built case by case with particular domain indicators only. Yet no general concept independent from applications has been developed so far. This paper focuses on the formulation of a RS quality concept adopted from information technology domain describing a triangular RS data quality scheme that relates data sources, quality dimensions and lifecycle phases. Following the introduction it provides examples of international standards and fundamentals of theoretic quality modelling. After a short overview on platforms/sensors, definitions of different quality dimensions are presented with their metrics organised in clusters (like resolution or accuracy). The main achievement of the paper relates lifecycle phases to different quality dimensions of high relevance. The objective is not only to address experts of RS but to raise awareness of uncertainty for the general RS user community.
1. Introduction
In the early age of topographic, cadastre, military and environment application users agreed that RS technology is a highly efficient method for environmental monitoring and analyses. From the beginning, experts studied the direct and indirect influences of RS data uncertainty on the reliability of spatial analysis and decision support (Chrisman Citation1984, Citation1987). Gradually, the complexity of the issue has increased with emerging technology enabling a growing group of users less aware of spatial data quality. In the traditional fields of geodesy and surveying (Mueller Citation1964, Leick and Emmons Citation1994), cadastre (Jakobsson and Giversen Citation2007), photogrammetry (Konecny and Lehmann Citation1984, Krauss Citation1994, Jacobsen Citation2006, Kresse Citation2010), cartography (Chrisman Citation1982), RS (Di and Kobler Citation2000) and geography (Goodchild and Gopal Citation1989) expert users have developed data quality indicators. With the development of Geographic Information Systems (GIS) and the rapidly growing availability of the RS data, the importance of the data quality issue has sharply increased (Goodchild and Gopal Citation1989, Salgé Citation1995, Veregin and Hargitai Citation1995, Veregin Citation1999). The widespread and extensive use of RS data is a beneficial progress, but also increases the risk of incorrect usage. Goodchild concluded similarly from his study of the growing GIS community in 1989: ‘GIS is its own worst enemy: by inviting people to find new uses for data, it also invites them to be irresponsible in their use’ (Goodchild and Gopal Citation1989).
In the past decades, RS data quality has become a major issue of Earth Observation (EO) (Lecomte Citation2010) and geomatics (Kresse and Fadaie Citation2004). The closed community of sophisticated RS professionals, like members of academic, governmental or industrial stakeholders have opened up to a wider group of non-expert end-user community. The introduction of high-resolution satellites resources on commercial bases and the public, open-source access to several RS resources have driven these accelerated developments. The exponential increase in the availability of data sources and user community has caused an intense decrease in the sophisticated understanding of RS technology and its quality indicators. In many cases, users assume that the only important RS data quality measure is geometric accuracy just like in the domain of cartography or geodesy. In limited cases where thematic mapping is involved, classification quality is additionally considered. But no comprehensive quality evaluation procedure is carried out in uncertainty assessment.
Today, heterogeneous applications flourished with data quality estimation models mostly developed for a given RS data source or for a processing chain applied in a specific RS area. As a result, in RS communities various and conceptually different approaches have been developed to manage data quality (Zhang et al. Citation2018b, Moon et al. Citation2019, Liu et al. Citation2019). Up to now the uncertainties in the RS domain have raised a challenging task with no single global solution. Several methods try to answer the urging question: how good is the RS data set or product?
Moreover, the exceptionally diverse set of solutions existing in the scientific literature are also partially caused by the fact the user community of RS is very diverse. Different users reflect a fundamentally different understanding of the subject. To draw a typical example, governmental agencies working with large EO datasets try to understand their most relevant user requirements and develop an official RS data quality scheme that mostly reflects the agency’s requirements (Barsi et al. Citation2018). Other key leaders like space agencies from the sensor’s side are focusing on the verification, calibration and documentation of uncertainties in data acquisition and processing chain (Masek et al. Citation2013). Data providers are delivering RS data quality information to users by standardised quality models (Sampaio et al. Citation2010). Even if these quality measures are delivered to the end-users, often they are misused or ignored due to the lack of technical and theoretical. As a result, heterogeneous RS data sets with precise uncertainty measures provided by the producer often result in false assumptions of the end-users supposing that data are error-free. Based on this, in general, a single global RS quality model is impossible to determine by exact and simple definitions from the user’s perspective, since requirements vary across diverse user groups and application domains. End users look for a solution to evaluate their data set as ‘fitness for use’ for their certain application domain, but up to now, there is no global, general solution (Oort Citation2005). Consequently, there are heterogeneous RS data and application-specific quality models from the perspective of the diverse user community (see section 2.2), but so far there is no comprehensive, uniform, systematic approach for data quality model in RS.
Therefore, the ISPRS has launched an international working group called Remote Sensing Data Quality (ISPRS ICWG III/IVb) to conduct an extensive investigation to develop a non-application specific, general RS data quality model. It follows the same strategic objectives as similar initiatives from IEEE, CEOS and GEO, e.g. with the Quality Assurance Framework for Earth Observation (QA4EO). Their mission is to enhance trust in Earth Observation (EO) derived information and to prevent wrong decisions based on EO-derived information by ensuring proper usage of EO data through the entire information production process.
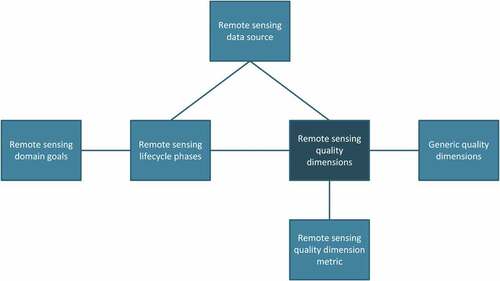
Based on the prior papers of the working group (Batini et al. Citation2017, Albrecht et al. Citation2018, Barsi et al. Citation2018, Kugler et al. Citation2018) this paper aims at giving a brief overview of existing data quality schemes described by standards. Followed by the establishment of a quality model scheme for RS domain based on Batini’s concept for information technology domain (Batini and Scannapieco Citation2016). Batini’s scheme is based on the close relation between quality dimensions, data sources related to lifecycle phases of RS (). The relationship of the three pillars of the quality scheme is that a great variety of data sources are used in different phases of the RS lifecycle. Both the lifecycle phases and the data sources are relevant for RS quality dimensions. Quality dimension metrics are represented by suitable metrics. These three elements of the scheme essentially depend on the application domain. illustrates the concept of data quality model introduced in this paper.
Figure 1. Concept of RS quality scheme adopted from information technology domain (Batini and Scannapieco Citation2016).
Yet we have to emphasise that no comprehensive data quality system can be developed due to the fact that it is a particularly complex area with no global solution. Its complexity is demonstrated by the aspect that for well-defined features, uncertainty can be considered as errors in the measurement process, for which statistical methods can be used to quantify uncertainty. However, for poorly defined features, uncertainty may be caused by vagueness or ambiguity of the features (Fisher Citation1999, Oort Citation2005). The different types of uncertainty estimations are based on the observed, measured and processed object classes that can be either Well Defined Object (Error, Probability), or Poorly Defined Objects (Vagueness- Fuzzy Set Theory, Ambiguity, Discord, Non-Specificity-Fuzzy Set Theory) (Fisher et al. Citation2006, Shekhar and Xiong Citation2008).
The quality model in this paper is a methodology that can assist the general user community to develop an understanding of the issue related to RS quality. Unlike the application or data-oriented models found in literature, this methodology defines generalised aspects of data quality in RS domain.
For this reason, the next section is starting with a brief introduction on the theoretical modelling background of data quality. Then, it introduces and describes the elements of the developed RS data quality scheme from , starting with the systematic review of data sources, quality dimensions and its metrics. The following section discusses lifecycle phases of RS in general, relating them to relevant quality dimensions.
Previous publication of the authors covered case studies of RS data quality (Albrecht et al. Citation2018, Barsi et al. Citation2018), while the current paper aims at giving a general scheme of RS data quality. It is a primary elaboration of a data quality propagation theory, which covers obviously the whole perspective to cover from data acquisition to end-user’s requirements.
2. Standards for data quality in remote sensing
The discovery, access, exchange and sharing of RS information and services among stakeholders from various levels in the spatial data user community are facilitated through an Earth Observation (EO) ecosystem. For this reason, standards are a key for the quality and development of interoperable RS information and geospatial software. Standardisation bodies aim at establishing a structured set of standards for information concerning objects or phenomena that are directly or indirectly associated with a location relative to the Earth. More specifically, it covers semantic, syntactic and service issues, as well as procedural and quality standards at various levels of abstraction.
In the last decade, the standardisation for spatial information data quality has developed rapidly. After the standardisation for the vector domain had reached maturity some organisations for standardisation focused their activities on image data and gridded data. The major organisations involved are the ISO/TC 211 ‘Geographic information/Geomatics’ which publishes the official standards, the Open Geospatial Consortium (OGC), which publishes industry standards, as well as the Quality Assurance Framework for Earth Observation (QA4EO) which publishes best practice guidelines (Kresse and Fadaie Citation2004, Kresse Citation2010).
2.1. The data quality standardisation bodies and relevant standards
The Quality Assurance Framework for Earth Observation (QA4EO) compiled by the Group on Earth Observation (GEO) and CEOS contributed to validation and overarching ideas (Lecomte Citation2010). The QA4EO initiative has produced a number of guidelines that have been adopted as Global Earth Observation System of Systems (GEOSS) best practice documents. The key principle of QA4EO is that all data and derived products must have associated with them a Quality Indicator (QI), which must be unequivocal and universal in terms of its definition and derivation based on a statistically derived value. This value should be the result of an assessment of its traceability to an agreed reference standard as propagated through the data processing chain. Quality indicators may be entirely objectively derived by measurement and calculation or, if necessary, may be elicited by subjective expert judgement, but the data provider must specify how the quality indicator was derived. The scientific literature suggest that quality indicators can inform users of a global measure of quality without them having to examine the data in detail.
The most relevant standardisation organisation for photogrammetry and RS is the ISO/TC 211 Geographic information/Geomatics. Within the ISO/TC 211 the Working Group 6 ‘Imagery’ integrates all related developments. The ISO focus on the theme specific metadata (Kresse and Fadaie Citation2004).
The Open GIS Consortium OGC is the worldwide leading consortium of GIS industries promoting the interoperability of geographic information across platform, system, and country borders. The main field of current activity is the complete integration of the sources of geographic information based on the Internet. The (OGC) plays an important role on the implementation level. In theory, the ISO/TC211 develops the abstract standards and the OGC develops the implementations standards.
2.2. Standards for designing validation approaches in remote sensing projects
Standards play an important role when it comes to the quality assessment of individual projects that apply RS data or systems. Users try to understand the specifications of all the quality measures involved in the project. These specifications can be understood from the used data, the applied process and the anticipated/achieved goals. The QA4EO was established with a focus on individual projects and with the objective to facilitate interoperability of GEO systems provided by EO.
An example that goes beyond the scope of individual application scenarios is NASA’s Earth Science Data and Information System (ESDIS) project where standards were adopted based on defined EO mission requirements. Thereby, NASA was adopting and approving a list of standards including ISO 19115 Geographical Information Metadata Standard, NASA Earth Science Data Preservation Content Specification, and Digital Object Identifiers (DOIs) for Earth Observing System Data and Information System (EOSDIS). NASA ensured to provide the users with the necessary required information to understand and use the data and products of their EO missions. Approved standards include data format standards, status of data and systems together with specification document and user resources. Approved data formats are for example HDF EOS 5 and OGC KML. Additional information related to the specific formats can be found in the NASA Earth Science Community Recommendations for users. Thus, a user of the data can refer to those approved standards to understand the quality aspects and the limitations of data used for their project. Further, the community recommendations provide valuable information including the strength, weakness, applicability and limitations of specific data formats. Consequently, the designer of an RS validation process for a certain project is able to employ the metadata that provides standardised RS data parameters as candidates for the QC in the RS lifecycle. This includes temporal and positional information and many more factors relevant for the specific project at hand.
Some standards are formulated to add a value to other standards making sure to cover the elements related to RS, example of which is what the EOSDIS adds to Federal Geographic Data Committee (FGDC). Content Standard for Digital Geospatial Metadata added metadata elements in the RS domain, such as platform information, sensor information, the history of data processing, and the spatial representation of sensor data (Di and Kobler Citation2000). Thus, standards help to regulate the broadened use of EO data and interoperability. Taking the EOSDIS as an example, the system provides structural and product metadata, covering relationships, data storing information, and the product information. Other types of standards exist that potentially have implications for designing the validation processes such as the FGDC Content Standard for Remote Sensing Swath Data from the context of mission planning. The standard defines the minimum data content of a swath and the relationships among its internal components with semantic definitions. This type of standard can be beneficial to certain applications of RS as it helps to understand the contents, coordinates, time scale of a swath data.
Thus, standards can provide the necessary support for designing the quality validation approaches, especially when detailed information is required. But initially, a unified process can be of benefit and guide to the user to develop a process that is compliant and interoperable. Finally, standards regulate the reporting process, which being followed will enable the continuity and clearness of the produced products.
3. Theoretic modelling in data quality
Data Quality (DQ) is considered a multifaceted concept, i.e. different dimensions concur to its definitions. Traditionally, DQ has been investigated focusing especially on data as represented in relational tables adopted in Data Base Management Systems (DBMS) (for an extensive survey of DQ in the relational model see (Batini and Scannapieco Citation2016)). The relational model adopts a clean distinction between the intentional part of data, the database schema, and the extensional part, made of data values that change in time. Such distinctions have raised a corresponding distinction between schema quality dimensions and data quality dimensions. An example of schema quality dimension is normalisation while examples of DQ dimensions are accuracy, i.e. how close are data aiming to represent an observable in the real world to the true data representing the observable, and currency, to what extent data are up-to-date.
Notice that dimension definitions (Batini and Scannapieco Citation2016) do not provide in general a method of measurement of the level of quality; to get this we have to define quality metrics. For instance, to measure the accuracy of an alphanumeric value v, we need a lookup table, e.g. of names, and the measure of accuracy is the minimal normalised distance between v and values in a reference-certified list of values, usually called look-up table, where the distance is measured in terms of a given distance function, e.g. edit distance.
In the recent years, digital data collected through various types of sensors have reached a remarkable size, and are growing and growing exponentially, assuming the denomination of ‘big data’. In the world of big data (BD), to which remote sensing data belong, we have to consider first of all that the ‘ground truth’ is frequently no longer available, and the assessment of data quality is often results in the assessment of the data source. Besides this change of paradigm, in BD, data quality dimensions evolve in DQ are influenced by two relevant issues, namely data types and data quality in use.
Data types – Big data correspond to a variety of data types rising from linguistic and visual information, gathered through social networks, enterprise and public sector information systems as well as the Internet and the Web; research in data quality has produced a deep investigation on how DQ concepts can be extended to such vast set of data types, encompassing, e.g. semi-structured texts, maps, images, linked open data. Notice that in such data types the distinction between schema and instance fades or even vanishes.
Adopting the streams of activities discussed by (Boell and Cecez-Kecmanovic Citation2014, Batini and Scannapieco Citation2016) focuses on what Boell calls the inner hermeneutic cycle, made up of searching, sorting, selecting, acquiring, reading, identifying, refining. Such complex data cycle, and the variety of sources of data, results in high variability and heterogeneity of data types used in the area of big data; this evolution led to: a classification of structural characteristics associated to each data type.
a clustered classification of data quality dimensions, where cluster representative dimensions are Accuracy, Completeness, Redundancy, Readability, Accessibility, Consistency, and Trust.
a posteriori justification of the evolution of quality dimensions from relational data types in a database setting to dimensions mentioned in the literature for each type.
The method discussed in (Batini and Scannapieco Citation2016) can be adopted also for a priori discovery of relevant dimensions and metrics for a given BD type. In this case, the target of the exploratory research is a methodological process that has as input (i) a quality dimension in a given quality dimension cluster, and (ii) a data type described in terms of its structural characteristics; such a methodological process should allow to discover or at least to explore the conception of specific dimensions and metrics, and possibly assessment and improvement methods and techniques for achieving BD quality.
Data Quality in use – Organisations make use of information for different purposes, among them taking decisions, doing actions, producing interpretative or predictive models. In the context of DQ, the term fitness for use has been first used to underline the characteristics of data quality not considered as intrinsic, but else when data are used for some goal or process, and one wants to predict the influence of quality on the outcome, namely, the degree of achievement of the goal or process.
The concept of data utility considered independently from the quality perspective has been long investigated in the literature on management of information systems; see, e.g. (Ahituv Citation1980). One of the first authors to deal with the relationship between decision quality and IQ is Stephenson (Citation1985), in which it is observed that to make high-quality decisions, it is crucial to have access to information that is as complete and relevant to decision tasks as possible, rather than just having a high volume of information. A qualitative investigation of the relationship between decision quality and DQ is performed in (Jung Citation2004) where the DQ conceptual framework proposed in (Wang and Strong Citation1996) is adopted, in which DQ is classified in terms of intrinsic, contextual, representational, and accessibility dimensions.
Contextual dimensions are discussed in (Batini and Scannapieco Citation2016) as an extension of intrinsic dimensions that we have considered so far. In a contextual dimension, a weight is associated to data values that encapsulate the utility of the value for a given task.
4. Data sources in remote sensing
4.1. Remote sensing platforms
The data quality model introduced in the introduction section describes that RS data sources used in different phases of the lifecycle are relevant for dimensions and their metrics. For this reason, it is essential to provide a brief reflection on data sources. In the RS domain datasets are acquired from different platforms. In general, RS platforms can be distinguished according to their elevation above ground. They can be divided into three categories: space platforms, aerial platforms and terrestrial platforms (). Space platforms are usually satellites carrying different types of sensors. Aerial vehicles are airplanes, helicopters or UAVs. Terrestrial sensors carry out measurements on the ground, sensors are often mounted on tripod like in close-range photogrammetry, terrestrial laser scanner (Tóth and Jóźków Citation2016).
Table 1. Table shows different types of RS platforms.
With the highest altitude and stability, space-borne satellite platforms are significant parts of RS for almost 50 years (Gu and Tomgjia Citation2016). In addition, different sensors can be mounted in a single platform resulting in simultaneous coverage benefits. Platform revisit cycle and coverage cycle greatly depend on the elevation of the platform over the Earth’s surface. The general classification of the satellite platforms is based on their orbital geometry and timing. Geostationary, equatorial and polar orbiting, Sun-synchronous orbits can be distinguished (Ge and Yan Citation2012, Tong Citation2016).
Airborne platforms can be mainly divided into two categories: manned aircraft and UAV. Manned airborne platforms have the longest history in Earth Observation, as it was the sole method in the early age of RS. The first aerial images were acquired on balloons in the XIX century providing images with significant uncertainty. Aerial RS systems have played an important role in topographic mapping which has been the primary application in the early age. Nowadays, stability and predictable flight tracks have become crucial expectations. In aerial RS, a wide spectrum of aircrafts and helicopters exist in both civil and military domain. The more necessity for higher altitude and stability, the more sophisticated aircraft must be used. The low altitude aircrafts include fixed-wing propeller-driven airplanes, ultralight single seat-powered flying machines, helicopters and drones. This latter technology has been extensively used both for civil and military applications.
The UAV systems can complement manned aircraft and satellite RS system observations (Pajeres Citation2015). Fixed, rotated-wing and combined solutions are all used in UAV technology with different flying heights, distances, manoeuvrability. It has the characteristics of small size, light weight, low-cost platform when compared to manned airborne platforms (Yan et al. Citation2004). A wide range of different sensors (camera, multi-camera, radar, LiDAR, magnetometer, etc.) can be mounted on UAVs to acquire data for mapping, modelling and monitoring spatial phenomena. (Guo et al. Citation2019).
Mid-altitude elevation aircrafts include mostly turbo-prop airplanes and jets. These have more stability and ability to obtain higher spatial coverage. Special applications, like satellite system simulations, atmospheric researches or reconnaissance require high altitude aircrafts, which provide very large areal coverage with lower resolution.
Terrestrial platforms can carry sensors on towers, cars or ships measuring the spectrum of various objects. There are several applications (industrial, agricultural, military, environmental, etc.) of these platforms and devices, similar to the space-born and aerial specifications, mentioned above. In some cases, the acquired data of terrestrial platforms and their sensors can be efficiently integrated into RS datasets with smaller resolution (Zhang et al. Citation2018a). In connection with ground-based alternatives, mobile mapping systems (from trains to human-carried devices) and the static handheld devices, tripods, towers and cranes are the commonly used ground platforms. The mobile mapping technology is widely applied recently and includes all georeferenced platforms with fully digital sensor implementation. Airborne RS systems, traditional land-based vehicles and personal navigation systems (outdoor and indoor) are the basic types. A great variety of static and permanent platforms are used in close range RS laboratories too.
4.2. Remote sensing sensors
Platforms carry the key component of the RS systems, the sensor itself. Sensors are devices for acquiring electromagnetic radiation of the targeted object or surface. Generally, sensors can be distinguished according to the range of wavelength they measure and active or passive nature of detecting electromagnetic radiation (Remote Sensors Citation2019). Besides, the illumination source, data form also plays a major aspect in sensor classification. Passive or active sensors refer to the first, imaging or non-imaging sensors refers to the second aspect. Passive RS systems measure light reflected or emitted by a target. The first depends primarily on solar electromagnetic radiation. On the contrary, active instruments emit their own source of energy and measure the returned quantity after it has interacted with a target. RS sensors measure the reflected or emitted radiation of a target or surface. Imaging sensors can produce image of an area, where visualisation is resolved by smaller parts of the sensors whole view (pixels). Non-imaging instruments register only a single response value from the measurement, therefore usually no image is created from the data (Xu Citation2005, Weng Citation2017).
Most common passive sensors are typically the optical sensors that are either single channel, multichannel, hyperspectral or thermal depending on their sensitivity to the electromagnetic spectra (). Other sensors emit their own energy to register backscatter of the radiation like RADAR systems using the microwave range of the spectra. It usually produces elevation measurements like InSAR technology or performs nadir single measurement like RADAR Altimeter. Furthermore, laser beam can be also used to range distance to target with laser scanning technology. Besides, microwave emission of surfaces or objects can be measured with passive microwave sensors like scatterometers and microwave satellites.
Table 2. Table shows the classification of different RS sensors.
Optical sensors are the most common RS instruments and photographic cameras are the oldest sensors in EO. In the first era of EM radiation detection, film was placed in the focal plane behind the optics mounted in a camera to obtain images. In the last decades, digital sensors (CCD/CMOS) have widely replaced this technology (Zhao Citation2003). Obtained panchromatic and monochrome images were certainly a perfect solution for geometric data acquisition in mapping, but the need for spectral information to classification processes was an essential step forward. Filters, beam splitting and multi-camera heads were the major technological solutions to obtain multispectral images. Radiometer is an instrument designed to measure the intensity of electromagnetic radiation in a set of wavebands reaching from visible light to infrared radiation. The electro-optic radiometers are similar in design to cameras, but instead of film, they use an electronic detector to record the intensity of electromagnetic energy. Radiometers that measure more than one waveband are called multispectral radiometers. Light is separated into discrete wavebands to obtain multiple waveband or multichannel data. This separation can be carried out using filters, prisms or other sophisticated techniques (Srivastava et al. Citation2014). Hyperspectral sensors or imaging spectrometers are instruments that acquire images in many narrow contiguous spectral bands throughout the visible, and infrared portion of the spectrum (Qian et al. Citation2004). They collect data in up to hundreds of bands enabling the construction of continuous reflectance measures (Lillesand et al. Citation2015).
Thermal infrared RS is a slightly different type of RS data than visible light RS data. It is measuring radiance temperature in the thermal part of the electromagnetic spectra. The measured thermal brightness temperature of objects or ground then can be related to the kinetic temperature of the observed ű target (Künzer and Dech Citation2013). The sensor to obtain such data, the thermal infrared radiometers often differ from other multispectral radiometers.
Active RS has two significant advantages over passive instruments. They do not require solar illumination for measurement and are basically independent of weather conditions (Sui Citation2009). RADAR technology is by now more than a half-century old technology in RS observation. There are several factors influencing the intensity of the returning RADAR pulses, however the geometric and di-electrical properties of the surface or object reflect the most important ones. Consequently, information on the structure and material composition of target can be measured with microwave radiation. RADAR sensors with their all-weather capability are penetrating clouds, rain and snow, providing different information from optical sensors. The time required for the energy to travel to the target and return back to the sensor determines the distance or range to the target. By recording the range and magnitude of the energy reflected from all targets as the system passes by, a two-dimensional image of the surface can be produced (Remote Sensors Citation2019). Radar altimetry is recoding surface height by measuring the time taken by a radar pulse to travel from the satellite antenna to the surface and back to the satellite receiver. Combined with precise satellite location data, altimetry measurements yield surface heights. This instrument is a non-imaging sensor since measurements are taken only in nadir direction as the platform moves forwards (Altimetry Citation2019).
Lidar (Light detecting and ranging) systems use laser for illumination of the target. This technology became affordable in the past 20 years. Nowadays, systems are mounted on space, aerial and terrestrial platforms too. Lidar is a sensor with high precision position and high sensitivity. They acquire data combining high-precision models with radiation intensity measures. Considering the number of digitised backscattered pulses, there are instruments, which can detect 2 returns, 4–6 returns and by now, full-waveform signals (Luo et al. Citation2014).
The passive microwave RS sensors are collecting electromagnetic radiation in the low frequency, microwave portion of the spectra responding to a low level of energy emitted by the target. The instruments operate the same manner as thermal radiometers and scanners. Sensors incorporate antennas rather than photon detectors (Qian et al. Citation2004).
5. Data quality dimensions and metrics
5.1. Data quality dimensions in remote sensing
The physical attributes and acquisition properties of the RS data cannot be the only condition influencing the choice of the best data set for a given application domain. It has to be extended with quality indicators characterising the fitness for use of the selected domain. For this reason, this section describes data quality dimensions and their metrics directly related to data source and lifecycle. The latter is highly influenced by the domain of the application in use. The GEO QA4EO initiative has defined Quality Indicators as ‘a means of providing a user of data or derived product (which is the result of a process) with sufficient information to assess its suitability for a particular application’ (Lecomte Citation2010). Therefore, a comprehensive list of all quality indicators is a challenging issue with no general solution. Its metrics should be based on a quantitative assessment of its traceability to an agreed reference or measurement standard ideally SI, the International System of Units.
Resolution has an outstanding importance in RS domain. The most common quality related dimension is mainly associated to the RS sensors and data sources. Various resolution dimensions fundamentally influence the whole lifecycle and obviously the obtained products. Elements of the resolution cluster with a short definition and their metrics are presented in .
Table 3. Resolution dimension cluster in RS.
The accuracy quality cluster is a multilevel feature group containing similar categories as in the resolution cluster. The main subgroups are the precision and the accuracy dimension elements. Precision is the ‘Closeness of agreement between indications or measured quantity values obtained by replicate measurements on the same or similar objects under specified conditions’ (VIM Citation2012). Accuracy is the ‘Closeness of agreement between a measured, quantity value and a true quantity value of a measurand’ (VIM Citation2012). While spatial precision is defined, the instability of the observation, in contrast spatial accuracy is the positional accuracy of features in relation to the Earth. The multilevel feature groups of accuracy quality cluster are presented in .
Table 4. Accuracy dimensions cluster in RS.
In the cluster Completeness () spatial completeness is dealing with the fullness of a dataset handling for example the effect of shadowing objects, sun flares on water surfaces or masking by an object (e.g. propeller of a UAV). It is a feature about area coverage. In photogrammetry (especially in stereophotogrammetry) stereo completeness has key importance, representing the ratio of the stereo coverage in image pairs. In monitoring systems and applications, temporal completeness describes how the obtained data represents a complete time series of a phenomenon (Nyquist-rate Citation2019). The thematic completeness measure describes the data interpretation quality how the expected and defined classes are evaluated. This feature is important when using of e.g. multiple classifiers.
Table 5. Completeness dimension cluster in RS.
Spatial redundancy in the Redundancy cluster () is a value proportional to the number of overlapping images or overlapping area. To set an example using stereo image evaluation or Structure-from-Motion (SfM) algorithm this dimension has a fundamental importance. While temporal resolution is a measure describing the revisit cycle or acquisition repetition in time, temporal redundancy defines the amount of repetitive/multiplicative observations for a certain area or object set.
Table 6. Redundancy dimension cluster in RS.
The Readability cluster () is divided into spatial readability and radiometric readability subtypes. It is a measure in data interpretation, how objects can be identified/separated in a spatial and radiometric context.
Table 7. Readability dimension cluster in RS.
The Accessibility cluster () focuses on the sources of the images. Data providers control how fast the captured images can be obtained or delivered. Some institutions established speed-up processes for specific RS data acquisitions. To set an example the International Charter on Space and Major Disasters is facilitating rapid response to natural or man-made disasters enabling fast delivery after acquisition. In environmental monitoring domain, the fast accessibility can be crucial in some applications, but it has temporal, technical and legal limitations too.
Table 8. Accessibility dimension cluster in RS.
In RS spatial consistency can be described by the superposition of geometric, thematic and topologic consistency in the Consistency cluster (). It represents the quality of image interpretation/understanding: how integrally are the different objects or classes recognised or evaluated. The question is for example, how coherent is a bridge detected with roads and lanes from RS data. Thematic consistency can be described as recognition integrity, how uniform are the thematic classes detected on the area of interest. The topologic consistency is defined to measure the connection and topological clarity of an object. In urban mapping focusing on objects of the built-up environment, house-parcel inclusions can be characterised by consistency dimension. The temporal consistency represents a measure about the possibility or impossibility of observation matching the phenomenon that changes in time.
Table 9. Consistency dimension cluster in RS.
5.2. Examples of dimension metrics
RS data quality is a complex area and it goes beyond the scope of this paper. For this reason, only metrics of the most common dimensions are in focus. These quality dimensions in RS context are the implementation of a generic quality dimension taxonomy. None of the dimensions can be represented without its suitable metric. All have to be interpreted with respect to the data sources and their processing workflow that is called lifecycle phases. Since they are usually presented by numeric values in daily RS practice, their common understanding is crucial. Literature studies emphasise the weakness of their definitions, although many of them have the same or very similar meaning. The following collection has the goal to systematically explain the occurring terms and their definitions together with their synonyms and references.
The root-mean-square error (RMSE) is the accuracy measure of the differences between the actual (true) and measured values. In practice, as an example in spatial accuracy measure, RMSE is defined for coordinates in X and Y directions.
The confusion (error) matrix is a specific table that allows the visualisation of the classification performance. The matrix is an excellent base to derive further quality measures. Two basic types exist: the binary and the multiclass confusion matrix (Barsi et al. Citation2018). The binary confusion matrix visualises, how a single class (C) and its complementary (not C) were classified in comparison to the true recognition. The rows of the matrix contain the classified (sometimes called as predicted or estimated or output) results, while the columns present the actual (true or target) belongings (Campbell Citation1996). The original table can be extended by the goodness and error measures computed from the original table values.
Derived quality indicators are TP the true positive (hit or power), TN the true negative (correct rejection), FP the false positive (false alarm, Type I error) and FN the false negative (miss, Type II error) values. Based on these items further indicators are to be defined, as PA is the producer’s accuracy (recall or true positive rate or sensitivity), UA the user’s accuracy (consumer’s accuracy or precision or positive predictive value), OA the (overall) accuracy, OE the omission error (false negative rate), CE the commission error (false discovery rate), TNR the true negative rate, FPR the false-positive rate, NPV the negative predictive value and finally FOR the false omission rate. The rate values are often given in per cent (Barsi et al. Citation2018).
Confusion matrix can be extended also for multiclass cases. The measures are the same as in binary case, but the above formulas must be extended by the increased number of classes. Accordingly, user’s accuracy is computed as the right classified pixels divided by all pixels belonging to the certain class. In multiclass case, two further measures are frequently used, which are the average accuracy and Cohen-kappa (Cohen Citation1960).
The quantitative evaluation metrics for the radiometric quality of RS images can be classified as follows. One is reference-based method, which requires the availability of another high-quality image as the reference. The other one is based only on the statistical information of the image to be evaluated.
Important radiometric reference-based metrics are the PSNR (Peak Signal-to-noise Ratio), the UIQI (Universal Image Quality Index), the SSIM (Structural Similarity Index), whereas non-reference metrics are the SNR (Signal-to-noise ratio), the MG (Mean Gradient), (information) entropy. Spatial quality description is sometimes given by signal processing terms, like the MTF (Modulation Transfer Function) or the PSF (Point Spread Function) (Weng Citation2017).
6. Data lifecycle in remote sensing
Remotely sensed data are captured and processed to meet the goals of an application domain. To be able to obtain the targeted results, particular data processing workflow is applied from data capturing to RS outputs. The elements of RS workflow in general are discussed in this section described as phases of the RS data lifecycle. In order to keep the most general approach, the following operation groups are compiled:
Data acquisition
data source selection: selection of the domain relevant physical data source, which implies the RS platform and sensor.
data reading/data capture: “detailed description of a measurement according to one or more RS measurement principles and to a given measurement method, based on a measurement model and including any calculation to obtain a measurement result” (VIM Citation2012).
sensor calibration: Following the sense of the definition of International Bureau of Weights and Measures: “An operation that, under specified conditions, in a first step, establishes a relation between the quantity values with RS measurement uncertainties provided by measurement standards and corresponding indications with associated measurement uncertainties (of the calibrated instrument or secondary standard) and, in a second step, uses this information to establish a relation for obtaining a measurement result from an indication” (VIM Citation2012).
Storage.
data format management (DFM): “analysis of data formats and their associated technical, legal or economic attributes which can either enhance or detract from the ability of a digital asset or a given information systems to meet specified objectives” (Wikipedia Citation2019). It also contains the selection and change of data formats.
data compression: “encoding information using fewer bits than the original representation” (Wikipedia Citation2019).
data replication: copying data into multiple realisations.
data distribution: replication of data among different sites.
Data preprocessing, processing and analysis.
restructuring: change of the organisation/structure of the originally obtained data.
data selection: finding data cases satisfying one or more concrete conditions on attribute values.
transformation: operations of converting data sets between different representations, formats, content.
sampling, resampling: creation of representative subset of initial data set
filtering: removing unwanted components or features of captured RS data.
feature extraction: derivation of measures in describing target objects.
segmentation: partitioning of remotely sensed data into two or more groups. Sometimes its meaning is e.g. an image splitting into similar attributed regions.
clustering: creating data groups of similar features.
classification: separation of remotely sensed image/raster/point cloud data into various (thematic) categories.
sensor/data fusion: integration and/or merge of multiple heterogeneous data even with different representations.
optimisation: selection of the best element/parametrisation/scenario with regard to some given criterion from some available alternatives (Wikipedia Citation2019)
abstraction: derivation of general rules from specific examples.
Data visualisation and delivery.
As our basic data quality scheme has been presented in , the elements of the data lifecycle has strong relation to data quality dimensions and their adequate metrics. shows the most relevant dimensions of the above lifecycle phases and subphases.
Table 10. Quality dimensions versus lifecycle.
7. Conclusions
During the last decade, the community working with geospatial and RS data has faced an exponential increase opening a new perspective in data management. The RS community itself has undergone a fundamental change: the minor group of professionals has been extended to a broader community of non-professional users. In the past they were mostly using RS products, now they started to take an active part in RS data collection and processing. In many cases, non-professional users assume that digital data are by definition an error-free source of information. Google’s Map service has started to visualise geometric uncertainty in location data by drawing areas instead of dots on its maps. It is a step forward for the general user community to understand that data uncertainty is an important issue.
In the practice of surveying and geodesy observations and measurements include errors. Measurement result is complete only when it is accompanied by a statement of the associated uncertainty which can propagate when new variables are derived from the original measurements. This phenomenon is called error propagation. With the help of error propagation calculation, an objective description of uncertainty can be developed for processing complete chains e.g. the error in the area calculation of a rectangle can be estimated from the uncertainty assessment of the length measurement. The procedure of how to calculate the area of a rectangle is widely known, but the uncertainty assessment procedure is only known and applied by a minority of professionals.
In the domain of RS geometric accuracy is a widely known measure for uncertainty estimations however further key indicators introduced in this paper like completeness, redundancy or consistency are less known features. Applying the error propagation estimation in the RS domain helps to elaborate a more generic approach of data quality and its behaviour during the processing workflow.
This paper aims at speeding up this development by raising awareness for both professional and non-professional users of RS data uncertainty. It is reviewing quality dimensions to understand that geometric accuracy is not the only quality indicator and data are not error free. On the other hand, uncertainty cannot be eliminated but we have to learn how to minimalise and to live with it. Geometric accuracy is a crisp uncertainty feature, while other quality measures are more fuzzy features. Crisp features can be considered by exact and similarly crisp laws, fuzzy phenomena require fuzzy rules and management mechanisms.
The data quality model described in the paper relates the three basic elements of data source – lifecycle – quality dimension in a triangular quality scheme.
RS data sources were presented as platforms and sensors in the paper. Regarding data fusion aspects satellite-based, terrain-based or similar data capture equipment have great importance in the lifecycle, which is more substantial if several sources are to be integrated or fused. Beyond the commonly expected advantages of fusing multiple data sources, uncertainty estimations raise further issues. As an example, satellite- and terrain-based optical imagery can be fused to increase geometric and/or radiometric resolution, but the resulting integrated data cube has modified consistency measures. Satellite-, terrain-based or similar equipment, Internet of Things (IoT) components, field sensors, etc., have dominant importance in the workflow; their integrated and fused use underline the necessity of data quality analyses covering the most available features not limiting for the (existing and widely spread) geometric descriptors.
References
- Ahituv, N., 1980. A systematic approach toward assessing the value of an information system. MIS Quarterly, 4 (4), 61–75. doi:10.2307/248961
- Albrecht, F., et al., 2018. Providing data quality information for remote sensing applications. The International Archives of the Photogrammetry, Remote Sensing and Spatial Information Sciences, XLII (3), 15–22. doi:10.5194/isprs-archives-XLII-3-15-2018
- Altimetry, 2019. Available from: http://www.altimetry.info/glossary_/altimetry/ [Accessed on 5 November 2019].
- Barsi, Á., et al., 2018. Accuracy dimensions in remote sensing. The International Archives of the Photogrammetry, Remote Sensing and Spatial Information Sciences, XLII (3), 61–67. doi:10.5194/isprs-archives-XLII-3-61-2018
- Batini, C., et al., 2017. Data quality in remote sensing. The International Archives of the Photogrammetry, Remote Sensing and Spatial Information Sciences, XLII (2/W7), 447–453. doi: 10.5194/isprs-archives-XLII-2-W7-447-2017.
- Batini, C. and Scannapieco, M., 2016. Data and information quality: dimensions, principles and technques. Switzerland: Springer International Publishing. ISBN 978-3-319-24106-7
- Boell, S.K. and Cecez-Kecmanovic, D., 2014. A hermeneutic approach for conducting literature reviews and literature searches. Communications of the Association for Information Systems, 34 (1), 257–286. doi:10.17705/1CAIS
- Campbell, J.B., 1996. Introduction to remote sensing. London: Taylor and Francis. ISBN-13: 978-0415416887.
- Chrisman, N.R., 1982. A theory of cartographic error and its measurement in digital databases. Proceedings, AutoCarto, 5, 159–168.
- Chrisman, N.R., 1984. The role of quality information in the long-term functioning of a geographic information system. Cartographica, 21 (2–3), 79–87. doi:10.3138/7146-4332-6J78-0671
- Chrisman, N.R., 1987. A draft proposed standard for digital cartographic data quality. In: H. Moellering, eds. The American cartographer report 8. Columbus, OH: National Committee for Digital Cartographic Data Standards, 129–135
- Cohen, J., 1960. A coefficient of agreement for nominal scales. Educational and Psychological Measurement, 20 (1), 37–40. doi:10.1177/001316446002000104
- Di, L. and Kobler, B., 2000. NASA standards for earth remote sensing data. International Archives of Photogrammetry and Remote Sensing, XXXIII (Part B2), 147–155.
- Fisher, P., Comber, A., and Wadsworth, R., 2006. Approaches to uncertainty in spatial data. In: R. Devillers and R. Jeansoulin, eds. Fundamentals of spatial data quality. London, UK: ISTE. ISBN:9781905209569
- Fisher, P.F. Models of uncertainty in spatial data. In: P.A. Longley, et al., eds., 1999. Geographical information systems. Chichester, UK: Wiley, 191–205. ISBN-13: 978-0470721445
- Ge, B. and Yan, Y., 2012. High resolution earth observation system and application. Satellite Applications, 5, 24–28.
- Goodchild, M.F. and Gopal, S., 1989. Accuracy of spatial databases. London: Taylor & Francis, 81–90
- Gu, X. and Tomgjia, Y., 2016. Up to the higher altitude – the new “three campaigns” for the development of China. Spaceborne remote sensing application. Journal of Remote Sensing, 20 (5), 781–793.
- Guo, Y., Senthilnath, J., and Wu, W., 2019. Radiometric calibration for multispectral camera of different imaging conditions mounted on a UAV platform. Sustainability, 11 (4), 978. doi:10.3390/su11040978
- Jacobsen, K., 2006. Calibration of imaging satellite sensors. The International Archives of the Photogrammetry, Remote Sensing and Spatial Information Sciences, 36, 1.
- Jakobsson, A. and Giversen, J., 2007. Guideline for implementing the ISO 19100 geographic information quality standards in national mapping and cadastral agencies. Eurogeographics Expert Group on Quality.
- Jung, W., 2004. A review of research: an investigation of the impact of data quality on decision performance. Proceedings of the 2004 international symposium on information and communication technologies, Trinity College, Dublin, 166–171.
- Konecny, G. and Lehmann, G., 1984. Photogrammetry. Berlin: De Gruyter.
- Krauss, K., 1994. Photogrammetry. 4th ed. Köln: Dümmler Verlag, Stamm GmbH.
- Kresse, W., 2010. Status of ISO standards for photogrammetry and remote sensing. Castelldefels, Spain: ISPRS – EuroSDR, EuroCOW.
- Kresse, W. and Fadaie, K., 2004. ISO standards for geographic information. Berlin, Heidelberg: Springer-Verlag.
- Kugler, Z., et al., 2018. Time-related quality dimensions of urban remotely sensed big data. The International Archives of the Photogrammetry, Remote Sensing and Spatial Information Sciences, XLII (4), 315–320. doi:10.5194/isprs-archives-XLII-4-315-2018.
- Künzer, C. and Dech, S., 2013. Thermal infrared remote sensing sensors, methods, applications. Dordrecht: Springer Science + Business. ISBN 978-94-007-6639-6.
- Lecomte, P., 2010. A quality assurance framework for earth observation (QA4EO). Key guidelines, version 4.0, Group on Earth Observations/Committee on Earth Observation Satellites.
- Leick, A. and Emmons, M., 1994. Quality control with reliability for large GPS networks. Surveying and Enginnering, 120, 26–41.
- Lillesand, T., Kiefer, R.W., and Chipman, J., 2015. Remote sensing and image interpretation. 7th ed. USA: John Wiley & Sons, 736. ISBN: 978-1-118-34328-9.
- Liu, Y., et al., 2019. Geometric accuracy of remote sensing images over oceans: the use of global offshore platforms. Remote Sensing of Environment, 222, 244–266. doi:10.1016/j.rse.2019.01.002.
- Luo, S., Xi, X., and Wang, C., 2014. Application of lidar remote sensing in cultural heritage protection. Remote Sensing Technology and Application, 29 (6), 1054–1059.
- Masek, J.G., et al., 2013. Version 2. Model product. Oak Ridge, Tennessee, USA: ORNL DAAC. doi:10.3334/ORNLDAAC/1146
- Moon, M., et al., 2019. Long-term continuity in land surface phenology measurements: a comparative assessment of the MODIS land cover dynamics and VIIRS land surface phenology products. Remote Sensing of Environment, 226, 74–92. doi:10.1016/j.rse.2019.03.034.
- Mueller, I.I., 1964. The geodetic applications of satellites. Columbus, Ohio, USA: Defense Technical Information Center.
- Nyquist-rate, 2019. Available from: https://en.wikipedia.org/wiki/Nyquist_rate [Accessed 5 November 2019].
- Oort, P., 2005. van Spatial data quality: from description to application. Publications on Geodesy.
- Pajeres, G., 2015. Overview and current status of remote sensing applications based on unmanned aerial vehicles. Photogrammetric Engineering and Remote Sensing (Pe&Rs), 81 (4), 281–329. doi:10.14358/PERS.81.4.281
- Qian, L., Pei, X., and Zhao, W., 2004. Progress in the application of hyperspectral imaging remote sensing in China. Remote Sensing for Land and Resources, 2, 1–6.
- Quality assurance framework for earth observation. Available from: http://QA4EO.org/ [Accessed 5 November 2019].
- Remote sensors, 2019. Available from: https://earthdata.nasa.gov/user-resources/remote-sensors [Accessed 5 November 2019].
- Salgé, F., 1995. Semantic accuracy. In: S.C. Guptill and J.L. Morrison, eds. Elements of spatial data quality. Oxford: Elsevier Science, 139–151.
- Sampaio, P., Saraiva, P., and Rodrigues, A.G., 2010. A classification model for prediction of certification motivations from the contents of ISO 9001 audit reports. Total Quality Management & Business Excellence, 21 (12), 1279–1298. doi:10.1080/14783363.2010.529367
- Shekhar, S. and Xiong, H., 2008. Encyclopedia of geographical information sciences. Berlin: Springer. ISBN-13: 978-0387359755.
- Srivastava, P.K., Mukherjee, S., and Gupta, M., 2014. Remote sensing applications in environmental research. Springer, 211. ISBN: 978-3-319-05905-1.
- Stephenson, B., 1985. Management by information. Information Strategy: The Executive’s Journal, 1 (4), 26–32.
- Sui, L., 2009. Active radar remote sensing. China: Surveying and Mapping Press.
- Time, 2019. Available from: https://en.oxforddictionaries.com/definition/time [Accessed 5 November 2019].
- Tong, X., 2016. Progress in the construction of major special projects for high-resolution Earth observation systems in China. Journal of Remote Sensing, 20 (5), 775–780.
- Tóth, C. and Jóźków, G., 2016. Remote sensing platforms and sensors: a survey. ISPRS Journal of Photogrammetry and Remote Sensing, 115, 22–36. doi:10.1016/j.isprsjprs.2015.10.004
- Veregin, H., 1999. Data quality parameters. In: P.A. Longley, et al., eds.. Geographical information systems. Chichester, UK: Wiley, 177–189. ISBN-13: 978-0470721445.
- Veregin, H. and Hargitai, P., 1995. An evaluation matrix for geographical data quality. In: S.C. Guptill and J.L. Morrison, eds.. Elements of spatial data quality. Oxford; Elsevier Science, 167–188.
- VIM, 2012. Joint committee for guides in metrology (JCGM) international vocabulary of metrology – basic and general concepts and associated terms. Sèvres, France: BIPM.
- Wang, R.Y. and Strong, D.M., 1996. Beyond accuracy: what data quality means to data consumers. Journal of Management Information Systems, 12 (4), 5–33. doi:10.1080/07421222.1996.11518099
- Weng, Q., 2017. Advances in environmental remote sensing: sensors, algorithms, and applications. Taylor & Francis Group, 610. ISBN: 9781138072916.
- Wikipedia, 2019. Available from: https://www.wikipedia.org/ [Accessed 5 November 2019].
- Xu, X., 2005. Physics of remote sensing. China: Peking University Press.
- Yan, L., Lv, S., and Zhao, H., 2004. Research on key technologies of UAV aerial remote sensing system. Journal of Wuhan University, 37 (6), 67–70.
- Zhang, X., Jayavelu, S., and Liu, L., 2018a, June 15. Evaluation of land surface phenology from VIIRS data using time series of PhenoCam imagery. Agricultural and Forest Meteorology, 256–257, 137–149. doi:10.1016/j.agrformet.2018.03.003
- Zhang, X., et al., 2018b. Generation and evaluation of the VIIRS land surface phenology product. Remote Sensing of Environment, 216, 212–229. doi:10.1016/j.rse.2018.06.047.
- Zhao, Y., 2003. Principles and methods of remote sensing application analysis. China: Science Press.