Abstract
Germ-free mice are used to examine questions about the role of the gut microbiota in development of diseases. Generally these animals are maintained in semi-rigid or flexible-film isolators to ensure their continued sterility or, if colonized with specific microbiota, to ensure that no new species are introduced. Here, we describe the use of a caging system in which individual cages are hermetically sealed and have their own filtered positive airflow. This isopositive caging system requires less space and reduces animal housing costs. By using strict sterile techniques, we kept mice germ-free in this caging system for 12 weeks. We also used this caging system and approach to conduct studies evaluating a) the stability of the microbiome in germ-free mice receiving a fecal transplant and b) the stability of dietary-induced microbiota changes in fecal-transplanted mice. As has been shown in fecal transfer studies in isolators, we found that the transferred microbiota stabilizes as early as 2 weeks post transfer although recipient microbiota did not completely recapitulate those of the donors. Interestingly, we also noted some sex effects in these studies indicating that the sex of recipients or donors may play a role in colonization of microbiota. However, a larger study will be needed to determine what role, if any, sex plays in colonization of microbiota. Based on our studies, an isopositive caging system may be utilized to test multiple donor samples for their effects on phenotypes of mice in both normal and disease states even with limited available space for housing.
Abbreviations
| MSD | = | multi-dimensional scaling |
| OTU | = | operational taxanomic unit |
| SOP | = | standard operating procedure. |
Introduction
Intestinal commensal bacteria play significant roles in the health and disease of their host organisms, in part by participating in nutrient metabolism, guiding proper immune system development, and influencing immune responses to invading organisms.Citation1-6 Mounting evidence strongly associates particular intestinal microbiota with diverse diseases, including obesity, autoimmune disease and inflammatory bowel disease.Citation7 However, due to the chronic nature of these diseases, it is difficult to determine cause and effect. Hence, it is unclear whether changes in the complexity and structure of the microbiome are the precursors or sequelae of these diseases. Germ-free mice are a way to address these questions as they provide an empty niche that can be populated with different microbiota, including those from human patients.Citation5,8 Thus, germ-free mice offer an opportunity to determine causality of certain bacterial communities for a specific disease.Citation7
Studies utilizing germ-free mice are typically conducted in semi-rigid or flexible film isolators designed to keep the animals in a sterile environment. To house and maintain animals under germ-free conditions, the introduction and removal of supplies and samples to and from an isolator requires a time-consuming and labor-intensive decontamination process before and after opening of the port to the isolator. If colonization experiments need to be carried out using multiple donor samples, each isolator can house only a group of mice receiving a single donor sample, requiring large space and expense. In addition, experimental manipulation of mice in the isolator is cumbersome due to the barrier and thick gloves worn by the experimenter to prevent introduction of unwanted microbes.
During the establishment of a gnotobiotic facility at our institution, we developed standard operating procedures for the aseptic use of an alternative caging system to a flexible film isolator for studies using germ-free mice. We hoped that this system would save time, space, and money while providing ease of animal handling. In this system, individual cages are positively pressurized, hermetically sealed, and have their own HEPA filter, establishing barriers between cages so that each cage serves as its own individual isolator. Each isopositive cage (ISOcage P, Tecniplast; referred to in this article as isopositive cages) can be handled within a decontaminated biosafety cabinet using aseptic techniques. In this report, we describe the methods we employed to successfully keep mice germ-free for 12 weeks while housed in the isopositive cages. In addition, we describe 2 studies completed using isopostive caging where 1) fecal transfer to germ-free mice was used to determine the stability of microbiota over a 4 week period and 2) germ-free mice were colonized with microbiota from mice fed 2 different dietary regimens and microbiome alterations determined over a 4 week-period.
Results
Standard operating procedures for handling isopositive cages in a biosafety cabinet
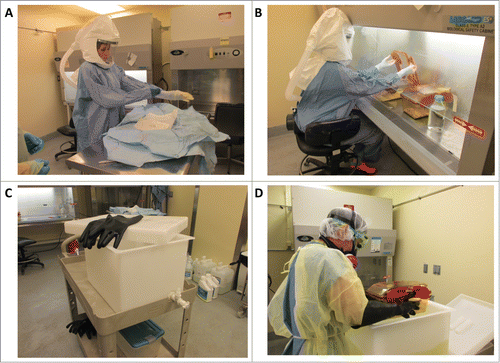
After discussions with researchers using gnotobiotic facilities, we determined that the aseptic technique utilized by surgeons could be adapted for maintaining the sterile environment of the isopositive cages. For cage handling, 2 people were needed; one person being strictly “sterile,” wearing a sterile surgical gown and gloves and working inside the biosafety cabinet () and the other being an “assistant,” handling supplies and disinfecting cages () before introducing them into the biosafety cabinet. Gowning and gloving were performed following standard surgeon preparation procedures (without scrubbing hands and arms with surgical scrub) with the assistant helping the sterile person as a nurse would for a surgeon. For introduction of supplies to the biosafety cabinet, supplies that can be autoclaved were double-wrapped and provided by the assistant to the sterile person by partially unwrapping the outer layer so that the sterile person could grab the inner wrap-containing supplies without contaminating his/her hands to bring them inside the biosafety cabinet. Clean autoclaved cages containing bedding, food, and an empty water bottle were submerged into a Clidox solution (1:3:1) for 30 sec to sterilize the outer surfaces before being introduced into the biosafety cabinet by the assistant () Large bottles of autoclaved water were similarly submerged in the Clidox solution for 30 sec prior to introduction into the biosafety cabinet; this water was used to fill the water bottles during cage setup or cage changes. Both individuals wore protective respiratory masks to minimize exposure to the irritating Clidox (1:3:1) solution. To begin an experiment, germ-free mice were transferred from a flexible-film isolator to the biosafety cabinet using a sterile Tupperware container. The Tupperware container was sealed and quickly submerged in Clidox solution then placed into the biosafety cabinet. The lid was immediately cracked to allow adequate ventilation. Animals were then introduced into the clean sterile (autoclaved) isopositive cages prepared as described above using autoclaved forceps. For weekly cage changes, cages containing germ-free mice were also submerged under Clidox solution for 30 seconds before being introduced into the biosafety cabinet; submersion into the Clidox solution was possible since these isopositive cages are hermetically sealed.
Figure 1. Procedure for working aseptically with isopositive cages. To minimize the risk of contamination when performing procedures on germ-free or colonized mice housed in isopositive cages, personnel donned sterile gowns and gloves, and cages were disinfected with Clidox solution (1:3:1). (A) The sterile person donning sterile surgical gown and gloves. (B) The sterile person working within the biosafety cabinet following aseptic technique. Only autoclaved or Clidox disinfected materials are introduced into the biosafety cabinet and handled by the sterile person. (C) Dunk tank and rubber gloves used by the assistant to completely submerge isopositive cages in Clidox. (D) Assistant submerging the hermetically sealed isopositive cage into 1:3:1 Clidox prior to placing the cage into a previously disinfected biosafety cabinet.
Mice can be kept germ-free in isopositive cages for an extended period of time
In order to test the validity of the isopositive caging system for use in germ-free and gnotobiotic animal studies in our facility, germ-free mice were handled weekly for cage and water changes for 12 weeks following the SOP described above. Pooled fecal samples from each cage were tested weekly with bacterial aerobic and anaerobic culture and monthly with 16S rRNA PCR. All test results were negative for bacterial growth in all samples tested (). These data suggest that isopositive cages can be used to maintain mice germ-free for at least 12 weeks when proper sterile techniques are used.
Table 1. Testing results for bacterial growth using pooled fecal samples from mice housed in isopositive cages
Fecal transfer from SPF mice fed a regular rodent chow results in changes in feces and cecum of germ-free mice
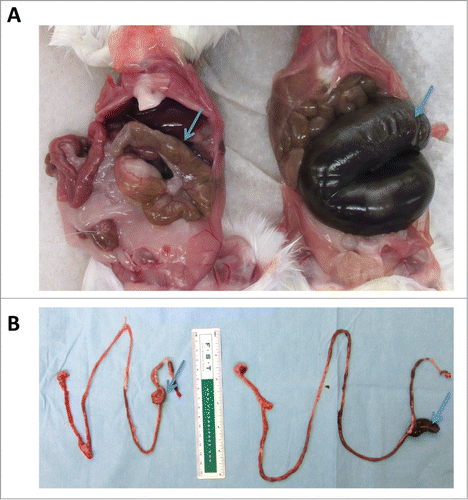
After confirming that our SOPs successfully maintain mice housed in isopositive cages germ-free for an extended period of 12 weeks, we performed fecal transfer studies to evaluate colonization and stability of microbiota over time. Mice (two cages of males and one cage of females, n = 3/cage) were housed in isopositive cages and gavaged with a fecal slurry prepared from SPF mouse fecal pellets. Personnel wore sterile surgical gowns and a single pair of sterile gloves and worked in the biosafety cabinet disinfected with Clidox as described above. Mice were manually restrained with sterile gloved hands for oral gavage. Prior to fecal transfer, baseline fecal samples were collected from germ-free mice and germ-free status was confirmed by 16S rRNA PCR (). Fecal samples were collected from each individual mouse at 1, 2 and 4 weeks post fecal transfer. We noticed significant changes in the consistency of fecal pellets of recipient mice as early as one week after the fecal transfer. Fecal pellets from mice transferred with microbiota of SPF mice were firm and had similar consistency to those from SPF mice. By comparison, fresh fecal pellets from germ-free mice were noticeably soft and thus difficult to pick up with forceps. Four weeks after fecal transfer, ceca of the colonized mice were significantly smaller and the contents firmer compared to germ-free mice (). As previously noted,Citation9 the length of the small intestine was significantly shorter in fecal transplant recipient mice than in germ-free mice ().
Figure 2. PCR analysis of 16s rRNA from baseline fecal samples. Prior to fecal transfer, pooled fecal samples were collected from each isopositive cage and tested for the presence of bacteria by 16s rRNA PCR. (A) Samples from the first study testing fecal transfer stability. (B) Samples from the second study using samples from donors fed a control or high vitamin D diet. Each lane represents a pooled sample from each isopositive cage; H2O, negative control; SPF cont, DNA from feces of animals housed in the SPF facility.
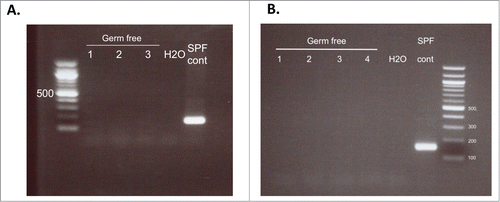
Figure 3. Fecal transfer results in smaller ceca and shorter small intestines. Germ-free mice were gavaged with a fecal slurry generated from mice housed in an SPF facility. Four weeks following fecal transfer, mice were euthanized and phenotypic changes in the gastrointestinal tract were assessed. (A) Fecal transfer to germ-free mice (left) results in smaller ceca compared to mice that remained germ-free (right). (B) Fecal transfer shortened the length of the small intestine. Intestine of a germ-free mouse following fecal transfer (left); intestine of a germ free mouse (right). Arrows point to cecum.
Microbiome analysis of serial fecal samples collected from fecal transplant recipient mice
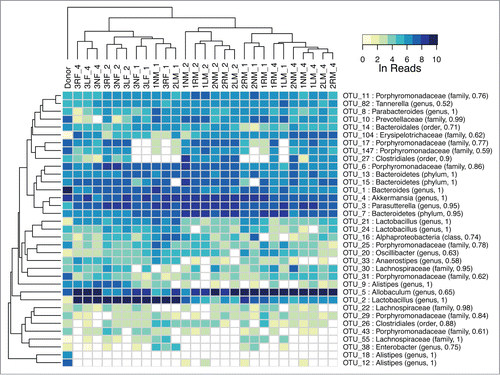
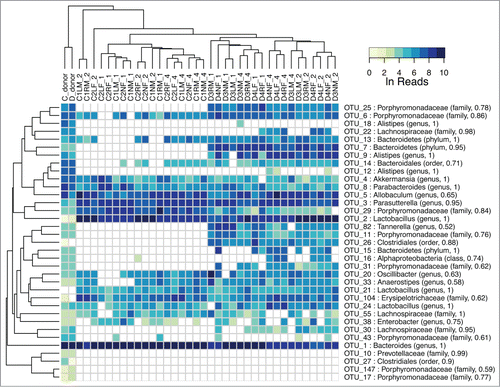
We probed the bacterial community in the donor fecal slurry and in feces from transplant recipients by 16S rRNA sequencing of the V1-V3 regions using 454 and Illumina sequencing platforms. A heat map, constructed from the normalized log read counts with samples clustered by their relative species abundance profiles, revealed that the donor sample was well separated from the recipients (). Two OTUs, OTU_5 (Allobaculum) and OTU_2 (Lactobacillus), showed substantial increases in relative abundance in the recipients over the donor, while OTU_1 (Bacteroides) showed the opposite trend. Samples from fecal transplant recipient mice clustered almost entirely by sex and then by time after fecal transplant (). OTU_2, along with OTU_9 (Alistipes) were strong contributors to the abundance differences between the sexes. PERMANOVA (adonis) analysis confirmed the difference in species abundance profiles as significant (p < 0.01). The same analysis also demonstrated significant differences between the time in weeks post transplant (p < 0.01). For a given mouse, OUT_2 and OTU_5 populations increased in time to relatively high levels by week 4 from very low levels in the donor. In addition to the decline in the relative abundance of OTU_1 after gavage, several OTUs, including OTU_18 and OTU_12, both Alistipes, dropped substantially in abundance to undetectable levels in all but 4 samples.
Figure 4. Heat map of major OTU relative abundances in the fecal transplant experiment. The Ln of the normalized reads per OTU is shown. The hierarchical clustering was performed using average linkage of samples and OTUs based on Bray–Curtis dissimilarity index of relative abundance profiles. The sample names indicate cage number (1, 2, 3), ear tag (R for right, L for left, N for none), sex (M, F), and week (1, 2, 4) preceded by an underscore. The samples cluster almost entirely by sex and then time.
Multi-dimensional scaling (MDS) indicated that the samples significantly diverged from the donor at week one post-transplant but become more donor-like as time progressed (). Males and females appeared to separate into distinct groups (). One week after the initial fecal transplant there was more heterogeneity in abundances and some mixing across sexes. By week 2, the differences between sexes had become more pronounced. In week 4, the sexes were significantly different. While the MDS analysis demonstrated differences in overall microbiome community structure over time and between sexes, the diversity of microbiota was not significantly affected by either sex or time based on Shannon index ().
Figure 5. (A) Multidimensional scaling of OTU abundances from the fecal transplant experiment. The donor sample is shown as a black dot (upper right). Males are shown in cyan and females in magenta. The inner circle indicates time post fecal transplant in weeks as white, gray and black for one, 2 and 4 weeks, respectively. After the initial transplant, the samples diverge from the donor at week one and become more donor-like as time progresses. Males and females appear to separate into distinct groups. (B) Community complexity for fecal transplant experiment by Shannon index. The donor sample is shown at week 0. There is no significant difference by sex.
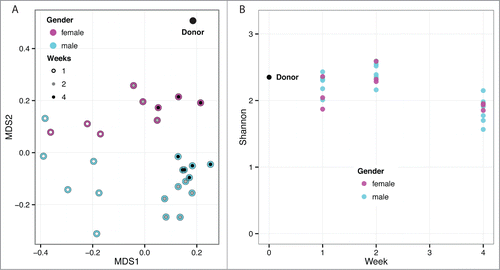
We also tested whether the volume of gavaged fecal slurry influenced the rate of microbiota establishment in germ-free mice. The 2 cages of male mice were given 2 different volumes of the same fecal slurry via oral gavage: 100 µl and 200 µl. We did not observe any differences in microbiota between the 2 cages of males transferred with different volumes of fecal slurry (p > 0.2). Thus, we used 100 µl of fecal slurry in subsequent studies.
Family level depictions of the relative abundances confirmed the trends noted above, despite the loss of taxonomical resolution (Supplemental ) We observed an almost immediate drop in the relative abundance of Bacteroidaceae and a concomitant increase in Erysipelotrichaceae and Lactobacillaceae families compared to the donor sample. By week 4, Erysipelotrichaceae had replaced much of the Lactobacillaceae, except in the females, which was a major structural difference between the sexes.
Stability of microbiota due to dietary-induced changes
Diet can affect the microbiota Citation2,10,11 and we wished to use the isopositive caging to determine whether dietary-induced changes in microbiota would persist when transplanted into germ-free mice. Although most studies examining the influence of diet on microbiota focus on changes in macronutrient content, we have observed that the gut microbiota of mice can also be changed in response to alterations in micronutrients such as vitamin D. Previously, we found that the microbiota of mice fed increased dietary vitamin D (5 IU) was different from those fed a control vitamin D levels (1 IU) even though the 2 types of diets were nutritionally and compositionally identical except for the vitamin D content (unpublished data). We tested whether the 2 types of microbiota maintain their differences upon transfer into germ-free mice fed a regular autoclavable rodent chow. Fecal transfer was carried out as described earlier except that the personnel changed sterile gowns and gloves between the different donor samples. The germ-free status of mice prior to fecal transfer was confirmed by 16S rRNA PCR using fecal samples collected just prior to fecal transplant (). As seen in our first fecal transplant study, fecal pellets became firmer one week after the fecal transfer and ceca of mice at the time of necropsy were significantly smaller than those of germ-free mice.
As with the previous experiment, we probed the community structure of serially collected fecal samples by 16S rRNA profiling. The heat map analysis revealed a strong separation by diet (). Six OTUs were present in the high vitamin D donor samples and the high vitamin D recipients but were not detected in the control diet recipients: OUT_25 (Porphyromonadaceae), OTU_7 (Bacteroidetes), OTU_9 (Alistipes), OTU_82 (Tannerella), OTU_11 (Porphyromonadaceae), and OTU_26 (Clostridales). These OTUs contributed substantially to the separation based on donor diet. The donor sample abundance profiles were not well maintained after gavage. One OTU in particular, OTU_2 (Lactobacillus), also seen in the previous experiment, was highly abundant in the recipients (regardless of donor diet), but present only at low levels in the donor samples.
Figure 6. Heat map of major OTU relative abundances in the fecal transplant experiment using 2 different donor samples from mice fed a control and a high vitamin D diet. The Ln of the normalized reads per OTU is shown. The hierarchical clustering was performed using average linkage of samples and OTUs based on Bray–Curtis dissimilarity index of relative abundance profiles. The sample names indicate diet of donors (C for control, D for high vitamin D), cage number (1, 2, 3), ear tag (R for right, L for left, N for none), sex (M, F), and week (1, 2, 4) preceded by an underscore. There is a strong tendency for the week 2 and 4 samples to cluster by diet.
The separation in abundance profiles of recipients based on donor diet was statistically significant (p < 0.01) and demonstrated by MDS analysis (). However, the 2 donor samples were more similar to each other than the 2 recipient groups. Feces from the 2 treatment groups showed divergent abundance profiles relative to each other but rapidly converged on a new state by week 2 that held through week 4. The sex effect observed in the first experiment was not observed as statistically relevant (p > 0.2) and due to experimental design, the cage effect was not separable from sex. The relative abundance profiles were shown to be divergent by PERMANOVA (p < 0.05). The recipients of high vitamin D diet-associated microbiota showed a more diverse community structure relative to the recipients of control diet-associated microbiota via Shannon index () suggestive of a lasting preservative effect of the vitamin D high diet on the donor community structure that persisted despite the recipient diet.
Figure 7. (A) Multidimensional scaling of OTU abundances from the fecal transplant experiment with donors fed a control and high vitamin D diet. The single black data points (lower right corner) represent the 2 donor samples for the control and high vitamin D diet. Triangles represent high vitamin D and circles represent control diet. The cyan and magenta indicate sex (male and female, respectively) while the inner color indicates time post fecal transplant in weeks as white, gray and black for one, 2 and 4 weeks, respectively. As with the initial fecal transplant study, the samples diverge from the donors rapidly but begin to become more donor-like by week 4. There is a strong division between the 2 diets in post-transplant. (B) Community complexity for fecal transplant with donors fed control and high vitamin-D diets. The donor samples for each diet are shown at week 0. There is no significant difference by sex, however, the microbiota from high vitamin-D diet appears to establish a more diverse bacterial community.
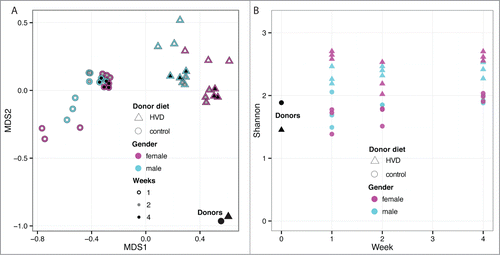
As with the stabilization study, the family level depictions of the relative abundances were informative (). As expected from the first study, we found a substantial immediate decline in the relative abundance of Bacteroidaceae with increases in the abundances of Erysipelotrichaceae and Lactobacillaceae families. The recipient of control diet-fed donor feces exhibited a reversal of this trend by week 4 where the Bacteroidaceae and Erysipelotrichaceae members had become more donor-like in conjunction with a stable population of Lactobacillaceae. In the case of the recipients of high vitamin D diet-fed donor feces, the relative Bacteroidaceae population continued to decline and unlike the stabilization study, the males and females showed similar abundances of the Erysipelotrichaceae and Lactobacillaceae.
Discussion
The recognition that the gut microbiota plays a significant role in health and disease of hosts and the advancement in sequencing methods has resulted in a plethora of studies evaluating differences in human gut microbiota in health and disease.Citation7 These studies suggest that although individual variability exists, the diversity or structure of microbiota may be associated with specific diseases, such as IBD and obesity. Citation3,5,12-15 However, it is unclear whether microbiota changes are the cause or effect of the disease. As studies to evaluate cause and effect relationships in humans are difficult, investigators have used studies in germ-free mice as a surrogate to answer this type of question.Citation7
Alternative caging systems which allow better accessibility while maintaining sterility and avoiding contamination would reduce the complexity and difficulty of working with germ-free animals. The isopositive caging system developed by Tecniplast in which cages have their own filtered airflow and are hermetically sealed offer the opportunity to house and perform short and long term studies using germ-free mice. A recent report Citation16 described the use of the same caging system for germ-free mouse studies using different SOPs from those we employed. This group successfully maintained mice germ-free for 30 d and proposed that short term studies (up to 1 month) requiring multiple-groups and conditions could be carried out reliably in this caging system. Using our SOPs, we found germ-free mice could be kept germ-free for a longer period of time (12 weeks). Since fecal transplant studies in germ-free mice could conceivably last for 3 months, we tested the long-term potential of this caging system.
While the cost of handling and changing cages is similar between isolators and the isopositive caging system, one significant advantage of the isopositive cages is the cost-savings which comes from the lack of set-up fees that are normally charged to inflate and sterilize a new isolator. This fee can be approximately 500 dollars per isolator and often multiple isolators are needed for each experiment to house mice with varying microbiota status. Another advantage of the isopositve cages is that investigators can evaluate multiple different microbiota samples in a smaller footprint. For example, in our second fecal transfer study, we evaluated 2 different donor samples, requiring only 4 isopositive cages in a rack. Had we run the same study using flexible film isolators, it would have required 2 separate isolators, preventing others from using these same isolators. While our study was on-going in the isopositive cages, other research groups were able to run their studies using the same rack. Finally, multiple experimental manipulations (ear punching, oral gavaging, and frequent fecal sampling), often required in a fecal transfer study, are much easier to perform using the isopositive cages since experimental manipulations occur inside a biosafety cabinet.
There were 4 main differences between the SOPs for use of the isopositive cages in our facility and those that were previously reported.Citation16 First, we prepared our isopositive cages by autoclaving empty cages with food and water bottles inside while the other group reports using irradiation. Second, we took germ-free mice out of the isolators in a sterile container and moved them into prepared clean cages in a biosafety cabinet while the other group brought the clean isopositive cages into the isolator and moved the mice inside the isolator. Third, while we decontaminated cages (clean empty cage and ones containing mice) by submerging them under a Clidox solution for 30 sec before introducing them into the biosafety cabinet, the Hecht group reported spraying cages with Clidox. Although submerging supplies and cages in a large tank of Clidox solution required PPE such as respirator and goggles for personnel, we did not notice any abnormal clinical signs in mice during the procedures. Finally, our group used sterile surgical gowns and gloves as PPE for the person working in the biosafety cabinet while the other group used long-sleeved rubber gloves sprayed with Clidox. We find that wearing the surgical gloves provides users with better dexterity when manipulating mice. Although we regularly use long forceps to pick up and transfer mice between cages for routine cage changes, fecal transfer experiments require ear-punching and gavaging mice. These procedures would have been much more difficult to perform wearing thick rubber gloves.
We tested the validity of this caging system for short-term fecal transplant studies, evaluating stability of the transplanted microbiome over time and looking at microbiome changes with diet. Previous studies have suggested that transferred microbiota could stabilize within one week of fecal transfer into germ-free mice. Citation5,8 Our data suggest that stabilization of microbiota may take up to 2 weeks () and established microbiota did not completely recapitulate the donor profile for both studies performed (, Figs. S1–2). While the degree of the microbiota changes slowed (comparing week 1 and 2 vs. week 2 and 4), some changes were still detected between week 2 and 4. Therefore, it is possible that the recipient microbiota would have eventually converged to those of the donors if given a longer period of time. However, it is also likely that the complete recapitulation would not occur as some bacteria may be lost during the preparation of the fecal slurry or transit through the stomach and small intestine. In addition, diets and mouse strains were different between donors and recipients and could result in additional changes to the composition of the microbiome. Similarly, a recent report suggests that human fecal transfer does not completely recapitulate donor structure yet different donor samples establish significantly distinct gut communities in germ-free mice.Citation17
It was surprising to find that sex of the recipient appeared to play a role in the structure of microbiota in one study () although this was not replicated in the second study () This difference may be explained by the study design. There were 2 main differences between the studies involving diet and sex of the donors. In the first study, all donors were fed a regular chow diet consisting of a mixture of food (ground corn, soybean meal, wheat germ etc.), while in the second study, all donors were fed purified diets (starch, simple sugar, soybean oil etc.). In the first study, feces were collected from both male and female donors while in the second study, feces were collected from only male donors. Further studies will be needed to determine whether sex of recipients and/or donors truly influenced the microbiota structure.
We found that microbiota from donors fed 2 different diets (control vitamin D levels vs high vitamin D levels) established differently in recipient mice fed the third type of diet (). Microbiota of mice receiving fecal slurries of mice fed a high vitamin D appear to have higher diversity (). This is interesting as structures of the 2 donor fecal samples were more similar to each other than 2 recipient groups (). Since the fecal collection and fecal slurry preparation were performed at the same time, we do not think that the differences seen in 2 established microbiota are due to how the fecal transfer samples were prepared. Larger studies analyzing differences in microbiota structure in mice fed the 2 different diets will be needed to answer whether the differences seen in recipient microbiota are due to the differences in donor microbiota that were not detected in the 2 pooled donor samples or due to unknown protective factors in vitamin D-associated microbiota.
Generating, maintaining and performing fecal transplant studies in germ-free mice can be expensive, labor-intensive, and technically difficult due to restricted access and manipulation of animals in rigid or flexible film isolators. The isopositive caging system may offer an alternative housing of germ-free mice that has advantages over standard isolators. Ease of accessibility and handling, a smaller footprint, and reduced cost make isopositive caging potentially more suitable for microbiota transplant studies in germ-free rodents.
Materials and Methods
Animals
Germ-free Swiss Webster mice were obtained from Dr. Sarkis Mazmanian (California Institute of Technology) and bred in our facility in flexible-film isolators (CBC, Madison, WI). Mice were housed in open-top cages with autoclaved Enrich-n' Pure bedding (Andersons, Maumee, Ohio), fed autoclaved rodent chow (Laboratory autoclavable Rodent Diet 5010 or 5021, Lab Diet, St. Louis, MO) ad lib. and provided with autoclaved water. Sterility of isolators was checked weekly by culturing fresh fecal pellets from each isolator. For anaerobic bacterial culture, Brucella agar plates containing 5% sheep blood, hemin and vitamin K (VWR) were used with the GasPak EZ anaerobe gas generating pouch system (BD BBL, Franklin Lakes, New Jersey) whereas aerobic cultures were plated on Trypticase Soy Agar plates containing 5 % sheep blood (VWR). Thioglycollate medium (BD BBL) was used to grow both aerobes and anaerobes from the same fecal samples. All cultures were incubated at 37°C for 2–3 days, followed by 5–7 d at room temp. In addition, 16S rRNA PCR was performed using DNA extracted from pooled fecal samples collected from each isolator monthly. For negative controls, sterile PBS or water was used, and for positive controls, feces collected from SPF mice were used. All procedures were approved by the Institutional Animal Care and Use Committee at the University of Washington.
Isopositive cages
Isopositive cages and a rack were purchased from Tecniplast (West Chester, PA). In this system, each cage is hooked up to an air supply that is filtered twice through a HEPA filter before it gets into the individual cage. Clean cages were autoclaved with autoclavable rodent chow, bedding (Enrich-n' Pure) and an empty water bottle inside them before each use. Water was autoclaved in separate 1 L bottles and added to the sterile bottle in the cage at the time of cage changes. The sterility of cages prior to use was determined by placing a Bowie-Dick test pack (Steris Corp, Mentor, OH) and a biological indicator (3M Attest, St. Paul, MN) in one of the 6 cages per each autoclave load. A batch of cages autoclaved with the cage passing both tests were then used to house mice.
Use of isopositive cages for maintaining germ-free status in mice
Germ-free Swiss Webster mice were transferred from the germ-free isolators into isopositive cages (2 mice/cage, 2 cages) in a biosafety cabinet prepared by thorough spraying with Clidox solution (1:3:1, base:water:activator, v:v:v) 3 hours prior to using it. The surface of the biosafety cabinet was kept wet with Clidox while working in it. At all times, 2 people were needed to carry out mouse husbandry. A designated “sterile” person, donned with autoclaved surgical gown (Blockade Surgeons Gown, Medline Industries, Inc., Mundelein, IL) and sterile surgical gloves (TriFlex Sterile Latex Surgical Gloves, Cardinal Health, Dublin, OH) worked in a biosafety cabinet, while a second “assistant” provided sterile supplies to the sterile person and transferred the cages and animals between the rack and the biosafety cabinet. Both people wore protective goggles and a mask (3M 7500 Series Half Mask with 3M Combination Cartridge, Grainger). Autoclaved clean cages and cages containing mice were submerged in the Clidox solution in a large tank (20 gallon polyethylene heavy duty rectangular tank, Bel-Art Products, Wayne, NJ) for 30 sec before being introduced to the biosafety cabinet by the assistant. Mice were maintained for 12 weeks with weekly cage changes in this manner. Fresh fecal samples were collected each week and tested for germ-free status using aerobic and anaerobic culture. Fecal samples were also checked with 16s rRNA PCR (see below) every 4 weeks.
Fecal DNA extraction
Fresh fecal samples were dispersed in RNAlater or frozen immediately at −80°C until DNA extraction. Fecal samples were lysed using Lysing Matrix E (MP Biomedical, Santa Ana, CA), and DNA was extracted using a QIAamp DNA Stool Mini Kit (Qiagen, Valencia, CA) or Zymo ZR Fecal DNA MicroPrep kit (Zymo Research, Irvine, CA) following the manufacturers' instructions.
16S rRNA PCR
Sterility of germ-free animals was also tested by amplification of 16s rRNA using DNA from fecal samples with universal primers Citation18 and ReadyMix Taq PCR reaction mix (Sigma, St. Louis, MO) or Red Hot Taq DNA polymerase (Thermo Scientific, Waltham, MA) following manufacturers' instructions.
Fecal transfer studies
Two studies were performed to test the stability of transferred microbiota. In the first study, 3 cages of germ-free Swiss Webster mice housed in isopositive cages (9 week-old, n = 3/cage, 2 cages of males, 1 cage of females) were orally gavaged with a fecal slurry (100 or 200 µl) made from pooled fecal samples from male and female SPF 129-Smad3(tm1Par)/J mice (Smad3−/−) mice fed an irradiated regular rodent chow (5058 PicoLab Mouse Diet 20, Lab Diet, St. Louis, MO) and acidified autoclaved water. For the second study, 4 cages of germ-free Swiss Webster mice housed in isopositive cages (5 week-old) were gavaged with a fecal slurry prepared from pooled fecal samples from Smad3−/− mice fed a purified control diet (AIN 93M, 2 cages, n = 3/cage, 1 cage each males and females) or a purified diet containing 15 IU vitamin D (high vitamin D diet, 2 cages, n = 3/cage, 1 cage each males and females). The latter diet is nutritionally identical to AIN93M except that it contained 15 times more vitamin D than AIN93M. Donor mice were all males. Mice were manually restrained by the scruff during oral gavage by the “sterile” person who was wearing a sterile surgical gown and sterile surgical gloves. All recipients mice were fed autoclavable rodent chow (5010, Lab diet). For both studies, frozen fecal samples were used to prepare the fecal slurry. Feces were mashed in PBS with a sterile wooden dowel (1g feces in 1 ml PBS) and centrifuged at 800g for 3 min to obtain the supernatant. For both studies, baseline fecal samples were collected from each cage just before the gavage to confirm germ-free status by 16S rRNA PCR. Individual fecal samples were collected 1, 2 and 4 weeks post fecal transfer and DNA was extracted as above. For the second study, where 2 different fecal samples were used, the “sterile” person working in the biosafety cabinet changed their surgical gown and gloves when handling cages of a different treatment group during fecal transfers and fecal collection post fecal transfers. DNA was also extracted from an aliquot of the fecal slurry to determine the donor microbiota. 16S rRNA 454 pyroseqeuncing of V1-V3 regions was carried out by MR DNA (Shallowater, TX).
16s amplicon sequencing
DNA isolated from the fecal samples was submitted to MR DNA service facility (http://www.mrdnalab.com/). Amplicon sequencing was carried out as previously described.Citation19 All samples were sequenced on a Roche 454 FLX Titanium Instrument. In addition, the donor samples in both experiments were sequenced at higher depth using an Illumina Mi-Seq.
Microbiome analysis
The UPARSE method was used for amplicon sequence handling and OTU clustering with USEARCH version 7.0.1001Citation20 During trimming, the maximum expected error was set to 0.5 (-fastq_maxee 0.5). Clustering was performed at 97% and used the samples from both experiments. Chimeras were identified by validation with the ChimeraSlayer reference database in the Broad Microbiome Utilities version r20110519 as obtained from the UCHIME distribution.Citation21 Initial taxonomic assignments were made using the RDP Classifier from the Ribosomal Database Project, downloaded on October 22, 2013.Citation22 The resulting reads per OTU were scaled so that the number of reads in each sample were equal and used for all subsequent analyses. Hierarchical clustering of samples and OTUs was performed using the percentage of reads per OTU for the 35 most abundant taxa. Persistent OTUs were identified as those present as more than 2.5% of the total population in at least one sample. Bray-Curtis distances, Shannon indices, ordination plots and multivariate analyses were calculated using the vegan library version 2.2–1Citation23 in R version 3.1.1 (http://www.R-project.org/).
Disclosure of Potential Conflicts of Interest
No potential conflicts of interest were disclosed.
Supplemental_Material.zip
Download Zip (229.5 KB)Acknowledgments
We thank Ms. Sara McBride, Dr. Karen Lencioni and Dr. Janet Baer at the California Institute of Technology for sharing their knowledge on establishment and management of a gnotobiotic facility. We also would like to thank Dr. Audrey Seamons for her careful reading and editing of this manuscript.
Funding
Studies were supported by funds from the Department of Comparative Medicine, University of Washington, and were facilitated through the use of advanced computational storage and networking infrastructure provided by the Hyak supercomputer system supported in part by the University of Washington eScience Institute.
Supplemental Material
Supplemental data for this article can be accessed on the publisher's website.
References
- Reading NC, Kasper DL. The starting lineup: key microbial players in intestinal immunity and homeostasis. Front Microbiol 2011; 2:148; PMID:21779278; http://dx.doi.org/10.3389/fmicb.2011.00148
- David LA, Maurice CF, Carmody RN, Gootenberg DB, Button JE, Wolfe BE, Ling AV, Devlin AS, Varma Y, Fischbach MA, et al. Diet rapidly and reproducibly alters the human gut microbiome. Nature 2014; 505:559-63; PMID:24336217; http://dx.doi.org/10.1038/nature12820
- Lepage P, Hasler R, Spehlmann ME, Rehman A, Zvirbliene A, Begun A, Ott S, Kupcinskas L, Dore J, Raedler A, et al. Twin study indicates loss of interaction between microbiota and mucosa of patients with ulcerative colitis. Gastroenterology 2011; 141:227-36; PMID:21621540; http://dx.doi.org/10.1053/j.gastro.2011.04.011
- Chung H, Pamp SJ, Hill JA, Surana NK, Edelman SM, Troy EB, Reading NC, Villablanca EJ, Wang S, Mora JR, et al. Gut immune maturation depends on colonization with a host-specific microbiota. Cell 2012; 149:1578-93; PMID:22726443; http://dx.doi.org/10.1016/j.cell.2012.04.037
- Ridaura VK, Faith JJ, Rey FE, Cheng J, Duncan AE, Kau AL, Griffin NW, Lombard V, Henrissat B, Bain JR, et al. Gut microbiota from twins discordant for obesity modulate metabolism in mice. Science 2013; 341:1241214; PMID:24009397; http://dx.doi.org/10.1126/science.1241214
- Dorrestein PC, Mazmanian SK, Knight R. Finding the missing links among metabolites, microbes, and the host. Immunity 2014; 40:824-32; PMID:24950202; http://dx.doi.org/10.1016/j.immuni.2014.05.015
- Nguyen TL, Vieira-Silva S, Liston A, Raes J. How informative is the mouse for human gut microbiota research? Disease Models Mechanisms 2015; 8:1-16; PMID:25561744; http://dx.doi.org/10.1242/dmm.017400
- Turnbaugh PJ, Ridaura VK, Faith JJ, Rey FE, Knight R, Gordon JI. The effect of diet on the human gut microbiome: a metagenomic analysis in humanized gnotobiotic mice. Sci Transl Med 2009; 1:6ra14; PMID:20368178; http://dx.doi.org/10.1126/scitranslmed.3000322
- Slezak K, Krupova Z, Rabot S, Loh G, Levenez F, Descamps A, Lepage P, Dore J, Bellier S, Blaut M. Association of germ-free mice with a simplified human intestinal microbiota results in a shortened intestine. Gut Microbes 2014; 5:176-82; PMID:24637599; http://dx.doi.org/10.4161/gmic.28203
- Carmody RN, Gerber GK, Luevano JM, Jr., Gatti DM, Somes L, Svenson KL, Turnbaugh PJ. Diet dominates host genotype in shaping the murine gut microbiota. Cell Host Microbe 2015; 17:72-84; PMID:25532804; http://dx.doi.org/10.1016/j.chom.2014.11.010
- Carmody RN, Turnbaugh PJ. Host-microbial interactions in the metabolism of therapeutic and diet-derived xenobiotics. J Clin Invest 2014; 124:4173-81; PMID:25105361; http://dx.doi.org/10.1172/JCI72335
- Gevers D, Kugathasan S, Denson LA, Vazquez-Baeza Y, Van Treuren W, Ren B, Schwager E, Knights D, Song SJ, Yassour M, et al. The treatment-naive microbiome in new-onset Crohn's disease. Cell Host Microbe 2014; 15:382-92; PMID:24629344; http://dx.doi.org/10.1016/j.chom.2014.02.005
- Huttenhower C, Kostic AD, Xavier RJ. Inflammatory bowel disease as a model for translating the microbiome. Immunity 2014; 40:843-54; PMID:24950204; http://dx.doi.org/10.1016/j.immuni.2014.05.013
- Kostic AD, Xavier RJ, Gevers D. The microbiome in inflammatory bowel disease: current status and the future ahead. Gastroenterology 2014; 146:1489-99; PMID:24560869; http://dx.doi.org/10.1053/j.gastro.2014.02.009
- Ott SJ, Musfeldt M, Wenderoth DF, Hampe J, Brant O, Folsch UR, Timmis KN, Schreiber S. Reduction in diversity of the colonic mucosa associated bacterial microflora in patients with active inflammatory bowel disease. Gut 2004; 53:685-93; PMID:15082587; http://dx.doi.org/10.1136/gut.2003.025403
- Hecht G, Bar-Nathan C, Milite G, Alon I, Moshe Y, Greenfeld L, Dotsenko N, Suez J, Levy M, Thaiss CA, et al. A simple cage-autonomous method for the maintenance of the barrier status of germ-free mice during experimentation. Lab Anim 2014; 48:292-7; PMID:25097255; http://dx.doi.org/10.1177/0023677214544728
- Baxter NT, Zackular JP, Chen GY, Schloss PD. Structure of the gut microbiome following colonization with human feces determines colonic tumor burden. Microbiome 2014; 2:20; PMID:24967088; http://dx.doi.org/10.1186/2049-2618-2-20
- Packey CD, Shanahan MT, Manick S, Bower MA, Ellermann M, Tonkonogy SL, Carroll IM, Sartor RB. Molecular detection of bacterial contamination in gnotobiotic rodent units. Gut microbes 2013; 4:361-70; PMID:23887190; http://dx.doi.org/10.4161/gmic.25824
- Dowd SE, Callaway TR, Wolcott RD, Sun Y, McKeehan T, Hagevoort RG, Edrington TS. Evaluation of the bacterial diversity in the feces of cattle using 16S rDNA bacterial tag-encoded FLX amplicon pyrosequencing (bTEFAP). BMC Microbiol 2008; 8:125; PMID:18652685; http://dx.doi.org/10.1186/1471-2180-8-125
- Edgar RC. UPARSE: highly accurate OTU sequences from microbial amplicon reads. Nat Methods 2013; 10:996-8; PMID:23955772; http://dx.doi.org/10.1038/nmeth.2604
- Edgar RC, Haas BJ, Clemente JC, Quince C, Knight R. UCHIME improves sensitivity and speed of chimera detection. Bioinformatics 2011; 27:2194-200; PMID:21700674; http://dx.doi.org/10.1093/bioinformatics/btr381
- Wang Q, Garrity GM, Tiedje JM, Cole JR. Naive Bayesian classifier for rapid assignment of rRNA sequences into the new bacterial taxonomy. Appl Environ Microbiol 2007; 73:5261-7; PMID:17586664; http://dx.doi.org/10.1128/AEM.00062-07
- Oksanen J, Blanchet FG, Kindt R, Legendre P, Minchin PR, O'Hara RB, Simpson GL, Solymos P, Stevens MHH, and Wagner H. vegan: Community Ecology Package. R package version 2.3-0, 2015. http://CRAN.R-project.org/package=vegan
