
ABSTRACT
The human gut microbiota is highly dynamic, and host physiology and diet exert major influences on its composition. In our recent study, we integrated new quantitative measurements on bacterial growth physiology with a reanalysis of published data on human physiology to build a comprehensive modeling framework. This can generate predictions of how changes in different host factors influence microbiota composition. For instance, hydrodynamic forces in the colon, along with colonic water absorption that manifests as transit time, exert a major impact on microbiota density and composition. This can be mechanistically explained by their effect on colonic pH which directly affects microbiota competition for food. In this addendum, we describe the underlying analysis in more detail. In particular, we discuss the mixing dynamics of luminal content by wall contractions and its implications for bacterial growth and density, as well as the broader implications of our insights for the field of gut microbiota research.
Introduction
The human colon is densely colonized by a microbial community, collectively known as the gut microbiota. This microbiota has been the focus of a “first wave” of intense research effort starting in the 1970's and 80's, when sophisticated anaerobic culturing techniques became first available,Citation1-Citation3 and a large body of literature was assembled on the composition and metabolism of the members of this microbial community.Citation1-Citation8 At the same time, careful studies on human intestinal physiology greatly increased our understanding of the dynamic flow-environment these microbes live in.Citation9-Citation12
With the development of metagenomic sequencing techniques and the necessary bioinformatic methods to analyze the resulting data, in combination with gnotobiotic animal models, the field of gut microbiota research has experienced renewed interest since the early 2000's. It became clear that the composition of the microbiota (or the microbiome, if the “community of sequences” is referred to, as a proxy for the community of species) affects various aspects of its host's health.Citation13-Citation16
Unfortunately, the large amount of knowledge that was assembled during the “first wave” of microbiota research and the more quantitative consideration of intestinal physiology have received very little attention in the more recent literature. In a recent study,Citation17 we have made an effort to combine these two epochs of microbiota research. Combining a careful re-analysis of the literature on the growth conditions that bacteria face in the human intestine with experimental analysis of bacterial growth, we created a mathematical model that incorporates these aspects. When comparing predictions generated with this model to published sequencing data on the human microbiota and its phylum-level composition, the results are reproduced remarkably well, indicating that we have captured the main determinants of microbiota composition and that the model can be useful to predict the effects of new manipulations on the gut microbiota.
In the present addendum, we discuss the main ingredients of our model in more detail, and give an outlook of open research questions in the gut microbiota field, where our quantitative physiology approach in combination with mathematical modeling can yield unprecedented insight.
A short overview of anatomy and bacterial abundance in the gut
The human intestine is generally divided into the small and large intestine. We are going to use the term colon to describe the entire large intestine in the following text, even though it is often further subdivided into cecum, colon, and rectum. Bacterial numbers and microbiota composition have been measured for the different parts of the human intestine, and it has been shown that both the amount and the types of bacteria change drastically between small and large intestines: there are far larger numbers of microbes in the colon than in the small intestine, and they are less tolerant to oxygen.Citation18,Citation19 The nutrient supply for the bacterial community in the colon is largely dependent on fibrous material that arrives from the small intestine. We therefore expect the majority of bacterial growth to take place in the proximal colon, the part that is closest to the small intestine, which we term the growth zone. This is where the strongest increase in bacterial abundance takes place,Citation18 but also where the flow of luminal contents is strongestCitation17 (see below). We thus argue that bacterial densities in the colon are largely determined by a combination of bacterial growth, flow in the colonic lumen, and active mixing of colonic contents by muscle contractions. In the following, we are going to lay out the quantitative arguments that led to this conclusion, and explain how these arguments were derived from experimental data that was produced by us and others.
The gradient nature of luminal flow and its strength in the growth zone
Our effort to describe the dynamics of a model gut microbiota started with the consideration of basic properties of the colon. Anatomically, the human colon is a tube-like organ that receives luminal contents from the small intestine. These contents are transported through the colon and eventually leave the body as fecal matter. The volume of inflow from the small intestine (roughly 1.5 l/day)Citation10,Citation20 is far greater than the volume of fecal matter (roughly 100–200 ml/day)Citation21,Citation22 leaving the body, and the difference can be explained by water absorption through the colonic epithelium.Citation23-Citation26 The speed of flow through the colon is thus determined by its dimensions, by the amount of inflow it receives from the small intestine per unit time, and by the amount of water that is absorbed by the colonic walls: as water is absorbed continuously along the length of the colon, a gradient of flow rates along the length of the colon is formed, with fast flow rates (around 30 µm/s) in the beginning and slower flow rates (around 5 µm/s) towards the end.Citation17
Active mixing of colonic contents is crucial to prevent washout
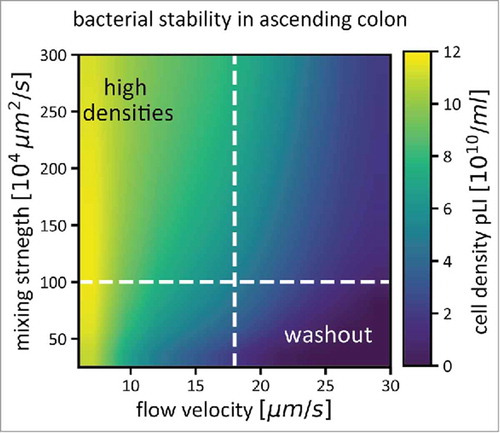
These numbers immediately raised the question how the high density of microorganisms that is known to be present in the proximal colon can be maintained under such high flow. We ruled out a number of possible explanations: 1) Constant inoculation from the small intestine is quantitatively and qualitatively insufficient to explain bacterial composition in the colon; 2) Active upward motility of bacterial cells cannot explain bacterial density and diversity, since the flow rates would require a constant and targeted swimming of all bacteria against the flow. This is even more unlikely as not all gut microbes possess genes encoding flagella; 3) The surface area of a colonic-wall-associated biofilm, combined with the known growth rates, would not be sufficient to replenish bacterial densities within the entire colonic volume. We therefore argued that active mixing through contractions of the muscle layer that surrounds the colon could generate movement of planktonic bacteria against the flow direction and thus avoid washout of the microbiota, and we generated experimental and theoretical evidence for this explanationCitation17,Citation27: Flow and mixing conditions exist that allow the establishment of a stable microbiota, given a realistic rate of microbiota proliferation ().
Figure 1. Bacterial density in the ascending colon (pLI) is determined by flow and mixing, in addition to bacterial growth. For a range of mixing strengths and flow velocities, average bacterial densities in the ascending colon are shown as a color gradient. If flow through the colon is fast, and mixing weak, the microbiota cannot reach high densities, as they are washed out quickly (bottom right corner of the plot). Both stronger mixing and slower flow rates help to increase microbiota densities. The dashed white lines indicate conditions that we assume to be prevalent in a healthy human colon (a mixing coefficient of 106 µm2/s, see for how this number was derived, and an average flow velocity of 17.5 µm/s). Simulations were performed as described in,Citation17 Figure S2).
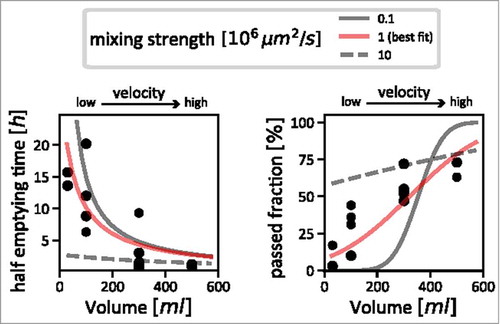
To estimate the strength of mixing in the human colon, we used published data on the passage of particles through the colon in human subjects. This data was produced by Hammer and PhillippsCitation28 to estimate the effect of fluid load in the colon on transit through the different parts of the colon and on stool composition. In short, they injected radiolabeled particles into the cecum. They recorded two things which were crucial to estimate mixing: the fraction of particles that has passed after 4 hours, and the time it took for 50% of the particles to pass the different colonic segments.
We generated a model using this data, along with the flow rates we had calculated based on our knowledge of colonic dimensions, and the fluid inflow imposed by Hammer and Phillips in their experiment. This allowed us to simulate passed fractions and half-emptying times assuming a variety of mixing strengths and a range of flow rates (). By doing this, we were able to identify a plausible window of mixing strengths, which explains the observed data. If mixing was stronger, half-emptying times would have to be much shorter than the ones observed, regardless of flow rate (, left panel, dashed grey curve); if mixing was weaker, the injected particles move through the colon as a tight bolus. The passed fraction after 4 hours would thus have to drop sharply from no passed particles at low flow rates to 100% passed particles at higher flow rates (, right panel, solid grey curve). As the data does not show either behavior, we determined the flow rate to be intermediate, and we approximated it with an effective diffusion coefficient of 106 µm2/s (, red curves). This means that active mixing in the colon causes a redistribution of luminal contents that is roughly 1000x stronger than diffusion of small molecules in water.Citation29
Figure 2. Estimating the strength of mixing in the colon. Measurements taken by Hammer and PhillipsCitation28 (black dots) are shown, together with simulation results with varying mixing strengths. We used the comparison between simulations and the measured data to estimate the actual strength of mixing in the human colon. The left panel shows the relation between inflow volume (flow velocity) and half-emptying time of content from the proximal colon; very strong mixing can be ruled out, as for slow flow velocities, it would lead to much lower half emptying times (dashed grey line) than are supported by the data (black dots). The right panel shows the relationship between inflow volume (flow velocity) with the fraction of particles that has passed the ascending colon after 4 hours. Using this data, we can rule out very weak mixing: with increasing flow velocity, one would observe a sharp jump from a regime where no particles have passed for low velocities to a regime where almost all particles have passed (solid grey line). This is also not supported by the data, which describes a much smoother dependence on flow velocity (black dots). Our best estimate for mixing strength that consolidates these two sets of data is shown as red curves in both panels.
Microbiota composition is a consequence of bacterial growth
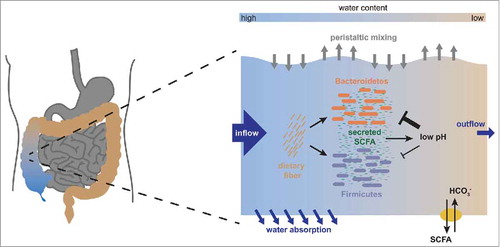
It is important to realize that the composition of the bacterial community in the gut is a direct consequence of bacterial growth. As approximately half of the bacterial biomass in the colon is lost via the feces every day,Citation22 and only very little bacterial biomass is replenished by inflow from the ileum, the microbiota has to grow to maintain its high density. In the anaerobic conditions prevalent in the colon, this growth is fermentative, and the metabolic pathways employed by the microbes to produce energy and biomass requires the excretion of large amounts of fermentation products. These fermentation products are predominantly short chain fatty acids (SCFA),Citation30 such as acetate, propionate and butyrate, and because of the high bacterial densities, the SCFA can reach concentrations that significantly affect the local chemical environment, namely the pH of the colonic lumen. This environmental change affects bacterial growth: pH change affects the ability of gut bacteria to grow, and different microbiota members vary in their sensitivity to pH changes.Citation17,Citation31,Citation32 Community composition is thus strongly affected by a feedback between bacterial growth and the environment. To complicate matters further, the host plays into this feedback by taking up SCFA from the gut lumen through the colonic epithelium.Citation33 This happens mostly via antiporters that exchange SCFA for bicarbonate, which acts as a buffer in the lumen. We experimentally quantified bacterial growth at different pH values as well as the rate of SCFA production,Citation17 and derived values for SCFA uptake and bicarbonate excretion from the literatureCitation34-Citation36 ( is a graphical summary of the feedback effect described here).
Figure 3. The physiological architecture underlying the growth dependent pH feedback. We show a schematic representation of the interactions occurring in the ascending colon. As nutrients arrive from the small intestine along with fast water flow, both Bacteroidetes and Firmicutes start fermenting these nutrients and producing biomass. In this process, they produce acidic fermentation products (mainly short chain fatty acids, SCFA), which lower the local pH in the colon. This effect is counteracted by dedicated transporters in the epithelium which pump out SCFA in exchange for bicarbonate that acts as buffer, but this effect is increased by water absorption through the colonic epithelium, which concentrates the luminal content. Importantly, low pH affects growth of Bacteroidetes much more strongly than growth of Firmicutes, changing their relative competitive fitness. A change in pH will thus lead to a change in microbiota composition. Figure adapted from.Citation17
This dynamic feedback thus leads to predictable changes in bacterial growth, which in turn lead to changes in the environment until an equilibrium is reached. Manipulations of bacterial composition (e.g. through fecal transplants), human physiology (e.g. through laxatives, diarrhea drugs) and the amount and composition of the food taken up by the host can change this equilibrium. We analyzed the effects of changes in water absorption by the colonic epithelium and of changes in nutrient intake on a model microbiota, consisting of representatives of the two most abundant phyla, the Bacteroidetes (B) and the Firmicutes (F). B and F typically make up 90% of the human gut microbiota,Citation37 and analyzing how changes affect a simplified microbiota consisting of these two phyla thus allowed us to understand how the composition of the bulk biomass reacts to these changes.
Natural variation in food intake and water absorption can explain the observed variation in microbiota composition
When investigating changes in nutrient availability in the colon and colonic water absorption, we noted a strong influence on microbiota composition in our computational model. This influence was largely mediated by the pH feedback on bacterial growth discussed in the previous section.
Changes in nutrient availability in the colon can come about both by a variation in total food intake by the host, and by a change in diet, with higher fiber content leading to more nutrients arriving in the gut. These changes have a dramatic influence on the B/F ratio in the gut. At low nutrient availability, B capitalizes on its faster growth rate and outcompetes F until all nutrient is used up, leading to a high B/F ratio. If nutrients are plentiful, B outcompetes F only until enough SCFA are produced to lower the pH enough to lose its advantage; F then profits from its better acid tolerance and its relative abundance increases. Hence, the B/F ratio is smaller if more nutrients are available.
Changes in colonic water absorption, and thus in the water content of luminal material and, as a consequence, of the consistency of resulting fecal material, also affects B/F ratios markedly.Citation38,Citation39 Importantly, the effect works via the same feedback mechanism, because water absorption has a concentrating effect on the SCFA: if water absorption is strong, SCFA are concentrated because water is taken out of the system. If water uptake is weak, SCFA are still produced, but do not reach concentrations sufficient to affect growth of B. Consequently, the B/F ratio is high at weak water absorption, and decreases strongly with stronger water absorption.
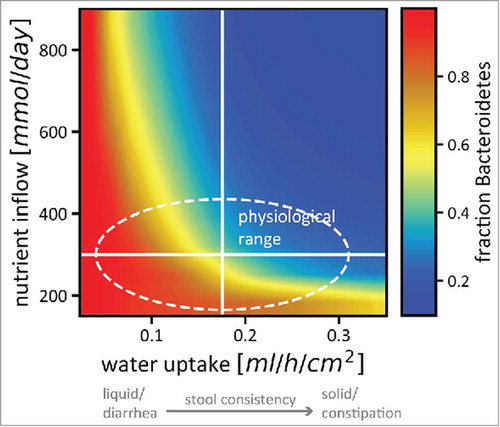
B/F ratios have been the subject of intense interest in the past.Citation40,Citation41 These two phyla make up the bulk of a typical human microbiota, and their relative abundances have been suggested to be indicative of the health of the host.Citation13,Citation42,Citation43 However, the B/F ratio has been measured to vary strongly even in humans that report themselves to be healthy.Citation37 To find a mechanistic explanation for this variation, we decided on a range of nutrient availability and stool consistencies (modeled as changes in water absorption) that can be considered acceptable for human subjects to self-report as healthy, and tested the effects of these changes on the microbiota. By implementing variation in nutrient intake and stool consistency, both of which act via the pH feedback that we have described, we were able to explain this variation in microbiota compositions in healthy subjects ().
Figure 4. Nutrient intake and stool consistency are sufficient to explain microbiota variation in healthy humans. The relative abundance of Bacteroidetes (color code) in a simplified microbiota consisting of 2 phyla changes drastically even for small changes in nutrient uptake and epithelial water absorption (which is related to stool consistency in a linear way). The solid white lines denote standard estimates for healthy humans as used in our model, the area inside the dashed line is the variation in nutrient intake and stool consistency considered healthy. Colors from red (almost only Bacteroidetes) to blue (almost no Bacteroidetes) are included in that area, indicating that small physiological changes that will not affect the perceived health status of the host can have strong effects on microbiota composition. The strong dependence of stool consistency on B/F ratios recapitulates recent observations.Citation38,Citation39 Figure adapted from.Citation17
Future directions
Our work has shown that careful consideration of physiological parameters in a quantitative way can lead to mechanistic insights into the interplay between host and microbiota. In most published studies on the gut microbiota, physiological parameters are not reported, even though many treatments are highly likely to affect the parameters we have identified to have a strong impact on the microbiota, namely water retention in the colonic lumen and nutrient availability in the gut. Better control of these parameters, and a better characterization of the basic physiological parameters of the laboratory animals in which these experiments are performed, are therefore desirable.
Using the B/F ratio as a proxy for the microbiota clearly is an oversimplification of this complex community, and a number of interesting extensions to the present model are possible to allow a more comprehensive view on this complexity. Models that take the metabolism and interactions of a more realistic microbiota into accountCitation44,Citation45 can be extended to include host physiology on a spatial scale. Adapting the model to reflect the physiology of model organisms for microbiota research, such as mice,Citation46 but also of pigsCitation47 or zebrafish,Citation48,Citation49 can help gain a mechanistic understanding of the influence of host physiology on the gut microbiota and generate predictions that are directly testable by experiments. New models should also aim to include the coupling between luminal and mucosal microbial populations,Citation50 explicitly including the oxygen gradient in the radial direction,Citation51 and rationalize the observed spatial patterns along the gut as observed in mouse models.Citation52,Citation53
A very interesting angle for future studies is a quantitative analysis of the reaction of the host to bacterial growth in the colon (i.e. a reaction that goes beyond continuously absorbing water and SCFA in exchange for bicarbonate). Since the host takes up SCFA, it has a direct readout of bacterial growth and even, by the relative amounts of different SCFA, of community composition. Several ways to translate this readout into physiological changes have been proposed.Citation54 These include changes in colonic motility,Citation55 epithelial biology,Citation56 and immunity.Citation57,Citation58 How these physiological responses to SCFA dynamically act on the microbiota, and how this feedback between host and microbiota affects community composition, is a research area with enormous potential.
By taking into account physiological parameters of both the host and the gut microbiota, we were able to identify crucial factors that dictate changes in microbiota growth and composition. In order to make the next step and link these findings with medically relevant data to generate predictions on the interdependence of the microbiota and the host in disease states, more data has to be generated, not only of the microbiota composition and its dynamics during disease, but also of physical parameters that might change and that can have large effects on microbial growth. Only then will it be possible to disentangle mere correlations between sickness and the microbiota from causation, and effective, rationally designed therapies targeting the gut microbiota will become a real possibility.
Disclosure of potential conflicts of interest
No potential conflicts of interest were disclosed.
References
- Moore WE, Holdeman LV. Human fecal flora: the normal flora of 20 Japanese-Hawaiians. Appl Microbiol. 1974;27:961–79. PMID:4598229.
- Holdeman LV, Cato EP, Moore W. Anaerobic Laboratory Manual. 1977;1–140.
- Holdeman LV, Good IJ, Moore WE. Human fecal flora: variation in bacterial composition within individuals and a possible effect of emotional stress. Appl Environ Microbiol. 1976;31:359–75. PMID:938032.
- Macfarlane GT, Gibson GR. Carbohydrate Fermentation, Energy Transduction and Gas Metabolismin the Human Large Intestine. In: Mackie R, White B, Isaacson RE, editors. Gastrointestinal Microbiology. Springer Science & Business Media; 1997. p. 269–318.
- Cummings JH. Dietary fibre. Br Med Bull. 1981;37:65–70. doi:10.1093/oxfordjournals.bmb.a071678. PMID:6266573.
- Salyers AA, Leedle JAZ. Carbohydrate metabolism in the human colon. In: Hentges DJ, editor. Intestinal Microflora in Health and Disease. Academic Press; 1983. p. 129–46. doi:10.1016/B978-0-12-3412805.50012-4.
- Macfarlane GT, Englyst HN. Starch utilization by the human large intestinal microflora. J Appl Bacteriol. 1986;60:195–201. doi:10.1111/j.1365-2672.1986.tb01073.x. PMID:2423494.
- Cummings JH. Short chain fatty acids in the human colon. Gut. 1981;22:763–79. doi:10.1136/gut.22.9.763. PMID:7028579.
- Devroede GJ, Phillips SF. Studies of the perfusion technique for colonic absorption. Gastroenterology. 1969;56:92–100. doi:10.1016/S0016-5085(69)80070-3
- Debongnie JC, Phillips SF. Capacity of the human colon to absorb fluid. Gastroenterology. 1978;74:698–703. PMID:631507.
- Devroede GJ, Phillips SF. Conservation of sodium, chloride, and water by the human colon. Gastroenterology 1969;56:101–9. PMID:5765425.
- Giller J, Phillips SF. Electrolyte absorption and secretion in the human colon. Am J Dig Dis. 1972;17:1003–11. doi:10.1007/BF02239140. PMID:5082426.
- Ley RE, Turnbaugh PJ, Klein S, Gordon JI. Microbial ecology: human gut microbes associated with obesity. Nature. 2006;444:1022–3. doi:10.1038/4441022a. PMID:17183309.
- Subramanian S, Blanton LV, Frese SA, Charbonneau M, Mills DA, Gordon JI. Cultivating Healthy Growth and Nutrition through the Gut Microbiota. Cell. 2015;161:36–48. doi:10.1016/j.cell.2015.03.013. PMID:25815983.
- Round JL, Mazmanian SK. The gut microbiota shapes intestinal immune responses during health and disease. Nat Rev Immunol. 2009;9:313–23. doi:10.1038/nri2515. PMID:19343057.
- Hsiao EY, McBride SW, Hsien S, Sharon G, Hyde ER, McCue T, Codelli JA, Chow J, Reisman SE, Petrosino JF, et al. Microbiota Modulate Behavioral and Physiological Abnormalities Associated with Neurodevelopmental Disorders. Cell. 2013;155:1451–63. doi:10.1016/j.cell.2013.11.024. PMID:24315484.
- Cremer J, Arnoldini M, Hwa T. Effect of water flow and chemical environment on microbiota growth and composition in the human colon. Proc Natl Acad Sci USA. 2017;114:6438–43. doi:10.1073/pnas.1619598114. PMID:28588144.
- Gorbach SL, Plaut AG, Nahas L, Weinstein L, Spanknebel G, Levitan R. Studies of intestinal microflora. II. Microorganisms of the small intestine and their relations to oral and fecal flora. Gastroenterology. 1967;53:856–67.
- Marteau P, Pochart P, Dore J, Bera-Maillet C, Bernalier-Donadille A, Corthier G. Comparative Study of Bacterial Groups within the Human Cecal and Fecal Microbiota. Appl Environ Microbiol. 2001;67:4939–42. doi:10.1128/AEM.67.10.4939-4942.2001. PMID:11571208.
- Phillips SF, Giller J. The contribution of the colon to electrolyte and water conservation in man. J Lab Clin Med. 1973;81:733–46. PMID:4698660.
- Cummings JH, Branch W, Jenkins DJ, Southgate DA, Houston H, James WP. Colonic response to dietary fibre from carrot, cabbage, apple, bran, and guar gum. Lancet 1978;1:5–9. doi:10.1016/S0140-67367890357-4. PMID:74533.
- Stephen AM, Cummings JH. The microbial contribution to human faecal mass. J Med Microbiol 1980;13:45–56. doi:10.1099/00222615-13-1-45. PMID:7359576.
- Billich CO, Levitan R. Effects of sodium concentration and osmolality on water and electrolyte absorption form the intact human colon. J Clin Invest 1969;48:1336–47. doi:10.1172/JCI106100. PMID:5794255.
- Levitan R, Fordtran JS, Burrows BA, Ingelfinger FJ. Water and salt absorption in the human colon. J Clin Invest. 1962;41:1754–9. doi:10.1172/JCI104634. PMID:14464699.
- Sandle GI. Salt and water absorption in the human colon: a modern appraisal. Gut. 1998;43:294–299. doi:10.1136/gut.43.2.294. PMID:10189861.
- Devroede GJ, Phillips SF, Code CF, Lind JF. Regional differences in rates of insorption of sodium and water from the human large intestine. Can J Physiol Pharmacol 1971;49:1023–9. doi:10.1139/y71-145. PMID:5142306.
- Cremer J, Segota I, Yang C-Y, Arnoldini M, Sauls JT, Zhang Z, Gutierrez E, Groisman A, Hwa T. Effect of flow and peristaltic mixing on bacterial growth in a gut-like channel. Proc Natl Acad Sci USA. 2016;113:11414–19. doi:10.1073/pnas.1601306113
- Hammer J, Phillips SF. Fluid loading of the human colon: effects on segmental transit and stool composition. Gastroenterology. 1993;105:988–98. doi:10.1016/0016-5085(93)90941-5. PMID:8405884.
- Lide DR, editor. CRC Handbook of Chemistry and Physics, 84th Edition. Boca Raton, FL: CRC Press; 2003.
- Cummings JH, Macfarlane GT. The control and consequences of bacterial fermentation in the human colon. J Appl Bacteriol. 1991;70:443–59. doi:10.1111/j.1365-2672.1991.tb02739.x. PMID:1938669.
- Duncan SH, Louis P, Thomson JM, Flint HJ. The role of pH in determining the species composition of the human colonic microbiota. Environ Microbiol. 2009;11:2112–22. doi:10.1111/j.1462-2920.2009.01931.x. PMID:19397676.
- Walker AW, Duncan SH, McWilliam Leitch EC, Child MW, Flint HJ. pH and Peptide Supply Can Radically Alter Bacterial Populations and Short-Chain Fatty Acid Ratios within Microbial Communities from the Human Colon. Appl Environ Microbiol. 2005;71:3692–700. doi:10.1128/AEM.71.7.3692-3700.2005. PMID:16000778.
- Bergman EN. Energy contributions of volatile fatty acids from the gastrointestinal tract in various species. Physiol Rev. 1990;70:567–90. doi:10.1152/physrev.1990.70.2.567. PMID:2181501.
- Besten den G, van Eunen K, Groen AK, Venema K, Reijngoud DJ, Bakker BM. The role of short-chain fatty acids in the interplay between diet, gut microbiota, and host energy metabolism. J Lipid Res. 2013;54:2325–40. doi:10.1194/jlr.R036012. PMID:23821742.
- Harig JM, Ng EK, Dudeja PK, Brasitus TA, Ramaswamy K. Transport of n-butyrate into human colonic luminal membrane vesicles. Am J Physiol 1996;271:G415–22. PMID:8843764.
- McNeil NI, Cummings JH, James WP. Short chain fatty acid absorption by the human large intestine. Gut 1978;19:819–22. doi:10.1136/gut.19.9.819. PMID:30683.
- The Human Microbiome Project Consortium. Structure, function and diversity of the healthy human microbiome. Nature. 2013;486:207–14.
- Falony G, Joossens M, Vieira-Silva S, Wang J, Darzi Y, Faust K, Kurilshikov A, Bonder MJ, Valles-Colomer M, Vandeputte D, et al. Population-level analysis of gut microbiome variation. Science. 2016;352:560–4. doi:10.1126/science.aad3503. PMID:27126039.
- Vandeputte D, Falony G, Vieira-Silva S, Tito RY, Joossens M, Raes J. Stool consistency is strongly associated with gut microbiota richness and composition, enterotypes and bacterial growth rates. Gut [Internet]. 2015;65:57–62. Available from: https://gut.bmj.com/content/early/2015/06/11/gutjnl-2015-309618.full doi:10.1136/gutjnl-2015-309618.
- Mahowald MA, Rey FE, Seedorf H, Turnbaugh PJ, Fulton RS, Wollam A, Shah N, Wang C, Magrini V, Wilson RK, et al. Characterizing a model human gut microbiota composed of members of its two dominant bacterial phyla. Proc Natl Acad Sci USA [Internet]. 2009;106:5859–64. Available from: http://www.pnas.org/content/106/14/5859.short doi:10.1073/pnas.0901529106.
- Fischbach MA, Sonnenburg JL. Eating for two: how metabolism establishes interspecies interactions in the gut. Cell Host Microbe. 2011;10:336–47. doi:10.1016/j.chom.2011.10.002. PMID:22018234.
- Duncan SH, Lobley GE, Holtrop G, Ince J, Johnstone AM, Louis P, Flint HJ. Human colonic microbiota associated with diet, obesity and weight loss. Int J Obesity. 2008;32:1720–4. doi:10.1038/ijo.2008.155.
- Ley RE, Bäckhed F, Turnbaugh P, Lozupone CA, Knight RD, Gordon JI. Obesity alters gut microbial ecology. Proc Natl Acad Sci USA. 2005;102:11070–5. doi:10.1073/pnas.0504978102. PMID:16033867.
- Kettle H, Louis P, Holtrop G, Duncan SH, Flint HJ. Modelling the emergent dynamics and major metabolites of the human colonic microbiota. Environ Microbiol. 2014;17:1615–30. doi:10.1111/1462-2920.12599. PMID:25142831.
- Kettle H, Donnelly R, Flint HJ, Marion G. Journal of Theoretical Biology. J Theor Biol. 2014;342:62–9. doi:10.1016/j.jtbi.2013.10.015. PMID:24211524.
- Kashyap PC, Marcobal A, Ursell LK, Larauche M, Duboc H, Earle KA, Sonnenburg ED, Ferreyra JA, Higginbottom SK, Million M, et al. Complex Interactions Among Diet, Gastrointestinal Transit, and Gut Microbiota in Humanized Mice. Gastroenterology. 2013;144:967–77. doi:10.1053/j.gastro.2013.01.047. PMID:23380084.
- Charbonneau MR, O'Donnell D, Blanton LV, Totten SM, Davis JCC, Barratt MJ, Cheng J, Guruge J, Talcott M, Bain JR, et al. Sialylated Milk Oligosaccharides Promote Microbiota-Dependent Growth in Models of Infant Undernutrition. Cell. 2016;164:859–71. doi:10.1016/j.cell.2016.01.024. PMID:26898329.
- Wiles TJ, Jemielita M, Baker RP, Schlomann BH, Logan SL, Ganz J, Melancon E, Eisen JS, Guillemin K, Parthasarathy R. Host Gut Motility Promotes Competitive Exclusion within a Model Intestinal Microbiota. PLoS Biol. 2016;14:e1002517. doi:10.1371/journal.pbio.1002517. PMID:27458727.
- Taormina MJ, Hay EA, Parthasarathy R. Passive and Active Microrheology of the Intestinal Fluid of the Larval Zebrafish. Biophys J. 2017;113:957–65. doi:10.1016/j.bpj.2017.06.069. PMID:28834731.
- McLoughlin K, Schluter J, Rakoff-Nahoum S, Smith AL, Foster KR. Host Selection of Microbiota via Differential Adhesion. Cell Host Microbe. 2016;19:550–9. doi:10.1016/j.chom.2016.02.021. PMID:27053168.
- Albenberg L, Esipova TV, Judge CP, Bittinger K, Chen J, Laughlin A, Grunberg S, Baldassano RN, Lewis JD, Li H, et al. Correlation Between Intraluminal Oxygen Gradient and Radial Partitioning of Intestinal Microbiota. Gastroenterology. 2014;147:1055–8. doi:10.1053/j.gastro.2014.07.020. PMID:25046162.
- Donaldson GP, Lee SM, Mazmanian SK. Gut biogeography of the bacterialmicrobiota. Nat Rev Micro. 2015;14:20–32. doi:10.1038/nrmicro3552.
- Welch JLM, Hasegawa Y, McNulty NP, Gordon JI, Borisy GG. Spatial organization of a model 15-member human gut microbiota established in gnotobiotic mice. Proc Natl Acad Sci USA. 2017;114:E9105–E9114. doi:10.1073/pnas.1711596114.
- Koh A, De Vadder F, Kovatcheva-Datchary P, Bäckhed F. From dietary fiber to host physiology: Short-chain fatty acids as key bacterial metabolites. Cell. 2016;165:1332–45.
- Hurst NR, Kendig DM, Murthy KS, Grider JR. The short chain fatty acids, butyrate and propionate, have differential effects on the motility of the guinea pig colon. Neurogastroenterol Motil. 2014;26:1586–96.
- Nepelska M, De Wouters T, Jacouton E, Béguet-Crespel F. Commensal gut bacteria modulate phosphorylation-dependent PPAR gamma transcriptional activity in human intestinal epithelial cells. Sci Rep. 2017;7:43199.
- Atarashi K, Tanoue T, Shima T, Imaoka A, Kuwahara T, Momose Y, Cheng G, Yamasaki S, Saito T, Ohba Y, et al. Induction of Colonic Regulatory T Cells by Indigenous Clostridium Species. Science. 2011;331:337–42.
- Arpaia N, Campbell C, Fan X, Dikiy S, Van Der Veeken J, Deroos P, Liu H, Cross JR, Pfeffer K, Coffer PJ, et al. Metabolites produced by commensal bacteria promote peripheral regulatory T-cell generation. Nature. 2013;504:451–5.