
ABSTRACT
Objectives: After allogeneic hematopoietic stem cell transplantation (allo-HCT), urinary levels of 3-indoxyl sulfate (3-IS) correlate with the relative abundance of bacteria from the class Clostridia (RAC), and antibiotic treatment is considered the major determinant of this outcome. A high RAC has been associated with favorable outcome after allo-HCT and protection from Clostridium difficile infection (CDI). We assessed correlations between alpha diversity, RAC and urinary 3-IS levels in a non-allo-HCT clinical cohort of antibiotic treated patients to further explore 3-IS as a biomarker of reduced diversity and predisposition to CDI.
Methods: Fecal and urinary specimens were analyzed from 40 non-allo-HCT hospitalized patients before and 9 ± 2 days after initiation of intravenous antibiotic treatment. Fecal microbiota were analyzed by 16s RNA sequencing and urinary 3-IS was analyzed by liquid chromatography-tandem mass spectrometry. Receiver operating characteristic (ROC) analysis was performed to assess the predictive value of 3-IS.
Results: At a RAC cutoff of <30%, the binary logarithm of 3-IS (medium 3-IS: ≤2.5; high 3-IS: >2.5) was predictive with an accuracy of 82% (negative predictive value: 87%, positive predictive value 67%). Accuracy was improved by combing antibiotic history with 3-IS levels (accuracy 89%, npv 88%, ppv 92%).
Conclusion: In conjunction with patient antibiotic history, 3-IS is a candidate marker to predict RAC.
Introduction
Over the last decade, evidence supporting the regulatory impact of the human gut microbiota on central body functions has been gathered. Due to these developments, the existence of different axes connecting the gut microbiota with other organ systems, i.e. the gut-brain, gut-liver, gut-lung and gut-immune axis, can now be backed up by sound evidence. Citation1–Citation4 At this point, however, few of these findings have been translated into clinically applicable biomarkers or treatment strategies. Yet, such a breakthrough seems realistic in some areas of microbiome research, e.g. the improvement of outcomes after allogeneic stem cell transplantation (allo-HCT) and the prevention and treatment of Clostridium difficile infections (CDI). Associations between gut microbiota alpha diversity and incidence of complications and mortality after allo-HCT have been reported from independent cohorts. Citation5,Citation6 Particularly the loss of bacteria from the class Clostridia seems to play a crucial role in this context and has been shown to be associated with low urinary levels of 3-indoxyl sulfate (3-IS), a gut microbiota-derived metabolite of tryptophan. Citation6–Citation8 Within the class Clostridia, members of the order Clostridiales, such as Clostridium scindens, have also been shown to play a significant role in the regulation of CDI. Citation8,Citation9 In spite of intense research efforts, prediction of CDI in clinical practice remains a major challenge. Large cohorts have failed to deliver more specific risk factors besides age >65 years, previous antibiotic exposure and/or hospitalization. Therefore, a biomarker-based approach is warranted, preferably associated with low turn-around times and low costs. The occurrence of CDI is, however, a rare endpoint and requires large study population. Therefore, we aimed to assess the correlation between alpha diversity and abundance of Clostridiales with urinary 3-IS levels after antibiotic treatment in a non-allo-HCT inpatient population further explore the predictive capacity of 3-IS as a biomarker of reduced diversity. As a secondary endpoint, the urinary metabolites p-cresyl sulfate and phenyl sulfate were explored.
Results
After excluding patients who did not receive any antibiotic treatment for at least 7 days (n = 1) or patients without any urine or stool specimens (n = 2), a total of 40 patients (age 56.9 ± 17.5 years, 17/40 (42.5%) female) was eligible for further analysis. Antibiotics that led to inclusion into the study were mainly penicillin derivatives (12/40; 30.0%), followed by carbapenems (12/40; 30.0%), cephalosporins (9/40; 22.5%), fluoroquinolones (5/40; 12.5%), trimethoprim/sulfamethoxazole (1/40; 2.5%) and macrolides (1/40; 2.5%). Twenty of 40 (50.0%) patients received at least one additional antibiotic prior to collection of the second fecal specimen. However, administration of more than one antibiotic did not have any significant impact on our results.
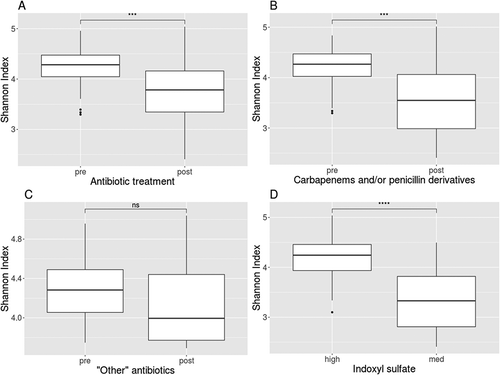
Alpha diversity in fecal specimens decreased significantly under antibiotic exposure (Shannon Index: pre 4.23 ± 0.39 (95% CI 4.10–4.36) vs post 3.75 ± 0.65 (95% CI 3.53–3.97); p < 0.001; ; inverse Simpson’s Index: pre 56.92 ± 17.51 (95% CI 51.09–62.76) vs post 41.29 ± 25.03 (95% CI 32.82–49.76); p < 0.01; Faith’s Phylogenetic Diversity: pre 9.54 ± 3.39 (95% CI 8.41–10.67) vs post 6.09 ± 3.59 (95% CI 4.88–7.31); p < 0.0001). However, further sub-analyses revealed that this was mainly due to carbapenems and/or penicillin derivatives, as opposed to other antibiotics ( and ). The correlation between urinary 3-IS levels and alpha diversity was low (Shannon Index: spearman r2 = 0.20; inverse Simpson’s Index: r2 = 0.20; Faith’s Phylogenetic Diversity: r2 = 0.18). However, after categorization of 3-IS levels (medium concentration: 18 samples, high concentration: 55 samples), we found that alpha diversity of samples belonging to the medium 3-IS group was significantly decreased (Shannon Index: medium 3.39 ± 0.64 (95% CI 3.07–3.71) vs high 4.19 ± 0.41 (95% CI 4.08–4.30); p < 0.001; ; inverse Simpson’s Index: medium 30.01 ± 20.46 (95% CI 19.84–40.18) vs high 55.49 ± 19.96 (95% CI 50.10–60.89); p < 0.001; Faith’s Phylogenetic Diversity: medium 4.29 ± 3.21 (95% CI 2.69–5.89) vs high 9.00 ± 3.35 (95% CI 8.09–9.91); p < 0.001) compared to the high 3-IS group. In our study population, no samples were categorized into the low 3-IS group. Assessment of associations between gender and age, weight, alpha diversity, as well as the concentration of urinary metabolites did not indicate an impact of gender on our results.
Figure 1. Alpha diversity (Shannon Indices) (A) before and after antibiotic treatment (n = 40), (B) treatment with carbapenems and/or penicillin derivatives (n = 26), (C) “other” antibiotics (i.e. cephalosporins: n = 7, fluoroquinolones: n = 5, trimethoprim/sulfamethoxazole: n = 1, macrolides: n = 1) and (D) grouped by the urinary 3-indoxyl sulfate concentration (medium: −8 <log2(x) >2.5; high: log2(x) >2.5). Values were compared between different groups using Student’s t-test. ns, p > 0.05; p***, p < 0.001; ****, p < 0.0001.
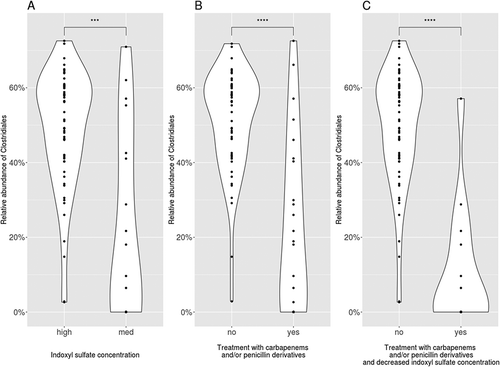
In concordance with alpha-diversity, the relative abundance of bacteria from the order Clostridiales within the medium 3-IS group was also significantly decreased (relative abundance of Clostridiales [%]: medium 23.0 ± 25.4 (95% CI 10.4–35.6) vs high 48.7 ± 15.9 (95% CI 53.0–44.4); p < 0.001; ) compared to the high 3-IS group. The same holds true for samples from patients, who were treated with carbapenems and/or penicillin derivatives (). shows combined information on antibiotic treatment and urinary 3-IS concentration.
Figure 2. Relative abundances of bacteria from the order of Clostridiales, (A) grouped by the urinary 3-indoxyl sulfate concentration (medium: −8 <log2(x) >2.5; high: log2(x) >2.5), (B) before and after treatment with carbapenems and/or penicillin derivatives, and (C) a combination of A and B (i.e. medium urinary 3-indoxyl sulfate concentration and treatment with carbapenems and/or penicillin derivatives). Values were compared between different groups using Student’s t-test. p***, p < 0.001; ****, p < 0.0001.
To further assess the power of 3-IS to predict decreased alpha diversities (Shannon Index; SI), as well as relative abundances of Clostridiales, a ROC analysis was performed. However, the required cutoff for a clinically relevant decrease in SI and relative abundance of Clostridiales had not been established in previous studies. Hence, we calculated the point of intersection of the kernel density estimates between the medium and high 3-IS group for the SI (3.7), as well as for the relative abundance of Clostridiales (29%). Furthermore, we computed ROC curves for different cutoff values (Supplementary Figures S1 and S2). The accuracy of prediction increased with lower cutoff values for SI and lower relative abundance of Clostridiales; however the number of patients in the respective groups also decreased. Only, 6/73 (8.2%) and 11/73 (15.1%) samples fell into the respective groups, if an SI below 3.0 and <10% Clostridiales were chosen as cutoffs. With increasing cutoff values, the amount of patients in the groups increased, while the accuracy decreased. Based on these results, we choose a SI of 3.5, and a relative abundance of 30% Clostridiales as cutoff values for further ROC analyses ( and Supplementary Figure S3). At a cutoff of 2.5, the binary logarithm of the 3-IS concentration (medium 3-IS: ≤2.5; high 3-IS: >2.5) predicted a SI <3.5 with an accuracy of 86% (Figure S3A). The respective negative and positive predictive values (npv and ppv) were 95% (npv) and 61% (ppv) (Figures S3B and S3C). A decreased relative abundance of <30% Clostridiales was predicted with an accuracy of 82%, (Figure S3D) using the same medium/high 3-IS cutoff). The npv and ppv were 87% and 67%, respectively (Figures S3E and S3F).
Figure 3. Receiver operating characteristic curve for the binary logarithm of the 3-indoxyl sulfate concentrations [log2(3-IS)] differentiating fecal samples with (A) decreased alpha diversity (Shannon Index <3.5) and (B) decreased relative abundance of Clostridiales (relative abundance <30%). Numbers on curve refer to a range of selected cut-off scores between “negative” and “positive” results. (x indicates the respective values for the treatment with carbapenems and/or penicillin derivatives; ♦ indicates the respective values for the treatment with carbapenems and/or penicillin derivatives and medium urinary 3-indoxyl sulfate concentration).
![Figure 3. Receiver operating characteristic curve for the binary logarithm of the 3-indoxyl sulfate concentrations [log2(3-IS)] differentiating fecal samples with (A) decreased alpha diversity (Shannon Index <3.5) and (B) decreased relative abundance of Clostridiales (relative abundance <30%). Numbers on curve refer to a range of selected cut-off scores between “negative” and “positive” results. (x indicates the respective values for the treatment with carbapenems and/or penicillin derivatives; ♦ indicates the respective values for the treatment with carbapenems and/or penicillin derivatives and medium urinary 3-indoxyl sulfate concentration).](/cms/asset/f6896c1d-a462-4ca5-8b35-0528f97f9ec7/kgmi_a_1502536_f0003_c.jpg)
For comparison, the predictive value of information from the patient chart was assessed. The administration of carbapenems or penicillin derivatives predicted decreased alpha diversities (accuracy 79%, npv 94%, ppv 48%, Figures S3A-C: red lines). The prediction of decreased relative Clostridiales abundances was more accurate using the antibiotic history than the biomarker 3-IS (accuracy: 86% vs 82%, npv: 94% vs 87%, ppv: 70% vs 67%, Figures S3D-F: red lines). The combining 3-IS concentration and antibiotic history resulted in an accuracy of 90% (Figure S3A: green line) for the prediction of a decreased alpha diversity (npv 93%, ppv 77%, Figures S3B-C: green lines) and an accuracy of 89% (Figure S3D: green line) for the prediction of decreased relative abundances of Clostridiales (npv 88%, ppv 92%, Figures S3E-F: green lines).
In order to identify other microbiota signatures that may correlate with urinary 3-IS levels, we calculated the generalized UniFrac distances between samples. As shown in Figure S4, antibiotic treatment (Figure S4A) as well as different 3-IS groups (Figure S4B) are associated with a significant shift (ANOSIM R = 0.511, p = 0.001) of gut microbiota composition. However, the 95% confidence levels (Figure S4; dotted lines) overlap markedly between the groups. Hence, a distinct clustering of samples based on their generalized UniFrac distances was not possible. The generalized UniFrac distances between the samples are depicted in the Supplementary Figure S5.
All analyses were repeated for the urinary metabolites p-cresyl sulfate (low: binary logarithm < −0.31) and phenyl sulfate (low: binary logarithm < −0.90). However, these metabolites were less accurate than urinary 3-IS predicting decreased alpha diversities (p-cresyl sulfate: accuracy 24%; phenyl sulfate: accuracy 38%; 3-IS: accurary 86%) and decreased relative Clostridiales abundances (p-cresyl sulfate: accuracy 24%; phenyl sulfate: accuracy 32%; 3-IS: accurary 82%). Combining these urinary metabolites with the antibiotic history failed to improve prediction of our selected endpoints compared to the antibiotic history alone.
Discussion
To our knowledge, this is the first study assessing the utility of urinary 3-IS as a marker for reduced microbiota diversity in a non-allo-HCT population with antibiotic exposure. In allo-HCT patients, associations between gut microbiota alpha diversity and incidence of complications and mortality after allo-HCT have been reported from independent cohorts. Citation5,Citation6 Particularly the loss of bacteria from the class Clostridia was shown to play a crucial role in this context and to be associated with low urinary 3-IS levels. Citation6–Citation8 In our study, a decrease in urinary 3-IS levels correlated with reductions in alpha diversity and relative abundance of Clostridiales, yet the predictive value of urinary 3-IS at individual patient level was only moderate. This could, however, be improved by combination with the patients’ antibiotic history. While our study did therefore not confirm urinary 3-IS as an effective independent predictor for development of CDI, it showed that it may still be of value within the context of a risk assessment score. Such a score has already been validated for prediction of CDI outcome and recurrence Citation10–Citation13, but not for prediction of disease onset. In a first step, the data from this pilot study could be used to design a large prospective cohort study in which established clinical risk factors for CDI (e.g. antibiotic exposure, age >65 years, immunosuppression, previous hospitalizations) Citation14,Citation15 and would be assessed along with urinary 3-IS levels. Since the current study suggests that the length and type of exposure to different antibiotic classes plays a crucial role in predicting RAC, specific care should be taken to establish multiple sampling time points and detailed documentation of antibiotic exposure. Furthermore, the results of the current study could be used to define RAC as an independent variable and categorize urinary 3-IS (high vs. low). Using a cox regression approach, the different predictive factors for CDI could be weighted and integrated into a risk score. This score would then require further validation in a confirmatory cohort.
Limitations of our study included the potential effect of co-medications that were not part of the observation on the gut microbiota. Citation16 None of the patients studied received antibiotics only. However, even if changes in the gut microbiota were partially induced by other drugs, this would not have altered the limited predictive value of 3-IS with respect to our endpoints. In contrast to previous studies, none of the patients studied was categorized into the low 3-IS group, as defined by Weber et al. Citation6 Compared to other patients, allo-HCT patients experience massive antibiotic exposure prior to and after the infusion of stem cells. The result is a radically disturbed gut microbiota, often dominated by a single bacterial genus and a depletion of Clostridia. Discrimination of this population from patients with only moderately disturbed or intact gut microbiota requires less discriminatory power than identification of more subtle differences in gut microbiota signatures. We hypothesize that our study population of patients with little to moderate antibiotic exposure and thus less disturbed gut microbiota may explain why discriminatory power of 3-IS was less pronounced compared to an allo-HCT population.
In a large recently published study, Pallister et al. identified and validated five (hippurate, p-cresyl sulfate, phenylacetylglutamine, 3-phenylpropionate, and hyodeoxycholate) out of 292 screened metabolites from human serum that may serve as markers of gut microbiota alpha diversity. Only one of the identified metabolites, p-cresyl sulfate was part of our panel, but did not perform better than 3-IS. Opposed to the above mentioned study, our analysis was performed from a urine specimen and not from serum. Since the analysis by Pallister et al. focused on the associations of these metabolites with specific nutritional habits in healthy volunteers, the data are not directly comparable with our results. Unfortunately, these data became available only after we had finished our analysis Citation17, such that we did not get a chance to include all of these metabolites into our analysis. However, it may be wise to include them into our future work.
Even though our study failed to confirm the potential of urinary 3-IS as an independent predictor of CDI, we identified carbapenems and penicillin derivatives as high-risk antibiotics with respect to reduction in microbiota diversity. In line with these findings, we recently confirmed exposure to these antibiotic classes as an independent risk factor for intestinal GvHD in allo-HCT patients. Citation18 Concordantly, other studies have demonstrated these antibiotics as risk factors of CDI. Citation15,Citation19 Yet other studies have confirmed a link between development of CDI and intestinal GvHD. Citation19–Citation23 While no study has succeeded in integrating all of these aspects into a fully explanatory pathophysiological hypothesis, the close linkage of these clinical problems suggests that they may share a common underlying condition, e.g. a specific microbiota signature which may result in shifts in anti-inflammatory metabolites. With respect to the involvement of such metabolites, secondary bile salts and short chain fatty acids have been described as key regulators in CDI and GvHD, respectively.Citation9,Citation24 .
These findings further underline the potential role of antimicrobial stewardship to reduce unneeded antibiotic exposure and promote short and focused treatment regimens and thus preserve a diverse and healthy gut microbiota. Besides the described findings in the areas of allo-HCT and CDI, current publications on the significant role of gut microbiota diversity in the pathophysiology of a diverse range of other medical conditions, e.g. hepatic encephalopathy, tumor growth and multiples sclerosis Citation25–Citation29, suggest that protection of microbiota diversity may emerge as a new focus of antimicrobial stewardship besides protection from development of antibiotic resistance.
Patients and methods
Setting
At three sites, 43 patients with an expected systemic antibiotic treatment for at least seven days and no current antibiotic treatment were included. Patients undergoing allo-HCT were excluded from the study. Fecal and urine specimens were collected before and 9 ± 2 days after initiation of antibiotic treatment.
16s RNA analysis from fecal samples
DNA was extracted from fecal specimens using the FastDNA Spin Kit for Soil (MP Biomedicals, Solon, OH, USA) following the manufacturer’s instructions. The extracted DNA was concentrated using a vacuum concentrator and the V3-V4 region of the bacterial 16S rRNA gene was amplified using the primers 341F and 802R published elsewhere. Citation30 The 16S amplicon was purified using the Agencourt AMPure XP PCR Purification system (Beckman Coulter, Krefeld, Germany), processed (indexed, purified, normalized and pooled) and sequenced in a 300-bp paired-end run on the Illumina MiSeq as outlined in the Illumina 16S Sample Preparation Guide. Citation31
Urine specimens
Urinary 3-IS levels were analyzed as published. Citation6 For categorization of 3-IS concentrations, the limits defined by Weber et al. for the binary logarithm of 3-IS were applied: low: < −8, medium: −8 – 2.5, high: >2.5 Citation6 Correspondingly, binary logarithms of p-cresyl sulfate and phenyl sulfate were categorized (low and high concentration) using the cutoff value resulting in the highest accuracies for the prediction of a decreased alpha diversity (p-cresyl sulfate: −3.32, and phenyl sulfate: −2.79) and relative abundance of Clostidiales (p-cresyl sulfate: −0.3, and p-cresyl sulfate: −0.9).
Sequence data analysis and taxonomic profiling
The sequencing data was processed using the DADA2 pipeline and QIIME 2.Citation32,Citation33 Briefly, quality profiles of the reads were analyzed to determine positions at which read quality was greatly diminished. Reads were then trimmed at the identified positions (trunc_len_f = 280, trunc_len_r = 240) and processed by the QIIME DADA2 plugin with the denoise-paired option and standard parameters (trunc_q = 2, max_ee = 2, chimera_method = consensus). Rarefaction curves were determined based on the feature table and analysis of the relative proportion of each bacterial taxon was made after the data were rarefied at a sequencing depth of 2,000 sequences per sample. Taxonomic classification was done by a Naïve Bayes classifier (sklearn) Citation34, which was trained on the SILVA database release 128 Citation35, where sequences were trimmed to only include the V3-V4 region of the 16S rRNA gen.
Statistical analysis
Statistical analyses were carried out using R for Statistical Computing (version 3.2.5, R Foundation for Statistical Computing, Vienna, Austria). Citation36 The QIIME biom data was imported and the diversity scores were calculated using functions provided in the phyloseq R package. Citation37 All continuous data was presented as mean (SD), presented as box- or violin-plots and tested with appropriate statistical analyses (two-sided t-tests). The optimal outcome-cutoff was determined by calculating the intersections of the Gaussian kernel density estimates (bandwidth = 0.2) between each category of the binary logarithm of the 3-IS concentration (medium: −8 – 2.5, high: >2.5). Receiver operating characteristic (ROC) analysis performed using the ROCR package. Citation38 Community distances were compared using the Analysis of similarity (ANOSIM) test based upon generalized UniFrac (alpha = 0.5) distances measurements with 999 permutations using a combination of the vegan and GUniFrac package. Citation39,Citation40 All statistical tests were two-tailed, and a P value of <0.05 was considered to be statistically significant.
Ethical statement
This non-interventional study has been approved by the respective local institutional review boards and ethics committees.
Conflicts of interest
MJGTV is a consultant to: Berlin Chemie, MSD/Merck and Astellas Pharma; has served at the speakers’ bureau of: Astellas Pharma, Basilea, Gilead Sciences, Merck/MSD, Organobalance and Pfizer; received research funding from: 3M, Astellas Pharma, DaVolterra, Gilead Sciences, Merck/MSD, Morphochem, Organobalance, and Seres Therapeutics.
JJV has personal fees from Merck/MSD, Gilead, Pfizer, Astellas Pharma, Basilea, Deutsches Zentrum für Infektionsforschung, Uniklinik Freiburg/Kongress und Kommunikation, Akademie für Infektionsmedizin, Universität Manchester, Deutsche Gesellschaft für Infektiologie, Ärztekammer Nordrhein, Uniklinik Aachen, Back Bay Strategies, Deutsche Gesellschaft für Innere Medizin and grants from Merck/MSD, Gilead, Pfizer, Astellas Pharma, Basilea, Deutsches Zentrum für Infektionsforschung, Bundesministerium für Bildung und Forschung.
Supplemental Material
Download MS Word (411.4 KB)Supplementary material
Supplemental data for this article can be accessed on the publisher’s website.
References
- Tetel MJ, De Vries GJ, Melcangi RC, Panzica G, O’Mahony SM. J Neuroendocrinol. 2017;30(2):e12548.
- Quigley EMM. Microbiota-brain-gut axis and neurodegenerative diseases. Curr Neurol Neurosci Rep. 2017;17(12):94.
- He Y, Wen Q, Yao F, Xu D, Huang Y, Wang J. Gut-lung axis: the microbial contributions and clinical implications. Crit Rev Microbiol. 2017;43(1):81–95.
- Adamczyk-Sowa M, Medrek A, Madej P, Michlicka W, Dobrakowski P. Does the Gut Microbiota Influence Immunity and Inflammation in Multiple Sclerosis Pathophysiology? J Immunol Res. 2017;2017:7904821.
- Taur Y, Jenq RR, Perales MA, Littmann ER, Morjaria S, Ling L, No D, Gobourne A, Viale A, Dahi PB, et al. The effects of intestinal tract bacterial diversity on mortality following allogeneic hematopoietic stem cell transplantation. Blood. 2014;124(7):1174–1182.
- Weber D, Oefner PJ, Hiergeist A, Koestler J, Gessner A, Weber M, Hahn J, Wolff D, Stammler F, Spang R, et al. Low urinary indoxyl sulfate levels early after transplantation reflect a disrupted microbiome and are associated with poor outcome. Blood. 2015;126(14):1723–1728.
- Jenq RR, Taur Y, Devlin SM, Ponce DM, Goldberg JD, Ahr KF, Littmann ER, Ling L, Gobourne AC, Miller LC, et al. Intestinal blautia is associated with reduced death from graft-versus-host disease. Biol Blood Marrow Transplant. 2015;21(8):1373–1383.
- Buffie CG, Bucci V, Stein RR, McKenney PT, Ling L, Gobourne A, No D, Liu H, Kinnebrew M, Viale A, et al. Precision microbiome reconstitution restores bile acid mediated resistance to Clostridium difficile. Nature. 2015;517(7533):205–208.
- Monaghan TM, Cockayne A, Mahida YR. Pathogenesis of Clostridium difficile infection and its potential role in inflammatory bowel disease. Inflamm Bowel Dis. 2015;21(8):1957–1966.
- Cornely OA, Vehreschild MJ. Editorial commentary: where to place the new treatments for Clostridium difficile infection? Clin Infect Dis. 2016;63(6):735–736.
- Miller MA, Louie T, Mullane K, Weiss K, Lentnek A, Golan Y, Kean Y, Sears P. Derivation and validation of a simple clinical bedside score (ATLAS) for Clostridium difficile infection which predicts response to therapy. BMC Infect Dis. 2013;13:148.
- Figh ML, Zoog ESL, Moore RA, Dart BWT, Heath G, Butler RM, Gao C, Kong JC, Stanley JD. External validation of velazquez-gomez severity score index and ATLAS scores and the identification of risk factors associated with mortality in Clostridium difficile infections. Am Surg. 2017;83(12):1347–1351.
- Cobo J, Merino E, Martinez C, Cozar-Llisto A, Shaw E, Marrodan T, Calbo E, Bereciartua E, Sanchez-Munoz LA, Salavert M, et al. Int J Antimicrob Agents. 2017;51(3):393–398.
- Tariq R, Singh S, Gupta A, Pardi DS, Khanna S. Association of gastric acid suppression with recurrent Clostridium difficile infection: a systematic review and meta-analysis. JAMA Intern Med. 2017;177(6):784–791.
- Watson T, Hickok J, Fraker S, Korwek K, Poland RE, Septimus E. Evaluating the risk factors for hospitalonset Clostridium difficile infections in a large healthcare system. Clinical infectious diseases : an official publication of the Infectious Diseases Society of America 2017;64(2):111–115.
- Maier L, Pruteanu M, Kuhn M, Zeller G, Telzerow A, Anderson EE, Brochado AR, Fernandez KC, Dose H, Mori H, et al. Extensive impact of non-antibiotic drugs on human gut bacteria. Nature. 2018;555:623.
- Pallister T, Jackson MA, Martin TC, Zierer J, Jennings A, Mohney RP, MacGregor A, Steves CJ, Cassidy A, Spector TD, et al. Hippurate as a metabolomic marker of gut microbiome diversity: modulation by diet and relationship to metabolic syndrome. Sci Rep. 2017;7(1):13670.
- Farowski F, Bücker V, Vehreschild JJ, Biehl L, Cruz-Aguilar R, Scheid C, Holtick U, Jazmati N, Wisplinghoff H, Cornely OA, et al. Impact of choice, timing, sequence and combination of broad-spectrum antibiotics on the outcome of allogeneic haematopoietic stem cell transplantation. Bone Marrow Transplant. 2018;53(1):52–57.
- Vehreschild MJGT, Weitershagen D, Biehl LM, Tacke D, Waldschmidt D, Tox U, Wisplinghoff H, Von Bergwelt-Baildon M, Cornely OA, Vehreschild JJ. Clostridium difficile infection in patients with acute myelogenous leukemia and in patients undergoing allogeneic stem cell transplantation: epidemiology and risk factor analysis. Biology of Blood and Marrow Transplantation: Journal of the American Society for Blood and Marrow Transplantation. 2014;20(6):823–828.
- Trifilio SM, Pi J, Mehta J. Changing epidemiology of Clostridium difficile-associated disease during stem cell transplantation. Biology of Blood and Marrow Transplantation: Journal of the American Society for Blood and Marrow Transplantation. 2013;19(3):405–409.
- Dubberke ER, Reske KA, Srivastava A, Sadhu J, Gatti R, Young RM, Rakes LC, Dieckgraefe B, DiPersio J, Fraser VJ. Clostridium difficile-associated disease in allogeneic hematopoietic stem-cell transplant recipients: risk associations, protective associations, and outcomes. Clin Transplant. 2010;24(2):192–198.
- Chakrabarti S, Lees A, Jones SG, Milligan DW. Clostridium difficile infection in allogeneic stem cell transplant recipients is associated with severe graft-versus-host disease and non-relapse mortality. Bone Marrow Transplant. 2000;26(8):871–876.
- Alonso CD, Treadway SB, Hanna DB, Huff CA, Neofytos D, Carroll KC, Marr KA. Epidemiology and outcomes of Clostridium difficile infections in hematopoietic stem cell transplant recipients. Clinical Infectious Diseases: an Official Publication of the Infectious Diseases Society of America. 2012;54(8):1053–1063.
- Seekatz AM, Theriot CM, Rao K, Chang Y-M, Freeman AE, Kao JY, Young VB. Anaerobe. 2018;S1075-9964(18)30058-1.
- Bajaj JS, Kassam Z, Fagan A, Gavis EA, Liu E, Cox IJ, Kheradman R, Heuman D, Wang J, Gurry T, et al. Fecal microbiota transplant from a rational stool donor improves hepatic encephalopathy: A randomized clinical trial. Hepatology. 2017;66(6):1727–1738.
- Chaput N, Lepage P, Coutzac C, Soularue E, Le Roux K, Monot C, Boselli L, Routier E, Cassard L, Collins M, et al. Baseline gut microbiota predicts clinical response and colitis in metastatic melanoma patients treated with ipilimumab. Ann Oncol. 2017;28(6):1368–1379.
- Miyake S, Kim S, Suda W, Oshima K, Nakamura M, Matsuoka T, Chihara N, Tomita A, Sato W, Kim S-W, et al. Dysbiosis in the gut microbiota of patients with multiple sclerosis, with a striking depletion of species belonging to clostridia XIVa and IV clusters. PLoS One. 2015;10(9):e0137429.
- Frankel AE, Coughlin LA, Kim J, Froehlich TW, Xie Y, Frenkel EP, Koh AY. Metagenomic shotgun sequencing and unbiased metabolomic profiling identify specific human gut microbiota and metabolites associated with immune checkpoint therapy efficacy in melanoma patients. Neoplasia. 2017;19(10):848–855.
- Colpitts SL, Kasper EJ, Keever A, Liljenberg C, Kirby T, Magori K, Kasper LH, Ochoa-Repáraz J. A bidirectional association between the gut microbiota and CNS disease in a biphasic murine model of multiple sclerosis. Gut Microbes. 2017;8(6):561–573.
- Klindworth A, Pruesse E, Schweer T, Peplies J, Quast C, Horn M, Glockner FO. Evaluation of general 16S ribosomal RNA gene PCR primers for classical and next-generation sequencing-based diversity studies. Nucleic Acids Res. 2013;41(1):e1.
- Illumina, 16S sample preparation guide, 2016. http://www.illumina.com/content/dam/illumina-support/documents/documentation/chemistry_documentation/16s/16s-metagenomic-library-prep-guide-15044223-b.pdf. (Accessed 2016 09 27).
- Caporaso JG, Kuczynski J, Stombaugh J, Bittinger K, Bushman FD, Costello EK, Fierer N, Pena AG, Goodrich JK, Gordon JI, et al. QIIME allows analysis of high-throughput community sequencing data. Nat Methods. 2010;7(5):335–336.
- Callahan BJ, McMurdie PJ, Rosen MJ, Han AW, Johnson AJA, Holmes SP. DADA2: high-resolution sample inference from Illumina amplicon data. Nat Methods. 2016;13:581.
- Pedregosa F, Varoquaux L, Gramfort A, Michel V, Thirion B, Grisel O, Blondel M, Prettenhofer P, Weiss R, Dubourg V, et al. Scikit-learn: Machine Learning in Python. J Mach Learn Res. 2011;12:2825–2830.
- Quast C, Pruesse E, Yilmaz P, Gerken J, Schweer T, Yarza P, Peplies J, Glockner FO. The SILVA ribosomal RNA gene database project: improved data processing and web-based tools. Nucleic Acids Res. 2013;41(Database issue):D590–6.
- R Core Team. R: a language and environment for statistical computing. Vienna, Austria. R Foundation for Statistical Computing 2017. Available from http://www.r-project.org.
- McMurdie PJ, Holmes S. phyloseq: an R package for reproducible interactive analysis and graphics of microbiome census data. PLoS One. 2013;8(4):e61217.
- Sing T, Sander O, Beerenwinkel N, Lengauer T. ROCR: visualizing classifier performance in R. Bioinformatics. 2005;21(20):3940–3941.
- Oksanen J, Blanchet FG, Friendly M, Kindt R, Legendre P, McGlinn D, Minchin PR, O’Hara RB, Simpson GL, Solymos P, et al. vegan: community ecology package. R Package Version 2.4–5. Available from https://CRAN.Rproject.org/package=vegan
- Chen J, Bittinger K, Charlson ES, Hoffmann C, Lewis J, Wu GD, Collman RG, Bushman FD, Li H. Associating microbiome composition with environmental covariates using generalized UniFrac distances. Bioinformatics. 2012;28(16):2106–2113.