
ABSTRACT
Inflammatory bowel disease (IBD) has been linked to active signaling with bacterial components and reduced mitochondrial ATP production; however, synergism between both of these disease characteristics remains unclear. We aimed to determine in human IBD transcriptomes the link between a transcriptional signature unique to intestinal cells (ICs) with reduced mitochondrial ATP production (Mito-0) and bacteria triggered signaling using a bioinformatics approach. We generated an IC Mito-0 panel comprised of 199 differentially expressed (DE) transcripts mediated by reduced mitochondrial ATP function (DEGseq, log2 fold-change > |2|, p < .001). Transcripts from this panel were involved in diverse biological functions including regulation of mitochondrial energy (lower ATP), extracellular matrix, cell–cell contact, cytoskeleton, growth, metabolism, and inflammation. Next, unsupervised hierarchical clustering showed that the Mito-0 panel distinctly separated inflamed IBD from non-inflamed transcriptomes, which was also supported by principal component analysis (PCA) revealing distinct variation between sample types based on presence of the Mito-0 signature (PCA, p = 8.77e–09). Utilizing three independent IBD cohorts, we validated that 60 novel transcripts from the Mito-0 panel were significantly increased in inflamed tissue. Subsequently, KEGG generated bacterial TLR4 and NOD2 transcriptional signatures strongly associated with inflamed IBD transcriptomes and with the Mito-0 signature as determined by Spearman’s analysis (coefficient of correlation, r = 0.92, p < .05). Herein, using a comprehensive analysis we demonstrated existence of an axis between bacteria triggered signaling and reduced mitochondrial energy function. Furthermore, we identified and validated novel transcripts within this axis as potential drivers and therapeutic targets for human IBD.
Introduction
Intestinal inflammation associated with inflammatory bowel disease (IBD) is driven by genetic susceptibility, exacerbated immune responses, impaired intestinal barrier function,Citation1,Citation2 and signaling stimulated by bacterial components.Citation3 Emerging findings have also linked intestinal inflammation to metabolic changes associated with reduced energy production from intracellular organelles known as mitochondria.Citation4–Citation7 However, mechanisms linking reduced mitochondrial energy function to other drivers of IBD pathophysiology are not well understood or explored.
Intestinal homeostasis is maintained by complex cross-talk between gut bacteria and intestinal tissue.Citation8 Alterations in this cross-talk could lead to activation of signaling conferring increased susceptibility to intestinal inflammation.Citation8 Specifically, intestinal cells (ICs) are exposed to luminal bacterial components known as pathogen-associated molecular patterns (PAMPs) including endotoxins, flagellin, lipoteichoic acid, unmethylated CpG motifs, peptidoglycan, muramyl-peptide (MDP), and lipopolysaccharide (LPS).Citation9–Citation12 Intestinal tissue is also equipped with specific receptors recognizing select PAMPs including the family of cell surface proteins called toll-like receptors (TLRs) and the cytoplasmic receptor known as nucleotide-binding oligomerization domain-containing protein 2 (NOD2). Overstimulation of TLR4 and NOD2 is implicated in the development of intestinal inflammation through activation of downstream signaling leading to release of pro-inflammatory mediators.Citation9 However, potential links between bacteria-triggered TLR4/NOD2 and metabolic reprograming in mediating intestinal inflammation is unexplored.
Mitochondria play complex roles in diverse cell functions including energy production, regulation of reactive oxygen species (ROS) and metabolites, and cell signaling linked to mitophagy and cell death.Citation13,Citation14 While certain mitochondrial processes such as increased ROS levels have been shown to foster inflammation,Citation14 a role of reduced mitochondrial energy function linked to ATP production is poorly understood. It has been suggested that gut bacteria and mitochondrial energy function in most tissues could be co-dependent; gut bacterial signaling could affect mitochondrial function, while in return, mediators released from tissues (e.g., endocrine, immune) that are regulated by mitochondria could affect gut microbiota.Citation15 Also, in mice polymorphisms in two mitochondrial genes linked to low intestinal ATP levels exacerbate local inflammation, while a polymorphism resulting in increased ATP levels is thought to be protective.Citation6,Citation7 We have demonstrated that ICs with select reduction in mitochondrial ATP function exhibit strong inflammatory responses and their global transcriptomic changes resemble those observed in human IBD.Citation16 Moreover, these ICs also have activated bacterial signaling; however, whether in IBD this signaling is connected to reduced mitochondrial energy function in driving and/or in sustaining disease is unclear.
Here we aimed to determine in IBD tissue if bacterial signaling is linked to reduced mitochondrial energy function using a bioinformatics approach. In inflamed IBD transcriptomes, we found an abundance of the IC transcriptional signature mediated by reduced mitochondrial function that strongly corresponded with bacterial TLR4 and NOD2 signaling. Utilizing three independent patient cohorts, we validated that 60 novel transcripts were significantly increased in inflamed IBD tissue. For the first time, these data describe a novel bacterial-mitochondrial-inflammatory axis that expands our understanding of the complex pathophysiology underlying IBD and provides the basis for new targeted approaches for therapeutic intervention.
Results
Generating an intestinal cell transcriptional panel mediated by deficient mitochondrial energy production
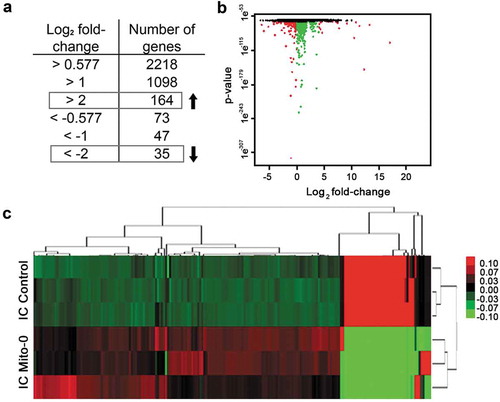
Intestinal inflammation associated with IBD is linked to low ATP levels.Citation4 We and others have shown in animal models that reduced intestinal ATP due to deficient mitochondrial energy (ATP) production facilitates intestinal inflammation;Citation16,Citation17 however, how this drives disease pathobiology is unclear. We previously generated ICs with reduced mitochondrial energy function by selective targeting of mitochondrial but not nuclear DNA polymerase with low-dose ethidium bromide in parental cells.Citation18,Citation19 Consequently, in these cells we confirmed their viability, loss of mitochondrial DNA, and reduced ATP synthase activity.Citation16 Following RNAseq we utilized their transcriptomes (SRP093357) to generate a specific transcriptional panel (i.e., Mito-0 transcriptional panel). Initially, DE transcripts of IC with reduced mitochondrial energy function relative to control were analyzed by DEGseq to calculate fold change between the two groups meeting stringent differential expression and statistical thresholds of log2 fold-change > |2| and an adjusted p < 0.001. This IC Mito-0 panel was comprised of 199 transcripts among which 164 were increased and 35 decreased relative to control as shown by scatter plot in which green dots represent transcripts with an adjusted p < 0.001 while red dots represent transcripts with both an adjusted p < 0.001 and an absolute value of log2 fold change > |2| (). Additionally, unsupervised hierarchical clustering of DE transcripts between IC with reduced mitochondrial energy function and control cells showed a distinct Mito-0 heatmap (). From this signature, we identified individual transcripts () involved in regulation of diverse biological functions including generation of mitochondrial energy (decreased ATP production) (MT-CO, MT-ND, MT-RNR1, MT-CY, MT-ATP), extracellular matrix (VCAM, MUC13, COL13,17, FGF9), cell–cell contact (TM4SF, FLRT3, THBS, NRP), cytoskeleton (VIM, MID2, MYO15, TINAGl1), growth (IGFBP6, GDF1, GDF15, CDK1A, CDK6), metabolism (PRKAA2, CPA4, TGM2, SGK1, SLC7A11), and inflammatory response (TNFR, IL17RD, IFIT2,3, NTSE, TLR6). Also in this panel, several transcripts were encoded by unannotated genes with uncharacterized function. These data represent an IC specific transcriptional signature mediated by aberrant mitochondrial energy function and include transcripts with established and undetermined functions in IBD.
Table 1. Intestinal cell Mito-0 panel comprised of 199 genes differentially expressed (DE) due to reduced mitochondrial energy function (DEGseq R studio; absolute value of Log2(fold change) normalized > |2|, p < 0.001) (*Denotes transcripts in both the Mito-0 panel and inflamed IBD transcriptomes; prefix “MT” indicates mitochondrial genome encoded transcript; prefix “ENSG” represents uncharacterized transcripts; #Denotes transcripts found in the Mito-0 panel but not in inflamed IBD transcriptomes).
Figure 1. Determining an intestinal cell Mito-0 transcriptional signature consisting of 199 genes mediated by deficient mitochondrial energy function. (a, b) Determination of the Mito-0 signature via DEGseq analysis of 60449 transcripts from colonic cells with mitochondrial energy deficiency relative to control consisting of 164 up and 35 downregulated differentially expressed transcripts (n = 3 for each group; adjusted p < 0.001 and absolute value of log2 fold-change > |2|). Scatter plot represents the obtained DE transcripts according to these criteria: green dots represent transcripts with a significant adjusted p-value (<0.001) while red dots represent transcripts with both a significant adjusted p-value and an absolute value of log2 fold-change > |2|. (c) Heatmap representing hierarchical clustering of the 199 transcripts DE in the Mito-0 signature between control intestinal cells (IC) and IC Mito-0 cells.
Human inflamed IBD tissue transcriptomes contains a high abundance of the IC Mito-0 signature
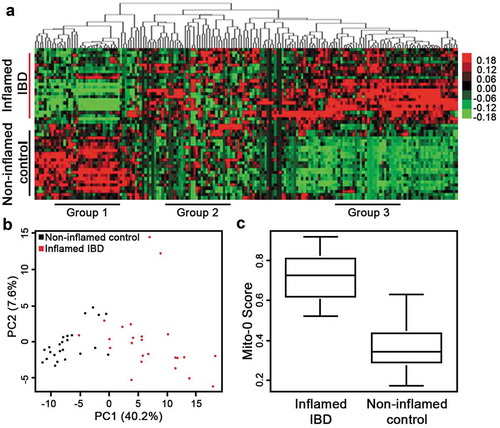
Next, we assessed transcriptomes from tissue of IBD patients for the presence of the Mito-0 signature. We utilized publicly available transcriptomic data from human inflamed IBD and matched non-inflamed control tissue biopsies (GSE107593). Analysis of these IBD transcriptomes indicated 184 out of 199 transcripts in the Mito-0 panel were distinctly present in human inflamed IBD tissue relative to matched non-inflamed control ( (asterisk)). Unsupervised hierarchical clustering revealed that the Mito-0 signature separated two distinct clusters visibly differentiating inflamed IBD from non-inflamed matched control (). Moreover, this analysis also outlined three groups of transcripts from the Mito-0 panel that were altered in inflamed IBD, those significantly decreased (Group 1), increased (Group 3), or with a mixed response (Group 2) (). In order to determine if these transcripts were universally altered in IBD affected tissue we assessed their levels in three independent patient cohorts (GSE4183, GSE14580, GSE38713). We initially determined statistically meaningful differences in transcript levels from a large number of inflamed IBD tissue samples compared to healthy control using the robust multi-array average method and differential expression testing package.Citation20,Citation21 We found that most of the transcripts with elevated expression from Group 3 ()) were also upregulated in inflamed IBD tissue in these three cohorts with strong statistical differences evident by p-values ranging from 4.14e–02 and 2.96e–34 (). These findings demonstrate independent validation and universal alteration of these transcripts across IBD patient tissues. Several of these transcripts have been identified in IBD disease activity including LCN2, ALCAM, and TLR6,Citation22–Citation24 however, the majority of these transcripts were novel and not yet described in intestinal inflammation. Moreover, the abundance of the Mito-0 signature in inflamed IBD tissue transcriptomes was further supported by Principal Component Analysis (PCA) and Mito-0 scoring. Precisely, PCA of IBD samples with the Mito-0 panel showed distinct grouping based on inflammation status (i.e., inflamed vs non-inflamed) (; p = 8.77e–09). Also, a score that summarizes the expression of the Mito-0 signature into one value was significantly higher in inflamed IBD compared to non-inflamed control (; p = 4.14e–08). These data demonstrate a high abundance of the IC Mito-0 signature in actively inflamed IBD tissue and identified individual transcripts considerably upregulated in inflamed IBD across multiple cohorts.
Table 2. Transcripts from the Mito-0 panel differentially expressed in inflamed IBD compared to matched control. Transcripts were sorted by fold-change across three combined cohorts (n=81 patients; GSE4183, GSE14580, GSE38713) (*Denotes transcripts with reported alterations in inflamed IBD).
Figure 2. Inflamed IBD transcriptomes reveal high abundance of the Mito-0 signature. (a) Hierarchical clustering, as shown by representative heatmap, revealed two distinct clusters of human IBD samples separated by the Mito-0 signature differentiating between inflamed IBD and matched non-inflamed control transcriptomes (GSE107593). (b) Principal component analysis (PCA) of inflamed IBD and matched non-inflamed control transcriptomes with the Mito-0 signature was performed to estimate variation between samples. Two axis values of the PCA showed the Mito-0 signature significantly differentiated inflamed IBD from matched non-inflamed control (PCA, p = 8.77e–09). (c) Presence of the Mito-0 signature represented as a score in inflamed IBD compared to non-inflamed matched control transcriptomes (p = 4.14 e–08).
In inflamed IBD tissue transcriptomes, the Mito-0 signature is strongly linked to active bacterial TLR4 and NOD2 signaling
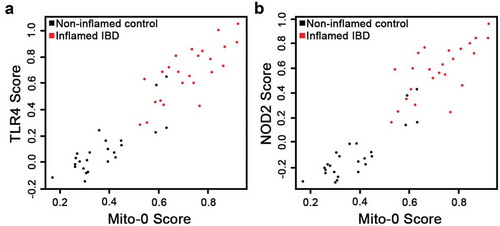
Previously, we demonstrated that intestinal inflammatory responses driven by TNF, an established player in IBD pathobiology, is mediated in part, by reducing mitochondrial energy function.Citation16 However, potential links between signaling triggered by bacterial components such as TLR4 and NOD2 receptors, both critical in IBD pathobiology,Citation9,Citation25,Citation26 and reduced mitochondrial function is not well understood. Initially, using KEGG we generated transcriptional panels specific for TLR4 and NOD2 signaling pathways and Kruskal–Wallis testing revealed their strong association within inflamed IBD transcriptomes compared to non-inflamed controls (); TLR4: p = 1.81e–08 and NOD2: p = 1.12e–08). Moreover, PCA differentiated inflamed IBD and non-inflamed matched control by the presence of TLR4 and NOD2 signatures (; TLR4: p = 3.28e–08 and NOD2: p = 9.91e–09). Finally, in inflamed IBD transcriptomes we assessed potential associations between bacterial TLR4 and NOD2 pathways and the Mito-0 signature. Using Spearman’s correlation, we found that the IC Mito-0 score showed a strong correlation with both TLR4 and NOD2 pathway scores; coefficient of correlation, r = 0.92 for both TLR4 and NOD2, p < .05 (). Taken together, these data revealed in human inflamed IBD intestine a strong link between bacterial TLR4 and NOD2 signaling and a reduction in mitochondrial function.
Figure 3. Bioinformatics assessment of bacterial TLR4 and NOD2 signaling pathway in human IBD inflamed transcriptomes. (a,b) Presence of the TLR4 and NOD2 signature (comprised of 98 and 65 specific transcripts, respectively) scores in inflamed IBD compared to non-inflamed matched control transcriptomes (p = 1.81e–08 TLR4; p = 1.12e–08 NOD2. (c,d) Principal component analysis (PCA) of inflamed IBD and matched non-inflamed control transcriptomes with the TLR4 and NOD2 signatures was performed to estimate variation between samples. Two axis values of the PCA showed that both the TLR4 and NOD2 signatures could significantly differentiate inflamed IBD from matched non-inflamed control (PCA, p = 3.28e–08 TLR4; p = 9.91e–09 NOD2).
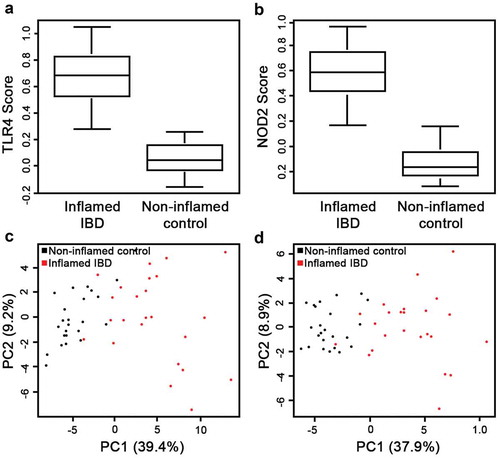
Figure 4. Bacterial TLR4 and NOD2 signaling strongly correlate with mitochondrial dysfunction in IBD transcriptomes. (a, b) Scatterplots representing the TLR4 and NOD2 signature scores according to the Mito-0 signature score and distribution of inflamed IBD and matched non-inflamed control transcriptomes; Spearman’s coefficient of correlation, r = 0.92 for both TLR4 and NOD2, p < .05.
Discussion
Emerging evidence has revealed a strong association between intestinal inflammation and reduced mitochondrial energy function; yet, how this could drive IBD pathophysiology remains unknown. Thus, we created a distinct IC transcriptional signature characteristic for reduced mitochondrial energy function (IC-Mito-0) and found its high abundance in inflamed IBD transcriptomes. We also showed that in inflamed IBD this signature was considerably linked to active bacterial TLR4 and NOD2 signaling. Furthermore, we identified that novel IC Mito-0 transcripts were significantly altered in inflamed IBD tissue across additional independent patient cohorts, revealing their universal alterations. These data support that in human inflamed IBD this axis including bacteria triggered signaling and reduced mitochondrial function could be a hallmark of disease activity and potential target for treatment options.
We demonstrated transcripts included in the Mito-0 signature are DE in human inflamed IBD tissue. Reduced ATP levels in IBD-affected tissue have been linked to mitochondrial changes that occur before the clinical appearance of disease,Citation4,Citation17,Citation27 however, the effects of this were not well understood. More direct evidence indicating lower mitochondrial ATP production in intestinal inflammation is shown by Bar et al. utilizing mice with the same nuclear but different mitochondrial genomes.Citation7 Mice with polymorphisms in mitochondrial mt-Cox3 and mt-Nd3 genes, leading to elevated ATP production, are protected from chemically induced intestinal inflammation. Bar et al. suggest that increased mitochondrial ATP production could provide metabolic energy for IC proliferation resulting in efficient restitution of barrier function. Similar suggestions were made by Cunningham et al. after finding that mitochondrial Peroxisome Proliferator-activated Receptor γ Coactivator 1α (PGC1α), a nuclear encoded protein critical for mitochondrial biogenesis, was protective in a mouse model of intestinal inflammation.Citation28 We demonstrated that transcripts from the Mito-0 panel are critical for regulation of not only proliferation but also diverse cellular function such as extracellular matrix, cell–cell contact, and cytoskeleton regulation. Moreover, among transcripts validated in three different IBD cohorts a few have recently been implicated in intestinal inflammation including activated leukocyte cell adhesion molecule (ALCAM) and toll-like receptor 6 (TLR6), most likely acting through Th1/Th17 immune responses.Citation22,Citation23 However, the majority of validated transcripts from the Mito-0 panel were novel with unidentified roles in IBD. Thus, it is plausible that dysfunctional mitochondrial energy production have systemic effects on tissue that could trigger and drive IBD pathobiology.
Currently, we showed that in inflamed IBD the IC Mito-0 signature significantly correlated with active bacterial TLR4 and NOD2 signaling. The effect of gut bacteria triggered signaling on IC mitochondrial function and possible roles in intestinal homeostasis and disease development is understudied.Citation29 Gut pathogens are capable of destabilizing host cell mitochondrial functions related to calcium signaling for their survival and transmission.Citation30 Similarly, under normal circumstances select gut pathobionts tend to control mitochondrial activity in favor of infection and inflammation through the production of hydrogen sulfide (H2S) and nitrogen oxide (NO).Citation27 Also, gut commensal bacteria metabolites, including short-chain fatty acids (SCFA) and secondary bile acids, could affect host IC mitochondrial energy functions in homeostasis and during inflammation.Citation31 Furthermore, bacterial LPS along with induced inflammatory TNF and IL-6 also have been shown to impair mitochondria ATP production.Citation32 On the other hand, mitochondrial functions might modify the gut microbiota composition due to alterations in mitochondrial innate immune responses. For example, polymorphisms in mt-ND5 and mt-CYTB have been shown to induce specific gut microbiota compositions, which could play a role in inducing inflammation.Citation33 Also, altered mitochondria function could influence intestinal immune cells, which in turn can affect gut microbiota composition.Citation28 We demonstrated before that reduced mitochondrial energy function leads to increased inflammatory mediators and elevated TLRs signaling.Citation16 Additionally, recent work has demonstrated that loss of barrier function to commensal bacteria triggered by dysfunctional mitochondrial activity included aberrant NOD2 function, suggesting an important role for mitochondrial-NOD2 regulation in maintaining IC homeostasis and restricting inflammatory processes.Citation34 Nevertheless, our findings reveal that in human inflamed IBD reduced mitochondrial energy function is strongly linked not only to TNF signaling,Citation16 but also to signaling triggered by bacterial components, highlighting a direct role for mitochondria in sensitizing the intestine to commensal bacteria and exacerbating inflammation.
Reduced mitochondrial function has been implicated in driving disease activity in a number of inflammatory disorders including multiple sclerosis, rheumatoid arthritis, and IBD.Citation6 We determined in human IBD tissue transcriptomes the significant presence of a mitochondrial signature mediated by aberrant energy function that highly corresponds with activation of bacterial pattern recognition receptors, TLR4 and NOD2. These comprehensive analyses describe a new bacterial-mitochondrial-inflammatory axis and identified novel transcripts altered in inflamed IBD tissue across independent patient cohorts. Collectively this furthers our understanding of the complex pathophysiology underlying IBD and provides the basis for new targeted approaches for therapeutic intervention.
Materials and methods
Patient cohorts
We accessed publicly available transcriptomes (Illumina, RNAseq) from inflamed or matched non-inflamed control intestinal tissue from patients diagnosed with IBD from the NCBI GEO data repository (GSE107593). In total, 48 patient samples were utilized for analysis. Also, for validation of transcript expression, publicly available transcriptomes from an additional 81 IBD tissue samples (Affymetrix, microarray) from three independent cohorts were utilized (NCBI GEO: GSE4183, GSE14580, GSE38713).
Microarray processing and differential expression
To validate transcript expression in additional IBD patient transcriptomes, we generated a single list of DE transcripts using microarray data from three independent IBD cohorts (GSE4183, GSE38713, GSE14580). To reduce for batch effect and inconsistencies among probe identifiers, only cohorts utilizing the same microarray platform (Affymetrix Human Genome U133 Plus 2.0 Array platform) were used. Data were initially processed and normalized using the robust multi-array average method (justRMA) from the affy Bioconductor package (v. 1.60.0).Citation20 Differential expression testing between IBD and control samples was performed using the limma package (v. 3.38.2).Citation21,Citation35 Briefly, linear models for each gene were fit using the lmFit function and empirical Bayes smoothing was applied to standard errors using the eBayes function. Duplicate genes were removed and only those genes meeting an adjusted p < 0.05 were included in analysis.
RNAseq processing and differential expression testing
Data analysis was performed in the Tulane Cancer Center Next Generation Sequence Analysis Core using core computational resources (www.tulane.edu/som/cancer/research/core-facilities/cancer-crusaders). Raw RNAseq reads (GSE107593) were mapped to an index containing the human haploid genome sequence (Genome Reference Consortium homo sapiens genome build 38, GRCh38). The software program, RSEM (v.1.2.25)Citation36 was utilized to quantify RNAseq data. Transcript reads as measured by Fragments Per Kilobase of transcript per Million mapped reads (FPKM) were utilized for subsequent transcriptome analysis.
Generation of the transcriptional signature representing reduced mitochondrial function
For generating the transcriptional signature specific for ICs with reduced mitochondrial energy function (Mito-0) we utilized the DEGseq R packageCitation37 to calculate differential expression and fold change differences between the two conditions; Sequence Read Archive (SRA) SRP093357. The Bonferroni correction was applied to adjust for multiple hypothesis testing. The created signature contains select transcripts with an adjusted p < 0.001 and an absolute value of log2 fold-change > |2|.
Hierarchical clustering
Hierarchical clustering of transcriptomes from tissue samples was performed with an uncentered correlation as a symmetric matrix and Pearson correlation as the similarity measure. Complete linkage method was performed utilizing Cluster3 softwareCitation38 and the corresponding heatmaps were visualized with JavaTree software.Citation39
Principal component analysis (PCA)
PCA of inflamed and non-inflamed control IBD transcriptomes were performed using the FactoMineR R packageCitation40 with PCA function. The first two coordinates of samples and their percentage of variation were extracted and plotted.
Gene signature score
For summarizing gene expression of the Mito-0 signature into a single score, the following formulation was applied:
with x representing the expression value of the transcript and m representing the median of the transcripts among all samples according to the approach employed by Agrawal et al.Citation41
Spearman’s correlation and statistical tests
Spearman’s correlation test was performed with the cor.test function in ‘R’ with “spearman” method. As a non-parametric statistical test, a Kruskal–Wallis test was utilized with the kruskal.test function in ‘R’ for all the statistical comparisons.Citation42
Conflict of Interest
Suzana D. Savkovic wishes to disclose ownership in Pegasus Biosolution, LLC. No other conflicts of interest, financial or otherwise, are declared by the authors.
Disclosure of Potential Conflicts of Interest
No potential conflicts of interest were disclosed.
Additional information
Funding
References
- Ponder A, Long MD. A clinical review of recent findings in the epidemiology of inflammatory bowel disease. Clin Epidemiol. 2013;5:237–247. doi:10.2147/CLEP.S33961.
- Liu TC, Stappenbeck TS. Genetics and pathogenesis of inflammatory bowel disease. Annu Rev Pathol. 2016;11:127–148. doi:10.1146/annurev-pathol-012615-044152.
- Coleman OI, Haller D. Bacterial signaling at the intestinal epithelial interface in inflammation and cancer. Front Immunol. 2017;8:1927. doi:10.3389/fimmu.2017.01927.
- Roediger WE. The colonic epithelium in ulcerative colitis: an energy-deficiency disease? Lancet. 1980;2:712–715.
- Geremia A, Biancheri P, Allan P, Corazza GR, Di Sabatino A. Innate and adaptive immunity in inflammatory bowel disease. Autoimmun Rev. 2014;13:3–10. doi:10.1016/j.autrev.2013.06.004.
- Yu X, Wieczorek S, Franke A, Yin H, Pierer M, Sina C, Karlsen TH, Boberg KM, Bergquist A, Kunz M, et al. Association of UCP2-866 G/A polymorphism with chronic inflammatory diseases. Genes Immun. 2009;10:601–605. doi:10.1038/gene.2009.29.
- Bar F, Bochmann W, Widok A, von Medem K, Pagel R, Hirose M, Yu X, Kalies K, König P, Böhm R, et al. Mitochondrial gene polymorphisms that protect mice from colitis. Gastroenterology. 2013;145:1055–1063 e3. doi:10.1053/j.gastro.2013.07.015.
- Ananthakrishnan AN, Bernstein CN, Iliopoulos D, Macpherson A, Neurath MF, Ali RAR, Vavricka SR, Fiocchi C. Environmental triggers in IBD: a review of progress and evidence. Nat Rev Gastroenterol Hepatol. 2018;15:39–49. doi:10.1038/nrgastro.2017.136.
- Cario E. Bacterial interactions with cells of the intestinal mucosa: toll-like receptors and NOD2. Gut. 2005;54:1182–1193. doi:10.1136/gut.2004.062794.
- Hayashi F, Smith KD, Ozinsky A, Hawn TR, Yi EC, Goodlett DR, Eng JK, Akira S, Underhill DM, Aderem A. The innate immune response to bacterial flagellin is mediated by Toll-like receptor 5. Nature. 2001;410:1099–1103. doi:10.1038/35074106.
- Girardin SE, Boneca IG, Viala J, Chamaillard M, Labigne A, Thomas G, Philpott DJ, Sansonetti PJ. Nod2 is a general sensor of peptidoglycan through muramyl dipeptide (MDP) detection. J Biol Chem. 2003;278:8869–8872. doi:10.1074/jbc.C200651200.
- Takeshita F, Gursel I, Ishii KJ, Suzuki K, Gursel M, Klinman DM. Signal transduction pathways mediated by the interaction of CpG DNA with Toll-like receptor 9. Semin Immunol. 2004;16:17–22.
- Suliman HB, Piantadosi CA. Mitochondrial quality control as a therapeutic target. Pharmacol Rev. 2016;68:20–48. doi:10.1124/pr.115.011502.
- Vyas S, Zaganjor E, Haigis MC. Mitochondria and cancer. Cell. 2016;166:555–566. doi:10.1016/j.cell.2016.07.002.
- Cani PD, Knauf C. How gut microbes talk to organs: the role of endocrine and nervous routes. Mol Metab. 2016;5:743–752. doi:10.1016/j.molmet.2016.05.011.
- Heller S, Penrose HM, Cable C, Biswas D, Nakhoul H, Baddoo M, Flemington E, Crawford SE, Savkovic SD. Reduced mitochondrial activity in colonocytes facilitates AMPKalpha2-dependent inflammation. FASEB J. 2017. doi:10.1096/fj.201600976R.
- Delpre G, Avidor I, Steinherz R, Kadish U, Ben-Bassat M. Ultrastructural abnormalities in endoscopically and histologically normal and involved colon in ulcerative colitis. Am J Gastroenterol. 1989;84:1038–1046.
- Meyer RR, Simpson MV. DNA biosynthesis in mitochondria. Differential inhibition of mitochondrial and nuclear DNA polymerases by the mutagenic dyes ethidium bromide and acriflavin. Biochem Biophys Res Commun. 1969;34:238–244.
- King MP, Attardi G. Human cells lacking mtDNA: repopulation with exogenous mitochondria by complementation. Science. 1989;246:500–503.
- Gautier L, Cope L, Bolstad BM, Irizarry RA. affy–analysis of affymetrix geneChip data at the probe level. Bioinformatics. 2004;20:307–315. doi:10.1093/bioinformatics/btg405.
- Ritchie ME, Phipson B, Wu D, Hu Y, Law CW, Shi W, Smyth GK. limma powers differential expression analyses for RNA-sequencing and microarray studies. Nucleic Acids Res. 2015;43:e47. doi:10.1093/nar/gkv007.
- Ma C, Ritian W, Yadong L, Zhang G, Sun S, Cong Y, Li X, Liu Z. Critical role of CD6highCD4+ T cells in driving Th1/Th17 cell immune responses and mucosal inflammation in IBD. J Crohns Colitis. 2018;13:510–524. doi:10.1093/ecco-jcc/jjy179.
- Morgan ME, Koelink PJ, Zheng B, Den Brok MHMGM, van de Kant HJG, Verspaget HW, Folkerts G, Adema GJ, Kraneveld AD. Toll-like receptor 6 stimulation promotes T-helper 1 and 17 responses in gastrointestinal-associated lymphoid tissue and modulates murine experimental colitis. Mucosal Immunol. 2014;7:1266–1277. doi:10.1038/mi.2014.16.
- Stallhofer J, Friedrich M, Konrad-Zerna A, Wetzke M, Lohse P, Glas J, Tillack-Schreiber C, Schnitzler F, Beigel F, Brand S. Lipocalin-2 Is a disease activity marker in inflammatory bowel disease regulated by IL-17A, IL-22, and TNF-alpha and modulated by IL23R genotype status. Inflamm Bowel Dis. 2015;21:2327–2340. doi:10.1097/MIB.0000000000000515.
- Ogura Y, Bonen DK, Inohara N, Nicolae DL, Chen FF, Ramos R, Britton H, Moran T, Karaliuskas R, Duerr RH, et al. A frameshift mutation in NOD2 associated with susceptibility to Crohn‘s disease. Nature. 2001;411:603–606. doi:10.1038/35079114.
- Cario E. Toll-like receptors in inflammatory bowel diseases: a decade later. Inflamm Bowel Dis. 2010;16:1583–1597. doi:10.1002/ibd.21282.
- Mottawea W, Chiang CK, Muhlbauer M, Starr AE, Butcher J, Abujamel T, Deeke SA, Brandel A, Zhou H, Shokralla S, et al. Altered intestinal microbiota-host mitochondria crosstalk in new onset Crohn‘s disease. Nat Commun. 2016;7:13419. doi:10.1038/ncomms13419.
- Cunningham KE, Vincent G, Sodhi CP, Novak EA, Ranganathan S, Egan CE, Stolz DB, Rogers MB, Firek B, Morowitz MJ, et al. Peroxisome proliferator-activated receptor-gamma coactivator 1-alpha (PGC1alpha) protects against experimental murine colitis. J Biol Chem. 2016;291:10184–10200. doi:10.1074/jbc.M115.688812.
- Clark A, Mach N. The crosstalk between the gut microbiota and mitochondria during exercise. Front Physiol. 2017;8:319. doi:10.3389/fphys.2017.00319.
- Lobet E, Letesson JJ, Arnould T. Mitochondria: a target for bacteria. Biochem Pharmacol. 2015;94:173–185. doi:10.1016/j.bcp.2015.02.007.
- Den Besten G, van Eunen K, Groen AK, Venema K, Reijngoud D-J, Bakker BM. The role of short-chain fatty acids in the interplay between diet, gut microbiota, and host energy metabolism. J Lipid Res. 2013;54:2325–2340. doi:10.1194/jlr.R036012.
- Lee I, Huttemann M. Energy crisis: the role of oxidative phosphorylation in acute inflammation and sepsis. Biochim Biophys Acta. 2014;1842:1579–1586. doi:10.1016/j.bbadis.2014.05.031.
- Ma J, Coarfa C, Qin X, Bonnen PE, Milosavljevic A, Versalovic J, Aagaard K. mtDNA haplogroup and single nucleotide polymorphisms structure human microbiome communities. BMC Genomics. 2014;15:257. doi:10.1186/1471-2164-15-257.
- Saxena A, Lopes F, Poon KKH, McKay DM. Absence of the NOD2 protein renders epithelia more susceptible to barrier dysfunction due to mitochondrial dysfunction. Am J Physiol Gastrointest Liver Physiol. 2017;313:G26–G38. doi:10.1152/ajpgi.00070.2017.
- Phipson B, Lee S, Majewski IJ, Alexander WS, Smyth GK. Robust hyperparameter estimation protects against hypervariable genes and improves power to detect differential expression. Ann Appl Stat. 2016;10:946–963. doi:10.1214/16-AOAS920.
- Li B, Dewey CN. RSEM: accurate transcript quantification from RNA-Seq data with or without a reference genome. BMC Bioinformatics. 2011;12:323–339. doi:10.1186/1471-2105-12-323.
- Wang L, Feng Z, Wang X, Wang X, Zhang X. DEGseq: an R package for identifying differentially expressed genes from RNA-seq data. Bioinformatics. 2010;26:136–138. doi:10.1093/bioinformatics/btp612.
- de Hoon MJ, Imoto S, Nolan J, Miyano S. Open source clustering software. Bioinformatics. 2004;20:1453–1454. doi:10.1093/bioinformatics/bth078.
- Saldanha AJ. Java treeview–extensible visualization of microarray data. Bioinformatics. 2004;20:3246–3248. doi:10.1093/bioinformatics/bth349.
- Lê S, Josse J, Husson F. FactoMineR: an R package for multivariate analysis. Journal of Statistical Software. 2008;25:1–18. doi:10.18637/jss.v025.i01.
- Cancer Genome Atlas Research N. Integrated genomic characterization of papillary thyroid carcinoma. Cell. 2014;159:676–690. doi:10.1016/j.cell.2014.09.050.
- Team RC. R: A language and environment for statistical computing. Vienna (Austria): R Foundation for Statistical Computing; 2012.