
ABSTRACT
Our objective was to investigate the relationship between the gut microbiota and anthropometric measurements among 248 participants from the Health Effects of Arsenic Longitudinal Study (HEALS) in Bangladesh. Our cohort represents a unique population that allows for the investigation of the gut microbiota and anthropometric measurements in lean individuals. We measured height, weight, arm, thigh, hip, and waist circumferences, and collected fecal samples. Microbial DNA was extracted from the stool samples and sequenced by 16S rRNA gene sequencing. We examined associations between relative abundance of individual bacterial taxa from phylum to genus levels and anthropometric measurements. We found that higher BMI, mid-upper arm circumference, waist circumference, and waist-to-hip ratio were associated with a lower alpha diversity of fecal bacteria. Relative abundance of the genus Oscillospira and the family S24-7 were inversely related to all measurements after correction for multiple testing. Relative abundance of genus Acidaminococcus and family Ruminococcaceae were also associated with several measurements. The positive associations of the genus Acidaminococcus with BMI, as well as waist and hip circumferences, were stronger in women than in men. Our data in this lean Bangladeshi population found a correlation between Oscillospira and leanness, as measured using multiple anthropometric measures.
Introduction
The potential role of the gut microbiota, or the composite of the bacteria present in the gastrointestinal tract, in adiposity has become the subject of considerable interest. Animal studies have shown that adiposity-related phenotypes can be transmitted via the gut microbiota in rodent models,Citation1 suggesting a role of the gut microbiome in adiposity. Recent mechanistic studies also suggest microbial activity can interact with the host’s metabolism,Citation2 and that disruption in microbial composition is associated with modifications in both body weight and fat storage and distribution.Citation3
Several epidemiologic studies provide data indicating differences in gut microbiome are related to adiposity-related phenotypes.Citation4–Citation6 Early studies found that individuals with higher levels of adiposity have a lower ratio of bacteria from the phylum Bacteroidetes to bacteria from the phylum Firmicutes compared to lean individuals.Citation6 However, other studies reported a higher ratio of Bacteroidetes to Firmicutes in obese individuals.Citation4 Recent studies aimed to identify a specific microbial signature linked with adiposity. However, most of the studies used body mass index (BMI) as the only marker of adiposity, and most of the studies were conducted in developed populations.
BMI is often used as a marker of adiposity in epidemiological studies. Yet BMI can be limited in its use, particularly in Asians or populations with low BMIs where a high BMI may adequately indicate a high body fat mass, but a low BMI could indicate either low fat mass or low fat-free mass.Citation7 Alternative anthropometric measurements, such as mid-upper arm circumference (MUAC), upper thigh circumference (UTC), waist circumference (WC), hip circumference (HC), and waist-to-hip ratio (WHR), have become important indicators of adiposity, disease risk, and mortality risk.Citation8 MUAC is an easily measured and reliable indicator of healthCitation9 and nutritional statusCitation10 in adults. Although not as well-established as MUAC, thigh circumference has been shown to correlate with body fat percentage, and may correlate with muscle mass and nutritional status.Citation11 WHR has been shown to be a better predictor of adiposity compared with BMI in South Asians.Citation7,Citation12 However, no studies have evaluated the associations between gut microbiome and these anthropometric measures.
In this study, we aimed to evaluate the association between gut microbiome and several anthropometric measures, including BMI, MUAC, UTC, WC, HC, and WHR.
Results
Sequencing results
Approximately, 8.6 million quality-filtered sequencing reads were obtained from 249 samples. There was an average of 34 520 reads per sample that were clustered into 108 987 OTUs, with a mean of 3297 (SD = 1 295) OTUs and a range of 38–8909 OTUs per sample. The OTUs were classified into 19 phyla, 39 classes, 78 orders, 142 families, and 273 genera. Taxa without a name at each taxonomic level and taxa with a relative abundance of less than 0.01% were removed, leaving a total of 8 phyla, 16 classes, 24 orders, 40 families, and 54 genera in the final analyses.
Characteristics of the study participants
The mean age of the participants was 48.6 ± 7.9 years (mean ± SD), and 41% were male (). Over three quarters of the men (76.5%), but only 13.7% of the women, were ever smokers. Half of the cohort were ever betel quid chewers (50.8%) and a quarter were ever hukka users (24.6%). In this lean population, the average BMI was 21.5 ± 4.1 kg/m2. A total of 25% of the participants were underweight (BMI < 18.50), 56% were in the normal range (BMI 18.50–24.99), 15% were overweight (BMI 25.0–29.99), and 3% were obese (BMI≥30). Male sex, ever hukka use, and increasing age, education, and systolic and diastolic blood pressure were associated with increasing BMI. The proportion of ever smokers in men decreases as BMI increases. Increasing BMI was inversely associated with two measures of alpha diversity (Chao1 richness estimator and Shannon diversity index) but was not associated with the total number of observed OTUs.
Table 1. Distribution of population characteristics and alpha diversity metrics by tertiles of BMI.
Microbial composition and anthropometric measures
Spearman correlation coefficients indicated that after adjusting for sex, age, smoking status, betel quid use, and education, overall fecal microbial richness as indicated by the number of observed OTUs and Chao1 richness index significantly decreased with increasing MUAC, WC, and WHR; and overall microbial diversity as shown by the Shannon diversity index significantly decreased as each of the anthropometric measures increased ().
Table 2. Spearman correlation coefficients§ for alpha diversity metrics and anthropometric measures.
Beta diversity analysis with the multiple distance-based omnibus test indicated that the microbial profiles, measured by several selected distance metrics, are closer if their anthropometric measures are similar (). We also conducted MiKRAT tests to further test three individual beta diversity metrics in relation to the anthropometric measures. When associated OTUs are phylogenetically related, the use of UniFrac distances is suggested. Then, the unweighted UniFrac distance is suitable for considering rare taxa, while the weighted UniFrac distance can be used for studying common/abundant taxa. When associated OTUs are not phylogenetically related, the Bray–Curtis dissimilarity can be best because it is constructed based solely on microbial abundance not incorporating phylogenetic tree information. The positive association of beta diversity with BMI and HC were weaker when weighted Unifrac was used, indicating the major differences for these anthropometric measures may be in the rare or less abundant taxa.
Table 3. P-values of the association test between microbiome diversity and anthropometric measures using MiRKAT.†
Next, we explored the associations between the microbial profile and the six anthropometric measures at the various taxonomic levels based on the relative abundance of each bacterial taxon (). Overall, the pattern of the significant association was consistent by bacterial taxonomy and across anthropometric measures. For instance, the relative abundance of the family Ruminococcaceae, to which the genus Oscillospira belongs, was related to all anthropometric measures by linear regression, either nominally or after FDR adjustment. The relative abundances of the order Desulfovibrionales, as well as its downstream family Desulfovibrionaceae and genus Desulfovibria were all nominally associated with MUAC, UTC, WHR, and WC. Likewise, the relative abundances of the order Turicibacterales, as well as its downstream family Turicibacteraceae and genus Turicibacter were all nominally associated with all antropometric measures. also shows consistent patterns of associations between the relative abundance of selected microbial genera and the six anthropometric measures. There was some overlap, but the correlations were not identical to the linear regression results. Specifically, after correction for multiple testing, the relative abundance of the genus Oscillospira was significantly inversely related to all six measures by linear regression (). depicts the dose–response decrease in relative abundance of the genus Oscillospira with increasing tertiles of each anthropometric measure by linear regression and by ANOVA. The relative abundance of the genus Acidaminococcus was significantly positively associated with BMI, WC, and HC. The relative abundance of the family S24-7 was significantly inversely related to all the six anthropometric measures by linear regression (). The relative abundance of the Ruminococcaceae family was inversely related to MUAC, WC, and WHR by linear regression (). Similar results were observed in sensitivity analyses excluding very lean subjects with BMI <18.5 (see Supplemental Table 1). The means, standard deviations, and medians of the relative abundance of the four significant taxa, as well as the percentage of samples the taxa were present in, are shown in .
Table 4. Associations of BMI, mid-upper arm circumference, upper thigh circumference, waist circumference, hip circumference, and waist-to-hip ratio with relative abundance of selected taxa by linear regression.
Table 5. Mean, standard deviation, and median of the relative abundances in percentages and prevalence of select individual bacterial taxa that were significantly related to one or more anthropometric measure by linear regression after correction for multiple testing.
Figure 1. Heatmap of Spearman correlation coefficients summarizing associations between anthropometric measurements and relative abundance of significantly correlated general.
The x-axis shows each anthropometric measurement and the y-axis indicates the individual genera. The coefficients were adjusted for sex, age, smoking, betel quid use, and education. Spearman correlation coefficients are represented by color ranging from blue, negative correlation (−1), to red, positive correlation (1). BMI = body mass index, Arm = mid-upper arm circumference, Thigh = upper thigh circumference, Waist = waist circumference, Hip = hip circumference, WHR = waist-to-hip ratio.
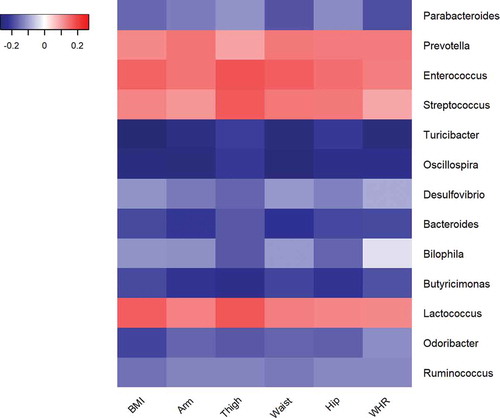
Figure 2. Association between the relative abundance of Oscillospira and each anthropometric measurement.
For each tertile of relative abundance of genus Oscillospira, the least squares means of the respective anthropometric measurement are indicated by black squares with error bars. was analyzed by nonparametric Spearman’s partial correlations. was analyzed by ANOVA.
We further analyzed the data at the species level for all the taxa that were nominally significantly related to any of the anthropometric measures. Only a few species were significantly associated with anthropometric measures when analyzed by percent increase in relative abundance of individual species (Supplemental Table 2). For instance, Lactobacillus ruminis, which belongs to order Lactobacillales, was associated with UTC and HC. The associations may partly explain why Lactobacillales is related to these anthropometric measures. However, the 16S rRNA gene sequencing generally does not have the resolution below the genus level and many species in our data are not assigned a name.
Upon testing for the sex differences, we observed that the associations between the relative abundance of the genus Acidaminococcus and BMI (P-value = 0.005), WC (P-value = 0.001), and HC (P-value = 0.008) were significantly different between men and women by linear regression (see Supplemental Table 3). The positive associations were significant in women but not in men.
Discussion
We found that a lower diversity of fecal bacteria was associated with increasing anthropometric measures. Multiple indices of diversity were all significantly inversely related to MUAC, WC, and WHR. For individual taxa, we found a significant inverse association between the relative abundance of the genus Oscillospira and the family S24–7 with all six anthropometric measures. The relative abundance of the genus Acidaminococcus was positively associated with BMI, WC, and HC, and the family Ruminococcaceae was inversely related to MUAC, WC, and WHR. The positive associations of Acidaminococcus with BMI, WC, and HC were stronger in women than in men.
It has been hypothesized that the gut microbiota can affect adiposity and obesity via dysbiosis.Citation1,Citation13 A number of studies conducted in European and American children and adults have found that obesity is associated with a lower diversity and richness of the gut microbiota.Citation14–Citation16 This was further confirmed in a large-scale study of 3948 adults in Belgium and the Netherlands, which found a small, but significant, association.Citation17 Our data also support this association, and we extended the observation to a low-income population from Bangladesh using multiple anthropometric measures. We found that subjects with higher MUAC, WC, or WHR measurements had lower phylogenetic diversity compared to those with lower measurements. The inverse association was consistently observed for all anthropometric measures.
We observed an inverse association between the relative abundance of the genus Oscillospira and each of the six anthropometric measures. Oscillospira has been associated with a low BMI in both children and adults in several studies. For example, a study in 1313 adults in cohorts from the US, UK, and the Netherlands found a negative association between Oscillospira with BMI and visceral fat mass.Citation18 Evidence from animal and mechanistic studies suggests that Oscillospira relies on fermentation products secreted by other microbial species or on sugars released from host mucins, and that Oscillospira cannot degrade complex fibers.Citation19 Thus, the host must spend metabolic energy to regenerate degraded glycoproteins that compose intestinal mucins, which could partially explain why Oscillospira may be associated with leanness, a hypothesis put forth by Konikoff and Gophna.Citation20 Obese individuals have an increased ability to harvest and absorb energy from their diet due to an altered microbial composition compared to healthy individuals.Citation21 One component produced by microbes is short chain fatty acids (SCFAs), which are crucial for a number of pathways related to maintaining health.Citation22 One such important SCFA produced is butyrate, which helps to maintain health by modulating the immune system, providing energy to the lining of the intestine, and affecting metabolic routes in various parts of the body.Citation22 Depletion of taxa capable of producing butyrate has been linked to obesity, as well as other noncommunicable diseases.Citation23 Butyrate can induce the production of gut hormones, which reduces food intake and can reduce inflammation in the intestine.Citation22
Additionally, in a twin study conducted in the UK with 416 pairs of twins,Citation24 the relative abundance of Oscillospira was more concordant in monozygotic twins than dizygotic twins, suggesting that the genera was highly heritable. This study also found a positive association between relative abundance of Oscillospira and a lean BMI (<25). Our findings on Oscillospira confirm data from previous population-based studies and extend the observation to a low-income, lean population. In addition, we show that Oscillospira is related to not only BMI but also all other anthropometric measures. Although the measures are correlated with one another, they measure adiposity or leanness at different body sites. Oscillospira has been found to be reduced in a number of inflammatory diseases in humansCitation25 possibly due to its putative ability to produce butyrate,Citation26 and may play an important role in human health. Taken together, the evidence that Oscillospira plays a role in the development of adiposity is strong, and future intervention studies or population-based studies on adiposity-related outcomes are warranted.
The S24–7 family was also inversely related to each of the anthropometric measures in our study. In a mouse model, family S24–7 was altered by both diet and activity. A high fat diet lowered the relative abundance of S24–7 in mice, while exercise increased it.Citation27 This is a butyrate-producing family in the Bacteroidetes phylum that has the capacity to ferment a range of different carbohydrates.Citation28 While often prevalent in both animal and human guts, this family of bacteria is not well characterized, and little is known about how it interacts with the host.Citation28 Future studies are needed to replicate our findings and explore the underlying mechanisms by which S24–7 is associated with anthropometric measures.
The relative abundance of the genus Acidaminococcus was higher in participants with a higher BMI, WC, and HC. This was also found in a study comparing overweight and obese individuals with normal weight individuals.Citation29 The literature on Acidaminococcus is fairly sparse, but one characteristic of the species that has been described is their ability to use glutamate as a sole source of energy.Citation30 Glutamate has been shown to play an important role in providing oxidative fuel for the intestinal epithelium in animal modelsCitation31 and in the restoration of gut barrier function in vitro and maintenance of the gut epithelium.Citation32 Thus, overgrowth of bacteria that can ferment glutamate may be related to an unhealthy metabolic state. The positive associations of Acidaminococcus with BMI, WC, and HC were stronger in women for some anthropometric measures in the present study, suggesting Acidaminococcus may play a more important role in adiposity in women. The Ruminococcaceae family was found to have an inverse association with MUAC, WC, and WHR. Ruminococcaceae was associated with a lower risk of weight gain in adults in another study, and was suggested to be functionally linked to a lean phenotype.Citation33 It has also been found to be decreased in obese individuals compared to healthy individuals.Citation34 Ruminococcaceae are considered a key commensal bacterial family in the gut of healthy individuals.Citation35 These butyrate-producing bacteria may protect healthy individuals from chronic intestinal inflammation.Citation35
While these functions and pathways are interesting to consider, our study did not have the metagenomics data. Future studies that investigate the functions and underlying pathways of the gut microbiota and adiposity using metagenomic sequencing are needed to shed light on the underlying mechanisms.
Strengths and limitations
A major strength of our study is that we had multiple anthropometric measures and found consistent results across the measures. The range of the measures in our population was wide, including very lean and obese individuals, allowing us to assess the overall association. We also did sensitivity analyses excluding very lean subjects with BMI <18.5 and found similar results (see Supplemental Table 1). This suggests the findings are not necessarily for malnutrition, but for leanness. This is the largest study of the gut microbiota conducted in South Asians. Since this rural population lacks basic health care services from the existing health care facilities, the study participants were free from several factors, such as frequent use of medications, supplements, or antibiotics, that may disrupt the gut microbiota. The fact that this cross-sectional study is not a prospective study is a potential limitation. Future longitudinal studies are needed to assess gut microbiota changes in relation to changes in BMI over time. However, some of our findings, such as the findings on Oscillospira, are supported by evidence from experimental studies. Finally, 16S rRNA gene sequencing does not generally provide sequencing resolution below the genus level.Citation36 Future studies of metagenomic sequencing are warranted to reveal species that contribute to the associations observed in the present study.
In a lean Bangladeshi population, we found that lower gut bacteria diversity, as well as genus Oscillospira and the S24–7 family, were significantly associated with multiple anthropometric measures.
Materials and methods
The Health Effects of Arsenic Longitudinal Study (HEALS) is an ongoing, prospective cohort study in Araihazar, Bangladesh. Details of the original study and cohort can be found elsewhere (see http://superfund.ciesin.columbia.edu/project_pg/93)Citation37. Briefly, the original cohort consists of 11 746 married adults, 18–75 years old, who were recruited from October 2000 to May 2002. An additional 8287 participants were recruited between 2006 and 2008 as the expansion cohort. Overall participation rate was 97%. Additionally, a field clinic was set up for cohort participants to receive medical treatment and assist in follow-up and ancillary studies. All study procedures were approved by the Ethical Committee of the Bangladesh Medical Research Council and the Institutional Review Boards of Columbia University and the University of Chicago, and informed consent was obtained from the study participants.
For the present study, 400 HEALS participants residing in 6 villages surrounding the clinic and who were between 25 and 50 years old and free from any major illness were randomly selected. The participants were not significantly different from the remaining HEALS participants in their demographics or lifestyle factors (data not shown). Other eligibility criteria included willingness to provide stool samples at the clinic and absence of antibiotic use within the previous month. Of the 400, 328 fulfilled the eligibility requirements. Of these, 300 visited the clinic, completed a separate questionnaire on lifestyle factors, and underwent anthropometric, weight, and blood pressure measurements between February 2015 and November 2016. A total of 250 of these participants provided fecal samples.
Fecal specimen collection
Participants were asked to go to the clinic for fecal sample collection, where a senior research officer gave each participant an empty ThermoFisher Scientific vial (Waltham, MA, USA). Stool from a single bowel movement was collected. Samples were immediately stored in a −20°C freezer and kept frozen until processing at the field laboratory for DNA extraction.
Anthropometric measures
Trained study physicians measured height and weight using a tape measure and a Misaki (Japan) scale (calibrated weekly), respectively, as described previously.Citation38 BMI was calculated by dividing the average weight in kilograms by the square of the average height in meters. The MUAC was measured at the midpoint of the upper right arm as described previously.Citation9 Waist and hip circumference were measured while arms were relaxed at the sides, at the end of a normal expiration, and directly over skin or light clothing in a standing position.Citation7 Waist circumference was measured at the midpoint between the lower margin of the last palpable rib and the top of the iliac crest. Hip circumference was measured at the maximum circumference of the buttocks. WHR was calculated by dividing waist circumference by hip circumference. Upper thigh circumference was measured at the largest portion of the thigh with muscles fully relaxed. All measurements were read to the nearest 1 cm.
DNA extraction and 16S rRNA gene sequencing
The MOBIO PowerSoil DNA Isolation Kit (MO BIO Laboratories, Carlsbad, CA) was used to extract total DNA from fecal samples at the field laboratory. Yang et al. describes the methods of the polymerase chain reaction (PCR) amplification and sequencing in detail.Citation39 In brief, the 16S rRNA gene was amplified targeting the hypervariable V3-V4 region using universal primer set 347F 5′-GGAGGCAGCAGTRRGGAAT and 803R 5′-GACTACHVGGGTATCTAATCC. PCR products were purified using Agencourt AMPure XP (Beckman Coulter Life Sciences, IN) and quantified with the Agilent 4200 TapeStation (Agilent Technologies, CA). Amplicon libraries were pooled at equimolar concentrations and sequenced using the Illumina MiSeq 300-cycles (2×300bp) reagent kit (Illumina, Inc., San Diego, CA). One sample failed PCR amplification and was not further sequenced.
Bioinformatics and quality control
Sequencing data were processed using QIIME (Quantitative Insights Into Microbial Ecology) 1.8.0.Citation40 Sequencing reads were demultiplexed and low-quality reads with quality scores of <25 were removed. Chimeric sequences were taken out using ChimeraSlayer.Citation41 The pre-processed sequences were then clustered into operational taxonomic units (OTUs) at 97% identity using UCLUSTCitation42 against the Greengenes database 13.8. The most abundant sequence in each OTU was selected as a representative, and taxonomy was then assigned for each OTU from phylum to species levels using the Greengenes database 13.8 and Ribosomal Database Project (RDP) Classifier 2.2.Citation43 Several alpha diversity measures at the OTU level were estimated based on rarefied sequence count (10 000 sequences per sample) using QIIME. Microbial richness, a measure of the number of taxa in each sample (or the abundance of microbes), was examined by calculating the number of observed OTUs and Chao1 richness estimator.Citation44 Evenness, a measure of the relative number of different taxa in each sample (or the distribution of the different microbes), was additionally assessed using the Shannon diversity index.
Statistical analyses
We excluded one participant who was missing BMI. First, descriptive statistics were conducted to compare demographic, lifestyle, anthropometric measurements, and alpha diversity measures by tertiles of BMI. Differences in BMI associated with binary variables and continuous variables were tested using t-tests and linear regression, respectively.
To calculate relative abundance, the number of reads for each taxon was divided by the total number of reads from all taxa within each individual sample. Levels of taxa included phylum, class, order, family, genus, and species. Nonparametric Spearman’s partial correlations were calculated for individual bacterial genera and linear regression was used to calculate species with the anthropometric measurements. The heatmap.2 function from the gplots package in R, version 3.4.2 (R Core Team, Vienna, Austria) was used to generate a heatmap to demonstrate the relationships between genera and anthropometric measurements. Spearman’s partial correlation coefficients were also calculated for the anthropometric measurements and alpha diversity metrics, including observed OTUs, Chao1 richness estimator, and Shannon diversity index. All the correlations were adjusted for sex, age (years), smoking status (never and ever), betel quid use (never and ever), and education (years).
To evaluate the association between beta diversity metrics and anthropometric measures, the microbiome regression-based kernel association test (MiRKAT) was performed, adjusting for sex, age, smoking status, betel quid use, and education. MiRKAT is an association test between a microbial community and continuous/binary phenotypes via a kernel metric, where the kernel can be constructed using phylogenetic or non-phylogenetic distance metrics.Citation45 Unweighted UniFrac, weighted Unifrac,Citation46 and Bray-Curtis distancesCitation47 were used to measure the microbial composition profiles for the MiRKAT test. Since each distance measurement has strength in capturing a specific association pattern, we also conducted the omnibus test to simultaneously consider multiple distances.
Multivariable linear regression models were conducted with the relative abundance of individual bacterial taxa as the independent variable and each of the anthropometric measures as the dependent variable, adjusting for sex, age, smoking status, betel quid use, and education. The Benjamini–Hochberg procedureCitation48 was used to correct all P values for multiple testing by controlling the false discovery rate (FDR) at 5%. For taxa that were significantly associated with any of the anthropometric measurements, we further tested for interaction in a separate model that included a cross-product between sex and individual bacterial taxa. Sensitivity analyses were conducted excluding very lean subjects with BMI <18.5. A taxonomic tree showing the diversity of the gut microbiota down to the genus level was constructed using GraPhlAn.Citation49
All statistical analyses were conducted in SAS 9.4 (SAS Institute, Inc., Cary, NC).
Data and analysis scripts are available upon request from the authors.
Abbreviations
| BMI | = | body mass index |
| HC | = | hip circumference |
| MUAC | = | mid-upper arm circumference |
| UTC | = | upper thigh circumference |
| WC | = | waist circumference |
| WHR | = | waist-to-hip ratio |
Disclosure of Potential Conflicts of Interest
No potential conflicts of interest were disclosed.
Supplemental Material
Download MS Word (33.7 KB)Acknowledgments
We thank the Genome Technology Center for expert sequencing. This shared resource is partially supported by a Cancer Center Support Grant, P30 CA016087, at the Laura and Isaac Perlmutter Cancer Center. ZP is staff physician at the Department of Veterans Affairs New York Harbor Healthcare System. The content is the sole responsibility of the authors and does not necessarily represent the official views of the National Institutes of Health, the U.S. Department of Veterans Affairs or the United States Government.
Supplementary material
Supplemental data for this article can be accessed on the publisher’s website.
Additional information
Funding
References
- Turnbaugh PJ, Ley RE, Mahowald MA, Magrini V, Mardis ER, Gordon JI. An obesity-associated gut microbiome with increased capacity for energy harvest. Nature. 2006;444(7122):1027-31. doi:10.1038/nature05414.
- Caricilli AM, Saad MJ. Gut microbiota composition and its effects on obesity and insulin resistance. Curr Opin Clin Nutr Metab Care. 2014;17(4):312–318. doi:10.1097/mco.0000000000000067.
- de Clercq NC, Groen AK, Romijn JA, Nieuwdorp NM. Gut microbiota in obesity and undernutrition. Adv Nutr. 2016;7(6):1080–1089. doi:10.3945/an.116.012914.
- Ley RE. Obesity and the human microbiome. Curr Opin Gastroenterol. 2010;26(1):5–11. doi:10.1097/MOG.0b013e328333d751.
- Ley RE, Backhed F, Turnbaugh P, Lozupone CA, Knight RD, Gordon JI. Obesity alters gut microbial ecology. Proc Natl Acad Sci. 2005;102(31):11070–11075. doi:10.1073/pnas.0504978102.
- LeyRE, TurnbaughPJ, KleinS, GordonJI.Microbial ecology: human gut microbes associated with obesity. Nature. 2006;444(7122):1022-3. doi:10.1038/4441022a.
- Ge W, Parvez F, Wu F, Islam T, Ahmed A, Shaheen I, Sarwar G, Demmer RT, Desvarieux M, Ahsan H, et al. Association between anthropometric measures of obesity and subclinical atherosclerosis in Bangladesh. Atherosclerosis. 2014;232(1):234–241. doi:10.1016/j.atherosclerosis.2013.11.035.
- Czernichow S, KengneAP, HuxleyRR, BattyGD, de GalanB, Grobbee D, PillaiA, ZoungasS, MarreMWoodwardM, et al. Comparison of waist-to-hip ratio and other obesity indices as predictors of cardiovascular disease risk in people with type-2 diabetes: a prospective cohort study from advance. Eur J Cardiovasc Prev Rehabil. 2011;18(2):312-319. doi: 10.1097/HJR.0b013e32833c1aa3.
- ChenY, GeW, ParvezF, BangaloreS, EunusM, Ahmed A, IslamT, Rakibuz-Zaman M, Hasan R, Argos M, et al. A prospective study of arm circumference and risk of death in bangladesh. Int J Epidemiol. 2014;43(4):1187-1196. doi: 10.1093/ije/dyu082.
- Sultana T, Karim MN, Ahmed T, Hossain MI. Assessment of under nutrition of bangladeshi adults using anthropometry: can body mass index be replaced by mid-upper-arm-circumference? PLoS One. 2015;10:e0121456.
- Sengupta P, Sahoo S. Health-related morphological characteristics and physiological fitness in connection with nutritional, socio-economic status, occupational workload of tea garden workers. Afr Health Sci. 2014;14(3):558–563. doi:10.4314/ahs.v14i3.9.
- WHO. Waist circumference and waist-hip ratio: report of A WHO expert consultation. 8–11 December 2008. Geneva: World Health Organization; 2011.
- Turnbaugh PJ, Backhed F, Fulton L, Gordon JI. Diet-induced obesity is linked to marked but reversible alterations in the mouse distal gut microbiome. Cell Host Microbe. 2008;3(4):213–223. doi:10.1016/j.chom.2008.02.015.
- Turnbaugh PJ, Hamady M, Yatsunenko T, Cantarel BL, Duncan A, Ley RE, Sogin ML, Jones WJ, Roe BA, Affourtit JP, et al. A core gut microbiome in obese and lean twins. Nature. 2009;457(7228):480–484. doi:10.1038/nature07540.
- Riva A, Borgo F, Lassandro C, Verduci E, Morace G, Borghi E, Berry D. Pediatric obesity is associated with an altered gut microbiota and discordant shifts in firmicutes populations. Environ Microbiol. 2017;19(1):95–105. doi:10.1111/1462–2920.13463.
- Fu J, Bonder MJ, Cenit MC, Tigchelaar EF, Maatman A, Dekens JA, Brandsma E, Marczynska J, Imhann F, Weersma RK, et al. The gut microbiome contributes to a substantial proportion of the variation in blood lipids. Circ Res. 2015;117(9):817–824. doi:10.1161/circresaha.115.306807.
- Falony G, Joossens M, Vieira-Silva S, Wang J, Darzi Y, Faust K, Kurilshikov A, Bonder MJ, Valles-Colomer M, Vandeputte D, et al. Population-level analysis of gut microbiome variation. Science. 2016;352(6285):560–564. doi:10.1126/science.aad3503.
- Beaumont M, Goodrich JK, Jackson MA, Yet I, Davenport ER, Vieira-Silva S, Debelius J, Pallister T, Mangino M, Raes J, et al. Heritable components of the human fecal microbiome are associated with visceral fat. Genome Biol. 2016;17(1):189. doi:10.1186/s13059-016-1052–7.
- Kohl KD, Amaya J, Passement CA, Dearing MD, McCue MD. Unique and shared responses of the gut microbiota to prolonged fasting: a comparative study across five classes of vertebrate hosts. FEMS Microbiol Ecol. 2014;90(3):883–894. doi:10.1111/1574–6941.12442.
- Konikoff T, Gophna U. Oscillospira: a central, enigmatic component of the human gut microbiota. Trends Microbiol. 2016;24(7):523–524. doi:10.1016/j.tim.2016.02.015.
- Greiner T, Backhed F. Effects of the gut microbiota on obesity and glucose homeostasis. Trends Endocrinol Metab. 2011;22(4):117–123. doi:10.1016/j.tem.2011.01.002.
- Ríos-Covián D, Ruas-Madiedo P, Margolles A, Gueimonde M, de Los Reyes-Gavilán CG, Salazar N. Intestinal short chain fatty acids and their link with diet and human health. Front Microbiol. 2016;7:185. doi:10.3389/fmicb.2016.00185.
- Vital M, Karch A, Pieper DH, Shade A. Colonic butyrate-producing communities in humans: an overview using omics data. mSystems. 2017;2(6):e00130–17. doi:10.1128/mSystems.00130-17.
- GoodrichJK, WatersJL, PooleAC, SutterJL, Koren O, BlekhmanR, BeaumontM, Van Treuren W, Knight RBellJT, et al. Human genetics shape the gut microbiome. Cell. 2014;159(4):789-799. doi: 10.1016/j.cell.2014.09.053.
- Walters WA, Xu Z, Knight R. Meta-analyses of human gut microbes associated with obesity and IBD. FEBS Lett. 2014;588(22):4223–4233. doi:10.1016/j.febslet.2014.09.039.
- Gophna U, Konikoff T, Nielsen HB. Oscillospira and related bacteria - From metagenomic species to metabolic features. Environ Microbiol. 2017; 19(3): 835–841. doi:10.1111/1462-2920.13658.
- Evans CC, LePard KJ, Kwak JW, Stancukas MC, Laskowski S, Dougherty J, Moulton L, Glawe A, Wang Y, Leone V, et al. Exercise prevents weight gain and alters the gut microbiota in a mouse model of high fat diet-induced obesity. PLoS One. 2014;9(3):e92193. 10. doi:10.1371/journal.pone.0092193.
- Ormerod KL, Wood DLA, Lachner N, Gellatly SL, Daly JN, Parsons JD, Dal’Molin CGO, Palfreyman RW, Nielsen LK, Cooper MA, et al. Genomic characterization of the uncultured bacteroidales family S24–7 inhabiting the guts of homeothermic animals. Microbiome. 2016;4(1):36. doi:10.1186/s40168-016-0181–2.
- Yun Y, Kim H-N, Kim SE, Heo SG, Chang Y, Ryu S, Shin H, Kim H-L. Comparative analysis of gut microbiota associated with body mass index in a large Korean cohort. BMC Microbiol. 2017;17(1):151. doi:10.1186/s12866-017-1052–0.
- Rogosa M. Acidaminococcus gen. n., acidaminococcus fermentans sp. n., anaerobic gram-negative diplococci using amino acids as the sole energy source for growth. J Bacteriol. 1969;98:756–766.
- Burrin DG, Stoll B. Metabolic fate and function of dietary glutamate in the gut. Am J Clin Nutr. 2009;90(3):850S–856S. doi:10.3945/ajcn.2009.27462Y.
- Vermeulen MA. Glutamate reduces experimental intestinal hyperpermeability and facilitates glutamine support of gut integrity. World J Gastroenterol. 2011;17(12):1569–1573. doi:10.3748/wjg.v17.i12.1569.
- Menni C, Jackson MA, Pallister T, Steves CJ, Spector TD, Valdes AM. Gut microbiome diversity and high-fibre intake are related to lower long-term weight gain. Int J Obes. 2017;41(7):1099–1105. doi:10.1038/ijo.2017.66.
- Zhu L, Baker SS, Gill C, Liu W, Alkhouri R, Baker RD, Gill SR. Characterization of gut microbiomes in nonalcoholic steatohepatitis (NASH) patients: a connection between endogenous alcohol and NASH. Hepatology. 2013;57(2):601–609. doi:10.1002/hep.26093.
- Mancabelli L, Milani C, Lugli GA, Turroni F, Cocconi D, van Sinderen D, Ventura M. Identification of universal gut microbial biomarkers of common human intestinal diseases by meta-analysis. FEMS Microbiol Ecol. 2017;93(12). doi:10.1093/femsec/fix153.
- DaiZ, CokerOO, NakatsuG, WuWKK, ZhaoL, Chen Z, ChanFKL, Kristiansen K, Sung JJY, WongSH, et al. Multi-cohort analysis of colorectal cancer metagenome identified altered bacteria across populations and universal bacterial markers. Microbiome. 2018;6(1):70. doi:10.1186/s40168-018-0451-2.
- Ahsan H, Chen Y, Parvez F, Argos M, Hussain AI, Momotaj H, Levy D, van geen A, Howe G, Graziano J. Health Effects of Arsenic Longitudinal Study (HEALS): description of a multidisciplinary epidemiologic investigation. J Expo Sci Environ Epidemiol. 2006;16(2):191–205.
- Pierce BL, Kalra T, Argos M, Parvez F, Chen Y, Islam T, Ahmed A, Hasan R, Rakibuz-Zaman M, Graziano J, et al. A prospective study of body mass index and mortality in Bangladesh. Int J Epidemiol. 2010;39(4):1037–1045. doi:10.1093/ije/dyp364.
- Yang L, Lu X, Nossa CW, Francois F, Peek RM, Pei Z. Inflammation and intestinal metaplasia of the distal esophagus are associated with alterations in the microbiome. Gastroenterology. 2009;137(2):588–597. doi:10.1053/j.gastro.2009.04.046.
- Caporaso JG, Kuczynski J, Stombaugh J, Bittinger K, Bushman FD, Costello EK, Fierer N, Peña AG, Goodrich JK, Gordon JI, et al. QIIME allows analysis of high-throughput community sequencing data. Nat Methods. 2010;7(5):335–336. doi:10.1038/nmeth.f.303.
- Haas BJ, Gevers D, Earl AM, Feldgarden M, Ward DV, Giannoukos G, Ciulla D, Tabbaa D, Highlander SK, Sodergren E, et al. Chimeric 16S rRNA sequence formation and detection in Sanger and 454-pyrosequenced PCR amplicons. Genome Res. 2011;21(3):494–504. doi:10.1101/gr.112730.110.
- Edgar RC. Search and clustering orders of magnitude faster than BLAST. Bioinformatics. 2010;26(19):2460–2461. doi:10.1093/bioinformatics/btq461.
- Wang Q, Garrity GM, Tiedje JM, Cole JR. Naive Bayesian classifier for rapid assignment of rRNA sequences into the new bacterial taxonomy. Appl Environ Microbiol. 2007;73(16):5261–5267. doi:10.1128/AEM.00062–07.
- McMurdie PJ, Holmes S, Watson M. phyloseq: an R package for reproducible interactive analysis and graphics of microbiome census data. PLoS One. 2013;8(4):e61217. doi:10.1371/journal.pone.0061217.
- Zhao N, Chen J, Carroll IM, Ringel-Kulka T, Epstein MP, Zhou H, Zhou JJ, Ringel Y, Li H, Wu MC, Testing in Microbiome-Profiling Studies with MiRKAT, the Microbiome Regression-Based Kernel Association Test. Am J Hum Genet. 2015; 96(5): 797–807. doi:10.1016/j.ajhg.2015.04.003.
- Lozupone CA, Hamady M, Kelley ST, Knight R. Quantitative and qualitative diversity measures lead to different insights into factors that structure microbial communities. Appl Environ Microbiol. 2007;73:1576–1585. doi:10.1128/AEM.01996-06.
- Bray JR, Curtis JT. An ordination of the upland forest communities of Southern Wisconsin. Ecol Monogr. 1957;27:325–349. doi:10.2307/1942268.
- Benjamini Y, Hochberg Y. Controlling the false discovery rate - a practical and powerful approach to multiple testing. J R Stat Soc Series B Stat Methodol. 1995;57:289–300.
- Asnicar F, Weingart G, Tickle TL, Huttenhower C, Segata N. Compact graphical representation of phylogenetic data and metadata with GraPhlAn. Peer J. 2015;3:e1029. doi:10.7717/peerj.1029.