
ABSTRACT
Specific diets to manage sugar malabsorption are reported to reduce clinical symptoms of irritable bowel syndrome (IBS). However, the effects of diets for malabsorbed sugars on gut microbiota signatures have not been studied, and associations with clinical outcomes in IBS have not been characterized. 22 IBS patients positively tested for either lactose-, fructose-, sorbitol- or combined malabsorptions were subjected to 2-weeks sugar elimination and subsequent 4-weeks re-introduction. 7 IBS patients tested negative for sugar malabsorption were used as controls. Nutrition and clinical symptoms were recorded throughout the study. Fecal samples were serially collected for 16S rRNA amplicon and shotgun-metagenome sequencing.
Dietary intervention supervised by nutrition counseling reduced IBS symptoms during the elimination and tolerance phases. Varying clinical response rates were observed between subjects, and used to dichotomize our cohort into visual analogue scale (VAS) responders and non-responders. Alpha -and beta-diversity analyzes revealed only minor differences regarding 16S rRNA-based fecal microbiota compositions between responder and non-responder patients during baseline or tolerance phase. In shotgun-metagenome analyzes, however, we analyzed microbial metabolic pathways and found significant differences in pathways encoding starch degradation and complex amino acid biosynthesis at baseline between IBS controls and malabsorbers, and notably, between diet responder and non-responders. Faecalibacterium prausnitzii, Ruminococcus spp. and Bifidobacterium longum largely informed these metabolic pathways.
Our study demonstrates that diet interventions for specific, malabsorbed carbohydrates reshaped the metagenomic composition of the gut microbiota, with a small community of bacterial taxa contributing to these changes rather than a single species.
Introduction
Irritable bowel syndrome (IBS) is a highly prevalent functional intestinal disorder characterized by abdominal pain, discomfort and bloating associated with disturbed bowel habits and a substantial reduction in quality of life.Citation1Citation2 The diagnosis is made on symptom-based criteria according to international consensus guidelines and the exclusion of organ pathologies.Citation3 Several pharmacological and psychological approaches have been established to treat the disorder with varying success.Citation4,Citation5
As up to 60% of patients report that particular food can trigger IBS-associated symptoms,Citation6–Citation8 diet interventions have become of particular interest in the clinical management of IBS. Currently, the most widely adopted approach is to reduce fermentable oligosaccharides, disaccharides, monosaccharides and polyols (FODMAPs) in the diet which leads to an improvement in IBS symptoms.Citation9–Citation12 A gluten-free diet has also been shown to ameliorate IBS symptoms, but this diet is controversial in the standard-of-care of the disorder.Citation13,Citation14 Although potentially beneficial, these restrictive diets may increase risks for nutritional inadequacy and for disordered eating habits.Citation15 A reduction in prebiotics such as starches, fructans and galacto-oligosaccharides can also lead to gut microbiota changes leading to a reduction in beneficial microbes and microbial metabolites.Citation16–Citation18 Consequently, more targeted and patient-tailored dietary interventions are needed for the treatment of IBS. A few clinical studies with specific carbohydrate-restricted diets have been carried out in IBS patients with comorbid fructose and lactose intolerances, which can occur in up to 70% of these cohorts.Citation19–Citation22 Diets reduced in malabsorbed sugars are reported to induce global symptom relief in a substantial number of patients, however, complete symptom resolution was not achieved.Citation20,Citation22 It is currently unknown to what extent other factors, such as the patient’s gut microbiota, contribute to clinical response variation and symptom variability.
The gut microbiota has been shown to be altered in patients with IBS.Citation23 A systemic review demonstrated that IBS is associated with lower relative abundances of commensal bacteria like Lactobacillus, Bifidobacterium and Faecalibacterium prausnitzii in patients’ feces.Citation24 Moreover, fecal bacterial profiles have been shown to predict clinical responses to low FODMAPs diet in IBS patients.Citation25 There is a large gap in data on the effects of carbohydrate-specific dietary interventions on symptom severity and intestinal microbiota changes, especially with regard to IBS and frequently occurring comorbid sugar malabsorption.
We hypothesize that interventions to reduce malabsorbed sugars in the diet affect the gut microbiota in IBS patients with sugar malabsorptions, and that microbial profiles are associated with the clinical outcome. To investigate this hypothesis, we performed a single-center clinical study in IBS patients diagnosed with lactose, fructose and/or sorbitol malabsorption. Patients first underwent an elimination diet and later a malabsorbed sugar re-introduction up to individually tolerated amounts. Stool samples were collected serially from these patients and non-malabsorbing IBS controls, and were used for 16S rRNA amplicon and shotgun-metagenome sequencing for metabolic pathway analyzes.
Results
Participants
37 patients with formally diagnosed IBS were recruited for the study (30 IBS patients with HBT-diagnosed carbohydrate malabsorption in the intervention group and 7 IBS patients without a sugar malabsorption as controls). 8 participants of the intervention group exited the study either in EL or TO and were excluded from analysis. Detailed demographic characteristics of all 29 patients are summarized in Supplementary Table 1. The intervention group did not differ from the controls except for the body mass index (BMI) who presented with higher median BMIs (Supplementary Table 1). IBS subtypes were classified by BSSCitation1 into IBS-C (constipation dominant subtype, BSS 1 + 2 in >25% of bowel movements and <25% of defecations with BSS types 6 or 7), IBS-D (diarrhea dominant, BSS 6 + 7 in >25% of bowel movements and <25% of defecations with BSS types 1 or 2) or non-classified (IBS-U, BSS 3–5 and not accurately classified into IBS-C, -D or -M; IBS-M was not observed in out cohort according to current classification criteriaCitation1) were not different between controls and patients with malabsorptions (Supplementary Table 1). QoL parameter did not differ between both groups (Supplementary Table 2). HBTs revealed that 13 participants malabsorbed a single sugar (lactose: 1; fructose: 2; sorbitol: 10 patients each), and 9 had combined carbohydrate malabsorptions (lactose + sorbitol: 2; fructose + sorbitol: 2; lactose + fructose + sorbitol: 5 patients; Supplementary Table 1).
Symptoms
During the baseline period, the medians of the overall gastrointestinal symptoms were 65 mm for the patients with carbohydrate malabsorption (min – max: 40–90) and 60 mm for the controls (min – max: 30–70) on the VAS. Malabsorbing patients further went into a single or combined lactose-, fructose-, sorbitol-minimized diet depending on the positively tested sugar malabsorption. Comparing VAS of BL vs. EL/TO in the overall cohort, we observed a significantly lower score at EL and TO compared to BL with substantial variability among individual participants, especially during TO phase after re-introduction of the malabsorbed sugars ( and Supplementary Figure 1A; ANOVA with repeated measures: factor (time): p < .0001). Overall, pain intensity was significantly lower after the intervention, and meteorism was significantly reduced after EL, whereas no change was observed for overall BSS (Supplementary Figure 1B). These individual differences in responses to tolerance diets are frequently observed in clinical IBS practice. We hypothesized that the elimination of a malabsorbed sugar for a short period of time will later allow nutrition counseling-supported tolerance to the sugar by some patients. To measure this, we stratified the cohort into diet responders vs. non-responder based upon VAS scores at the end of the TO phase (visit 4). Responders (n = 12) showed a reduction in VAS score greater than 25 mm (baseline – visit 4 at the end of the tolerance phase), whereas non-responder displayed little or no reduced VAS scores (n = 10; , left; and Supplementary Figure 1 for individual changes over time; ANOVA with repeated measures: factor (response): p = .068; interaction (time * response): p < .0001). Overall, responder patients reported a significantly lower VAS score at the end of the TO phase compared to non-responders (, right, p = .005 (Mann–Whitney test for responders vs. non-responders), uncorrected; p = .016 after Bonferroni correction); VAS scores at baseline were not significantly different between responders and non-responders (VAS scores [median (IQR)]: Resp: 70 (50); NR: 55 (20), p > .05 (Mann–Whitney test)); other IBS symptoms were also not different at baseline (see Supplementary Table 5). On a symptom level, pain intensity decreased significantly throughout the course of the study in both groups, but we did not detect differences in pain scores between diet responder and non-responder (). Bloating symptoms and BSS scores also decreased during diet intervention, but a repeated measures analysis over time did not reach statistical significance (). Comparing meteorism scores between responder and non-responder groups we found a significant difference at the end of the TO phase (p = .019, uncorrected; p = .058 after Bonferroni correction), but not for BSS (p = .70). Applying the SF-36 questionnaire for QoL measures, diet responders showed a significant increase of scores for the items physical functioning, bodily pain and general health during and after intervention, but there were not significant changes in individual scores in the non-responder group (Supplementary Table 3).
Figure 1. Clinical response to diet intervention in sugar malabsorbing IBS patients. (A) Flow diagram illustrating the study phases. (B) VAS scores and 95% CI bars displayed at baseline (BL) for participants with malabsorptions/intervention cohort (Intv) and controls (Ctrl) and during elimination (EL) and tolerance (TO) phase. (C) Left, VAS scores across study phases in diet responder (Resp, n = 12) vs. non-responder (NR, n = 10), 95% CI bars. Right, scatter plot of individual VAS scores at the end of TO phase in responder vs non-responder. (D) Median levels (+ IQR) of energy intake and diet components over time in the intervention cohort. (E) Distribution of responder vs. non-responder as percentage for individual or combined sugar malabsorptions. (F) Median intake of lactose, fructose or sorbitol with 95% CI bars at baseline, during EL and TO in patients with single or combined malabsorptions for the respective sugar presented as responder vs. non-responder (lactose: n = 3 (Resp)/4 (NR); fructose: n = 3 (Resp)/4 (NR); sorbitol: n = 10 (Resp)/9 (NR)). Data are presented as medians. *** p < .001 vs. BL (Wilcoxon matched-pairs rank test), # p < .01 (Mann–Whitney test).
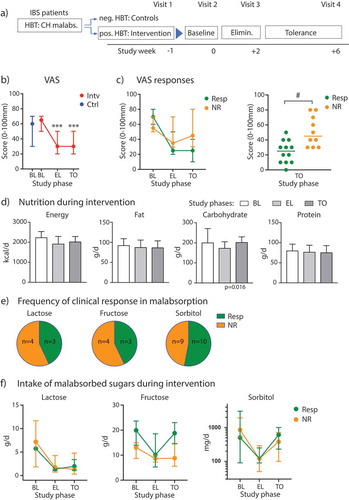
Table 1. Summary of IBS symptoms and nutrition over the course of the study in the intervention cohort.
Diet
Baseline dietary intake parameters did not differ between controls and the intervention cohort (Supplementary Table 4) and were comparable to published datasets in IBS diet intervention studies.Citation9,Citation16 During the diet intervention, we observed a slight decrease in daily total energy intake, mainly driven by a significant reduction in carbohydrate intake across all groups (Friedman test, p = .016) (). Fat and protein intake remained unaffected by the sugar diets. Analyzing the two subgroups, we observed that only the non-responders displayed a significant reduction in energy (p = .001, uncorrected; p = .0023 after Bonferroni correction) and carbohydrate intake (p = .002, uncorrected; p = .005 after Bonferroni correction) when comparing EL to BL (), whereas in the responder group these parameters changed only marginally.
Studying the tested malabsorbed carbohydrates in the intervention cohort, individual or combined sugar malabsorptions were almost equally distributed between responders and non-responders (). Regarding the intake of lactose, fructose and sorbitol in participants with either a single or combined sugar malabsorption, we found a significant change of lactose intake (ANOVA: p = .003), fructose intake (ANOVA: p = .0372) and sorbitol intake (ANOVA: p = .0049) over time (). Overall, these results implicate good compliance with diet restrictions in the intervention cohort, but they do not explain the difference in VAS scores between responder and non-responder groups, as both display reduced intake of the malabsorbed sugars in the EL phase of our study.
Gut microbiome analyzes
16S rRNA sequencing
In a first microbiome sequencing approach, 16S rRNA amplicon sequencing was successfully carried out on almost all samples collected (all control participants at baseline [n = 7 samples]; malabsorber/intervention cohort at baseline [n = 21], during EL [n = 18] and TO [n = 18 samples]). We analyzed alpha diversity as a measure of microbial community diversity using the Simpson’s index and observed no significant difference between participants in the diet intervention arm and the control IBS patients at baseline (; p = .87). During intervention, the alpha-diversity index did not change, and there was no difference between diet responder vs. non-responder (; ANOVA: p = .43 [factor time]; p = .82 [factor responder]). In addition, we did not observe correlations between VAS scores and Simpson’s indices at baseline or after TO (see Supplementary Figure 2).
Figure 2. Fecal microbiome analyzes by 16S rRNA amplicon sequencing. (A) Alpha-diversity levels shown as Simpson’s index in control participants and patients of the intervention group (split into Resp vs. NR) during different study periods. (B) Relative abundances of bacterial families in study participants. (C) Non-metric multidimensional-scaling (NMDS) plot of fecal microbiota beta-diversity indices (generalized UniFrac distances) from Resp vs NR at TO; p-value obtained by PERMANOVA.
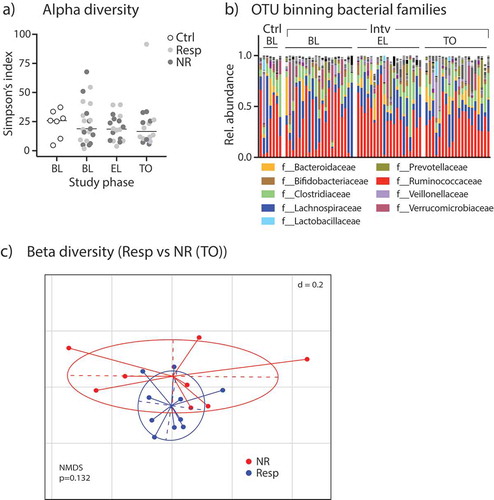
After correction for very rare OTUs in the fecal samples (less than 0.5% relative abundance of any taxa in any sample excluded), we found 652 different OTUs in the patients’ stool samples. The relative abundances of bacterial families in the control and intervention cohort for all time points is shown in . In order to statistically analyze the taxonomic differences between groups, we used the linear discriminant analysis (LDA) effect size (LEfSe) method: Comparing the fecal microbiome of controls and patients with sugar malabsorptions at baseline, five taxa comprising the genera Adlercreutzia and Ruminococcus and the families Coriobacteriaceae, Christensenellaceae and Ruminococcaceae were significantly different in the two cohorts (Supplementary Figure 3A and 3B).
We further analyzed beta-diversity analyzing control patients vs. patients in the intervention cohort (at all time points) dichotomized into diet responders vs. non-responders by principle coordinate analysis (PCoA)/non-metric multidimensional scaling (NMDS) analysis on generalized UniFrac distances of 16S rRNA-related OTUs and observed a significant group difference (Supplementary Figure 3C). Significant beta-diversity differences in the gut microbiome signatures between responders and non-responders were not observed at baseline (Supplementary Figure 3D, left), in EL or TO phase ( and Supplementary Figure 3D, right).
Shotgun-metagenome sequencing
16S rRNA sequencing allows reliable taxa resolution only up to the genus level and does not provide information about the functional characteristics such as representation of metabolic pathways. Thus, we performed shotgun-metagenome sequencing on fecal samples from controls (n = 7) and on samples from diet intervention patients at baseline (n = 23) and at TO phase (n = 21). We did not analyze samples from patients at EL phase as there were no taxa differences observed by 16S rRNA sequencing. We first compared the relative abundances of metabolic pathways between controls and patients with carbohydrate intolerances using the HUMAnN2 metagenome analysis algorithm.Citation26 Supplementary Figure 4 shows the most abundant pathways (411 metabolic pathways annotated in total in this study cohort) with differences in scaled relative abundances displayed in color stacks. To explore differences in pathway abundances between controls and malabsorbers, we carried out a LEfSe analysis and found that pathways covering branched amino acid synthesis, L-isoleucine biosynthesis and starch degradation are found to be more present in controls, whereas pathways for phosphopantothenate or queuosine biosynthesis are overrepresented in subjects with malabsorptions (). In Supplementary Table 6, we present median pathway abundances and FDR-corrected p-values after Kruskal–Wallis pairwise comparisons. Comparing the metabolic pathway abundances between responder and non-responder patients at baseline we found no discriminative features with an absolute LDA score > 2.0. Similarly, LEfSe revealed no significant difference in pathway abundances between metagenome samples from the BL vs. TO study phases within the malabsorber/intervention group. However, during TO we found a significant overrepresentation of several pathways in the responder group with starch degradation, tRNA charging and branched amino acid biosynthesis again were the most discriminative features in LEfSe (). The association of these pathways with clinical response remained significant after multivariate testing using fiber ingestion as a covariate and FDR-adjusting for multiple hypothesis testingCitation27 (Supplementary Table 7).
Figure 3. Metagenome sequencing of the gut microbiota to reveal metabolic pathways and taxa. (A) LEfSe analyzes to determine the most differentially abundant metabolic pathways between controls vs. subjects from the diet intervention group at baseline, and (B) to detect metabolic pathways significantly enriched in responder subjects (Resp) at TO study phase. (C) Relative contribution of individual bacterial species in an individual sample to either the branched chain amino acid (AA) synthesis pathway (left), the starch degradation pathway (middle) or the L-isoleucine biosynthesis pathway III (right), all samples (n = 51) included in this analysis. (D) Relative abundances (in %) of specific species associated with microbial metabolic pathways from Figure 3C in control subjects and responder vs. non-responder patients across the study period determined by shotgun-metagenome sequencing and Metaphlan2 analysis. (E) Sum of relative abundances of species from Figure 3D for each group. Data are presented as medians with interquartile ranges.
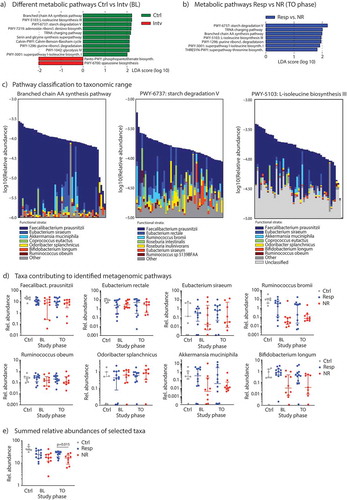
The pathways of starch degradation and branched amino acid biosynthesis discriminated control subjects from patients with malabsorptions and responder vs. non-responder after diet intervention. We asked whether specific bacterial species, and at which abundance, can contribute to these metabolic pathways in our cohort. As presented in , we found Faecalibacterium prausnitzii, Eubacterium, Ruminococcus and Roseburia spp. to contribute to starch degradation, and Faecalibacterium prausnitzii, Akkermansia muciniphila, Coprococcus eutactus, Odoribacter splanchnicus, Ruminococcus obeum and Bifidobacterium longum to encode branched chain amino acid synthesis and L-isoleucine biosynthesis. We further investigated the correlation of abundances between these metagenomic pathways and the selected taxa and observed significant correlations for Faecalibacterium, Bifidobacterium longi and ruminococci (Supplementary Table 8 and Supplementary Figure 5). Finally, we investigated the relative abundances of these species in the gut microbiota of our study cohort, and found that Faecalibacterium prausnitzii, Ruminococcus bromii, Akkermansia muciniphila or Bifidobacterium longum were less abundant in non-responders, especially at TO phase, but none reached statistical difference on its own (). However, if we summed the relative abundances of each of these selected species for each group, we found a significant difference at TO phase with responders having a significantly higher abundances of the summed species than non-responders (). In synopsis, these results suggest that not a single member of the gut commensal microbiota informs a microbial metabolic pathway, but it is rather determined by a defined ecology of various members of the commensal microbiota.
Discussion
Despite growing interest in the crosstalk between gut microbiota and dietary modulations in IBS, there is little data on the impact of specific carbohydrate diets on clinical symptoms and their association with specific intestinal microbiota profiles in IBS patients with carbohydrate malabsorptions. In the present study, we fill this gap by demonstrating that the clinical response to malabsorbed sugar-minimized/reduced diets is significantly associated with a specific, functional gut microbiota profile.
Previous studies already found that di- or monosaccharide malabsorptions and intolerances occur frequently in patients with functional gastrointestinal disorders.Citation19–Citation22 However, the prevalence rates for malsorptions of, e.g., lactose or fructose do not differ between healthy subjects and IBS patients when measured by objective diagnostic tools such as an HBT.Citation28,Citation29 Rates of sorbitol malabsorption are also reported to be similar between patients with IBS and healthy controls.Citation30 Nevertheless, the overall gastrointestinal symptoms increased significantly more in patients after sugar challenge tests, as demonstrated in fructose malabsorbing IBS patients. Adherence to a lactose-, fructose- or sorbitol-minimized diet can reduce IBS-associated symptoms.Citation20,Citation22,Citation31,Citation32 Despite some limitations in our study (as noted below), we also observed that a dietary restriction of a single or combined malabsorbed carbohydrate can significantly ameliorate IBS symptoms. However, when the sugar was continuously reintroduced to the diet with support from nutritional counseling, we observed that approximately 45% of all patients did not respond or lost initial relief toward the dietary intervention during the tolerance phase. This contrasts previous studies that reported non-response rates in only up to 20% of study participants.Citation20,Citation22 Such a difference in our response rate may be due to our rather stringent response criteria that were informed by the FODMAPs study of Halmos and colleagues,Citation9 and parallels recently published response rates in a meta-analysis evaluating low FODMAPs diet in IBS.Citation33 We can also exclude noncompliance, as we recorded a range of nutritional data in all study phases, and observed that the intake of lactose, fructose and sorbitol were significantly reduced during the elimination phase. Fructose intake remained low during the tolerance period in the non-responder subgroup, excluding an excess in fructose intake as a major cause for symptom relapse. In contrast to lactose, which was also only marginally re-introduced into the diet by our patients at TO, sorbitol intake almost returned back to baseline levels in both groups and fructose intake went up in responders. Despite some heterogeneity in diet compositions and malabsorption across our study cohort, this result indicates that additional factors other than digestion and carbohydrate absorption by the host can contribute to the clinical response observed in our study. One explanation for this surprising finding could come from changes in gut microbiota signatures and intrinsic metabolic capacities of the gut microbiota.
Our findings are consistent with other previously published data in the literature, Halmos et al. reported that a low FODMAPs diet significantly changes the gut microbiota of IBS patients.Citation16 A study by Bennet and colleagues observed that the clinical response to a low FODMAPs diet is determined by the baseline fecal microbial composition with adult non-responder patients showing a dysbiotic microbiota with an overrepresentation of Streptococcus and Dorea.Citation25 Similarly, in children with IBS, clinical response to a low FODMAPs diet was also linked to a specific set of intestinal bacteria.Citation34 Analysis of fecal metagenomic revealed changes in normal microbiome organization that suggest an association with disease state, especially in IBS and obese patients. Alterations in this organization can be affected by metabolites and enzymatic products mediated by diet.Citation35 This coincides with a study recently published by Wilson and colleagues who also found that a low FODMAP diet can influence gut microbiota in a beneficial way. They determined that fecal metabolites may predict if an IBS patient responds positively to dietary modulations.Citation36 These trends in the literature highlight the need for in depth gut metagenomic studies for targeted IBS therapies. Unlike previously published data, our study looks at specific sugar malabsorptions and associations of microbial metagenomic signatures with clinical responses to dietary interventions.
In our clinical study, we focused on whole microbiota ecologies rather than individual commensals. The alpha-diversity index was not different between controls and malabsorbers and did not change during intervention. This is congruent with previous results from a low FODMAPs intervention study by Staudacher et al.Citation11 Beta-diversity differences between controls vs. diet responder and non-responder patients were overall significant, but rather modest between the responders and non-responders at TO phase indicating that the diet intervention had only little effect on the 16S rRNA composition. Analysis of metagenomic metabolic pathways for the fecal microbiota showed that the microbial ecologies of IBS controls and malabsorbing patients differed a priori in metabolic pathways of starch degradation and amino acid biosynthesis (i.e., l-isoleucine biosynthesis or branched amino acid biosynthesis). This pattern was also found to be different between clinical VAS responder and non-responder patients at the end of the tolerance phase (but not at baseline between the two groups). This result demonstrates that the dietary intervention, especially during the sugar elimination period, reshaped the gut microbiota and its metabolic capacity in responder subjects such that it may potentially increase the metabolism of complex carbohydrates, starches and/or dietary fibers. In this context, we may speculate that the increased metabolic capacity of the intestinal microbiota could allow responders to digest previously malabsorbed sugars like fructose and sorbitol. In addition, this change in metabolic microbiota output can lead to an increase in beneficial microbial products, such as essential and complex amino acids. These pathways are also essential for the synthesis of short-chain fatty acids. Products such as butyrate, propionate, or acetate, are all of particular importance for gut mucosal homeostasis, metabolism and homeostatic gut-brain axis signaling.Citation17 We further evaluated which gut commensal species contribute to these pathways in particular, and fond Faecalibacterium prausnitzii, Ruminococcus spp., Akkermansia muciniphila and Bifidobacterium longum to inform these two pathways in our cohort. These species have previously been found to be associated with beneficial responses following low FODMAPs diets in IBS, e.g., Faecalibacterium prausnitzii and Ruminococcus spp.,Citation34 or Akkermansia muciniphila were observed to be linked with clinical responses after FMT – induced microbiota manipulations in IBS, and Bifidobacterium longum associated with mood alleviation in IBS.Citation37 None of these bacteria was prominent on its own in our patient subgroup, highlighting current concepts in microbiome research that defined ecologies, and not a single bacterium, contribute to health and disease phenotypes.Citation38
Despite these novel insights into diet – microbiome interactions, we would like to add that our study has limitations. Reliable subgroup analyzes for specific carbohydrate malabsorptions and IBS subtypes based on BSS scores could not be carried out because of a single-center design and limited patient number. Sample size calculations for study statistics are generally difficult in exploratory studies; we followed cohort sizes in similar IBS studies with carbohydrate diet interventions.Citation39–Citation41 Recent literature also reported pitfalls of HBTs, a widely used diagnostic tool for carbohydrate malabsorption.Citation42 Especially the issue of blinding has been a matter of discussion as these tests are usually performed open and IBS patients are prone to anticipation effects. In a recent study by Wilder-Smith et al., however, an HBT for fructose did not reveal significant difference in tolerance or malabsorbtion in patients with functional gastrointestinal disorders when performed open vs. blinded.Citation43
Although gut metagenome studies go far beyond conventional 16S rRNA microbiome sequencing, and add a functional component to the microbiome analysis, our study is associative in nature. It has also recently been demonstrated that different parts of the intestinal tract harbor a different luminal and mucosal commensal microbiota.Citation44 This may be relevant as we measured microbial metagenomes in feces, and not in the small bowel where sugar uptake occurs. As a result, we can only speculate about the mechanisms underlying microbiota effects on sugar malabsorption in IBS. We also cannot exclude any placebo effects that potentially contributed to beneficial VAS responses in the responder cohort, as our study was not randomized and double-blinded. At this point, we would like to mention a study by Shepherd et al.Citation41 who investigated the effects of fructose diet on IBS symptoms in fructose malabsorbing patients. Intriguingly, diet adherence significantly affected IBS symptoms with non- or partially adherent patients showing less symptom relief. Despite non-randomization, non-blinding and no placebo diet control, diet with full adherence improved clinical symptoms making the placebo component as a response trigger less likely. Still, there is a possibility that this may have affected gut microbiota signatures via “brain-to-gut” top-down signaling mechanisms, however, we are not aware of systematic studies approaching the latter question.
Furthermore, it needs to be discussed that changes in the gut microbiota of the intervention group might occur independent of the diet intervention along temporal fluctuations of the gut microbiota. In the analysis of the beta-diversity of non-malabsorbing controls vs. malabsorbing IBS patients (responders vs. non-responders) at baseline, we did not see a different clustering of these different patient subgroups (data not shown). We also did not find major changes in microbiota compositions between controls and malabsorbers at baseline. At least to our understanding, this excludes a change in microbial signatures independent of the diet intervention. However, there might be subgroup effects that cannot be revealed due to the limited sample size.
In conclusion, our study demonstrates for the first time that fecal microbial metagenomic signatures on the level of metabolic pathways are associated with the presence of sugar malabsorptions in IBS patients and with their clinical responses after carbohydrate-specific diet intervention. Future studies are required to test the robustness of our findings and evaluate therapeutic strategies to favorably manipulate the gut microbiota in patients that do not respond to diet interventions for a more beneficial clinical outcome.
Material and methods
The study cohort and protocol as well as sequencing and statistical analyzes are described in Supplementary Material and Methods.
Conflict of interest
The authors declare no conflict of interest.
Supplemental Material
Download PDF (1.2 MB)Acknowledgments
The authors thank D. Bajic for help with fecal sample preparation; A. Pastore for help with analyzes of metagenome sequencing data.
Supplementary material
Supplemental data for this article can be accessed on the publisher’s website.
References
- Mearin F, Lacy BE, Chang L, Chey WD, Lembo AJ, Simren M. Bowel disorders. Gastroenterology. 2016;S0016-5085(16)00222-5. doi:10.1053/j.gastro.2016.02.031.
- Longstreth GF, Thompson WG, Chey WD, Houghton LA, Mearin F, Spiller RC. Functional bowel disorders. Gastroenterology. 2006;130:1480–1491. doi:10.1053/j.gastro.2005.11.061.
- Drossman DA. Functional gastrointestinal disorders: history, pathophysiology, clinical features and Rome IV. Gastroenterology. 2016;150:1262–1279.e2. doi:10.1053/j.gastro.2016.02.032.
- Enck P, Junne F, Klosterhalfen S, Zipfel S, Martens U. Therapy options in irritable bowel syndrome. Eur J Gastroenterol Hepatol. 2010;22:1402–1411. doi:10.1097/MEG.0b013e3283405a17.
- Simrén M, Törnblom H, Palsson OS, Whitehead WE. Management of the multiple symptoms of irritable bowel syndrome. Lancet Gastroenterol Hepatol. 2017;2:112–122. doi:10.1016/S2468-1253(16)30116-9.
- Simrén M, Månsson A, Langkilde AM, Svedlund J, Abrahamsson H, Bengtsson U, Björnsson ES. Food-related gastrointestinal symptoms in the irritable bowel syndrome. Digestion. 2001;63:108–115. doi:10.1159/000051878.
- Böhn L, Störsrud S, Törnblom H, Bengtsson U, Simrén M. Self-reported food-related gastrointestinal symptoms in IBS are common and associated with more severe symptoms and reduced quality of life. Am J Gastroenterol. 2013;108:634–641. doi:10.1038/ajg.2013.105.
- Hayes P, Corish C, O’Mahony E, Quigley EM. A dietary survey of patients with irritable bowel syndrome. J Hum Nutr Diet. 2014;27(Suppl 2):36–47. doi:10.1111/jhn.2014.27.issue-s2.
- Halmos EP, Power VA, Shepherd SJ, Gibson PR, Muir JG. A diet low in FODMAPs reduces symptoms of irritable bowel syndrome. Gastroenterology. 2014;146:67–75.e5. doi:10.1053/j.gastro.2013.09.046.
- Böhn L, Störsrud S, Liljebo T, Collin L, Lindfors P, Törnblom H, Simrén M. Diet low in FODMAPs reduces symptoms of irritable bowel syndrome as well as traditional dietary advice: a randomized controlled trial. Gastroenterology. 2015;149:1399–407.e2. doi:10.1053/j.gastro.2015.07.054.
- Staudacher HM, Lomer MCE, Farquharson FM, Louis P, Fava F, Franciosi E, Scholz M, Tuohy KM, Lindsay JO, Irving PM, et al. A diet low in FODMAPs reduces symptoms in patients with irritable bowel syndrome and a probiotic restores bifidobacterium species: a randomized controlled trial. Gastroenterology. 2017;153:936–947. doi:10.1053/j.gastro.2017.06.010.
- McIntosh K, Reed DE, Schneider T, Dang F, Keshteli AH, De Palma G, Madsen K, Bercik P, Vanner S, et al. FODMAPs alter symptoms and the metabolome of patients with IBS: a randomised controlled trial. Gut. 2017;66:1241–1251. doi:10.1136/gutjnl-2015-311339.
- Shahbazkhani B, Sadeghi A, Malekzadeh R, Khatavi F, Etemadi M, Kalantri E, Rostami-Nejad M, Rostami K. Non-celiac gluten sensitivity has narrowed the spectrum of irritable bowel syndrome: a double-blind randomized placebo-controlled trial. Nutrients. 2015;7:4542–4554. doi:10.3390/nu7064542.
- Biesiekierski JR, Newnham ED, Irving PM, Barrett JS, Haines M, Doecke JD, Shepherd SJ, Muir JG, Gibson PR. Gluten causes gastrointestinal symptoms in subjects without celiac disease: a double-blind randomized placebo-controlled trial. Am J Gastroenterol. 2011;106:508–514. quiz 15. doi:10.1038/ajg.2010.487.
- Hill P, Muir JG, Gibson PR. Controversies and recent developments of the low-FODMAP diet. Gastroenterol Hepatol (N Y). 2017;13:36–45.
- Halmos EP, Christophersen CT, Bird AR, Shepherd SJ, Gibson PR, Muir JG. Diets that differ in their FODMAP content alter the colonic luminal microenvironment. Gut. 2015;64:93–100. doi:10.1136/gutjnl-2014-307264.
- Gill PA, van Zelm MC, Muir JG, Gibson PR. Review article: short chain fatty acids as potential therapeutic agents in human gastrointestinal and inflammatory disorders. Aliment Pharmacol Ther. 2018;48:15–34. doi:10.1111/apt.14689.
- Halmos EPCC, Bird AR, Shepherd SJ, Muir JG, Gibson PR. Consistent prebiotic effect on gut microbiota with altered FODMAP intake in patients with crohn’s disease: a randomised, controlled cross-over trial of well-defined diets. Clin Transl Gastroenterol. 2016;e164. doi:10.1038/ctg.2016.22.
- Yang J, Deng Y, Chu H, Cong Y, Zhao J, Pohl D, Misselwitz B, Fried M, Dai N, Fox M, et al. Prevalence and presentation of lactose intolerance and effects on dairy product intake in healthy subjects and patients with irritable bowel syndrome. Clin Gastroenterol Hepatol. 2013;11:262–8.e1. doi:10.1016/j.cgh.2012.11.034.
- Fernández-Bañares F, Rosinach M, Esteve M, Forné M, Espinós JC, Maria Viver J. Sugar malabsorption in functional abdominal bloating: a pilot study on the long-term effect of dietary treatment. Clin Nutr. 2006;25:824–831. doi:10.1016/j.clnu.2005.11.010.
- Choi YK, Kraft N, Zimmerman B, Jackson M, Rao SS. Fructose intolerance in IBS and utility of fructose-restricted diet. J Clin Gastroenterol. 2008;42:233–238. doi:10.1097/MCG.0b013e31802cbc2f.
- Wilder-Smith CH, Materna A, Wermelinger C, Schuler J. Fructose and lactose intolerance and malabsorption testing: the relationship with symptoms in functional gastrointestinal disorders. Aliment Pharmacol Ther. 2013;37:1074–1083. doi:10.1111/apt.2013.37.issue-11.
- Stern EK, Brenner DM. Gut microbiota-based therapies for irritable bowel syndrome. Clin Transl Gastroenterol. 2018;9:e134. doi:10.1038/ctg.2018.2.
- Liu HN, Wu H, Chen YZ, Chen YJ, Shen XZ, Liu TT. Altered molecular signature of intestinal microbiota in irritable bowel syndrome patients compared with healthy controls: A systematic review and meta-analysis. Dig Liver Dis. 2017;49:331–337. doi:10.1016/j.dld.2017.01.142.
- Bennet SMP, Böhn L, Störsrud S, Liljebo T, Collin L, Lindfors P, Törnblom H, Öhman L, Simrén M. Multivariate modelling of faecal bacterial profiles of patients with IBS predicts responsiveness to a diet low in FODMAPs. Gut. 2018;67:872-881. doi: 10.1136/gutjnl-2016-313128.
- Lloyd-Price J, Mahurkar A, Rahnavard G, Crabtree J, Orvis J, Hall AB, Brady A, Creasy HH, McCracken C, Giglio MG, et al. Strains, functions and dynamics in the expanded human microbiome project. Nature. 2017;550:61–66. doi:10.1038/nature23889.
- Morgan XC, Tickle TL, Sokol H, Gevers D, Devaney KL, Ward DV, Reyes JA, Shah SA, LeLeiko N, Snapper SB, et al. Dysfunction of the intestinal microbiome in inflammatory bowel disease and treatment. Genome Biol. 2012;13:R79. doi:10.1186/gb-2012-13-9-r79.
- Farup PG, Monsbakken KW, Vandvik PO. Lactose malabsorption in a population with irritable bowel syndrome: prevalence and symptoms. A case-control study. Scand J Gastroenterol. 2004;39:645–649. doi:10.1080/00365520410005405.
- Skoog SM, Bharucha AE, Zinsmeister AR. Comparison of breath testing with fructose and high fructose corn syrups in health and IBS. Neurogastroenterol Motil. 2008;20:505–511. doi:10.1111/nmo.2008.20.issue-5.
- Yao CK, Tan HL, van Langenberg DR, Barrett JS, Rose R, Liels K, Gibson PR, Muir JG. Dietary sorbitol and mannitol: food content and distinct absorption patterns between healthy individuals and patients with irritable bowel syndrome. J Hum Nutr Diet. 2014;27(Suppl 2):263–275. doi:10.1111/jhn.2014.27.issue-s2.
- Shepherd SJ, Gibson PR. Fructose malabsorption and symptoms of irritable bowel syndrome: guidelines for effective dietary management. J Am Diet Assoc. 2006;106:1631–1639. doi:10.1016/j.jada.2006.07.010.
- Klee B, Barske O, Mack A, Thoeringer CK, Haller B, Becker V, Nennstiel S. Sorbitol malabsorption in patients with abdominal discomfort. Minerva Gastroenterol Dietol. 2018;64:117–123. doi:10.23736/S1121-421X.17.02329-7.
- Dionne J, Ford AC, Yuan Y, Chey WD, Lacy BE, Saito YA, Quigley EMM, Moayyedi P. A systematic review and meta-analysis evaluating the efficacy of a gluten-free diet and a low FODMAPs diet in treating symptoms of irritable bowel syndrome. Am J Gastroenterol. 2018;113:1290–1300. doi:10.1038/s41395-018-0195-4.
- Chumpitazi BP, Cope JL, Hollister EB, Tsai CM, McMeans AR, Luna RA, Versalovic J, Shulman RJ. Randomised clinical trial: gut microbiome biomarkers are associated with clinical response to a low FODMAP diet in children with the irritable bowel syndrome. Aliment Pharmacol Ther. 2015;42:418–427. doi:10.1111/apt.13286.
- Greenblum S, Turnbaugh PJ, Borenstein E. Metagenomic systems biology of the human gut microbiome reveals topological shifts associated with obesity and inflammatory bowel disease. Proc Natl Acad Sci U S A. 2012;109:594–599. doi:10.1073/pnas.1116053109.
- Wilson B, Rossi M, Kanno T, Hough R, Probert C, Iriving P, Mason AJ, Lomer M, Whelan K. PWE-126 Low fodmap diet effect on IBS gastrointestinal microbiome and metabolites and prediction of response. Gut. 2018;67:A181–A182.
- Pinto-Sanchez MI, Hall GB, Ghajar K, Nardelli A, Bolino C, Lau JT, Martin F-P, Cominetti O, Welsh C, Rieder A, et al. Probiotic bifidobacterium longum NCC3001 reduces depression scores and alters brain activity: a pilot study in patients with irritable bowel syndrome. Gastroenterology. 2017;153:448–59.e8. doi:10.1053/j.gastro.2017.05.003.
- Duvallet C, Gibbons SM, Gurry T, Irizarry RA, Alm EJ. Meta-analysis of gut microbiome studies identifies disease-specific and shared responses. Nat Commun. 2017;8:1784. doi:10.1038/s41467-017-01973-8.
- King TS, Elia M, Hunter JO. Abnormal colonic fermentation in irritable bowel syndrome. Lancet. 1998;352:1187–1189. doi:10.1016/S0140-6736(98)02146-1.
- Bentley SJ, Pearson DJ, Rix KJ. Food hypersensitivity in irritable bowel syndrome. Lancet. 1983;2:295–297. doi:10.1016/S0140-6736(83)90285-4.
- Shepherd SJ, Parker FC, Muir JG, Gibson PR. Dietary triggers of abdominal symptoms in patients with irritable bowel syndrome: randomized placebo-controlled evidence. Clin Gastroenterol Hepatol. 2008;6:765–771. doi:10.1016/j.cgh.2008.02.058.
- Simren M, Stotzer PO. Use and abuse of hydrogen breath tests. Gut. 2006;55:297–303. doi:10.1136/gut.2005.075127.
- Wilder-Smith CH, Olesen SS, Materna A, Drewes AM. Repeatability and effect of blinding of fructose breath tests in patients with functional gastrointestinal disorders. Neurogastroenterol Motil. 2019;31:e13497. doi:10.1111/nmo.13497.
- Zmora N, Zilberman-Schapira G, Suez J, Mor U, Dori-Bachash M, Bashiardes S, Kotler E, Zur M, Regev-Lehavi D, Brik RBZ, et al. Personalized gut mucosal colonization resistance to empiric probiotics is associated with unique host and microbiome features. Cell. 2018;174:1388–405.e21. doi:10.1016/j.cell.2018.08.041.