
 ?Mathematical formulae have been encoded as MathML and are displayed in this HTML version using MathJax in order to improve their display. Uncheck the box to turn MathJax off. This feature requires Javascript. Click on a formula to zoom.
ABSTRACT
The approximately 1011 viruses and microbial cells per gram of fecal matter (dry weight) in the large intestine are important to human health. The responses of three common gut bacteria species, and one opportunistic pathogen, to 117 commonly consumed foods, chemical additives, and plant extracts were tested. Many compounds, including Stevia rebaudiana and bee propolis extracts, exhibited species-specific growth inhibition by prophage induction. Overall, these results show that various foods may change the abundances of gut bacteria by modulating temperate phage and suggests a novel path for landscaping the human gut microbiome.
Introduction
The human adult gut microbiome is numerically dominated by viruses, particularly the bacteriophages (a.k.a., phages), and bacteria belonging to the Bacteroidetes and Firmicutes phyla.1–Citation4 The relative abundances of particular gut bacteria strains and species are regulated through bottom-up (e.g., food) and top-down mechanisms like phage predation.Citation5,Citation6 Consumption of foods such as cocoa,Citation7 tea, wine, soy, and plant polyphenols;Citation8 nondigestible carbohydrate substrates such as resistant starches, plant cell wall material, and oligosaccharides;Citation9 specific fibers such as inulin,Citation10 and hemicellulose such as arabinoxylan,Citation11 have significant effects on the relative abundances of microbes in the gut and the metabolites they produce.
In the lumen of the gut, there is approximately 1 virus-like particle (VLP) for every bacterial cell.Citation12 Most of these VLPs are dsDNA phage. These phages play a protective role by adhering to mucus that lines the intestinal epithelium.Citation13,Citation14 Most phages in the human gut are temperate and integrated into the genomes of their bacterial hosts as prophage.Citation4 In turn, prophages are induced by certain foods and chemicals, including soy sauce,Citation15 nicotine, other cigarette chemicals,Citation16 sunscreen,Citation17 and antibiotics such as ciprofloxacin.Citation18
Prophage induction in gut bacteria may result in the horizontal transfer of genes to other bacterial strains or species. For example, prophages that encode Shiga exotoxin are induced by prophylactic antibiotics, like carbadox, and are known to move these exotoxins between E. coli strains in cattle.Citation19 Prophage induction can also alter the relative abundances of bacteria species/strains. This can lead to dysbiosis if pathogens fill the niche generated by lysed commensals. For example, benzo[a]pyrene-diol-epoxide in cigarette smoke induces multiple prophages that lyse beneficial lactobacilli, thereby enabling anaerobic pathogens to persist and cause bacterial vaginosis.Citation16 Different foods and diet types are associated with varying microbiome compositionsCitation20 and may shift gut community composition.Citation3,Citation21,Citation22 Thus, there is strong evidence that many common food and/or environmental compounds alter gut community composition, sometimes through prophage activation.
To identify additional compounds that induce prophages and/or affect gut community composition, ingestible compounds were tested for their effects on growth of human-associated Bacteroidetes (Bacteroides thetaiotaomicron strain VPI-5482), two Firmicutes (Enterococcus faecalis and Staphylococcus aureus), as well as the opportunistic pathogen Pseudomonas aeruginosa (Phylum Proteobacteria). To determine whether antimicrobial effects were due to prophage induction, compounds that inhibited bacterial growth were assayed for their ability to induce VLPs. Numerous compounds exhibited antimicrobial activity and several were identified as novel prophage-induction agents. Most of the compounds displayed differential activity on the test bacterial species, introducing the possibility of using diet to intentionally landscape the human gut microbiome via prophage induction.
Results
Effects of compounds on the growth of gut bacteria
B. thetaiotaomicron, E. faecalis, and S. aureus were tested for their growth in the presence of 117 consumable compounds (Supplementary Table S1). These taxa are common in human gut metagenomes, being detected in 84-94% of the 2,229 human gut metagenome datasets. The average relative abundances of B. thetaiotaomicron, E. faecalis, and S. aureus in these datasets were 8.04%, 0.55%, and 0.32%, respectively. Although not a typical member of the gut microbiota, P. aeruginosa was also screened because it is a common, opportunistic pathogen.
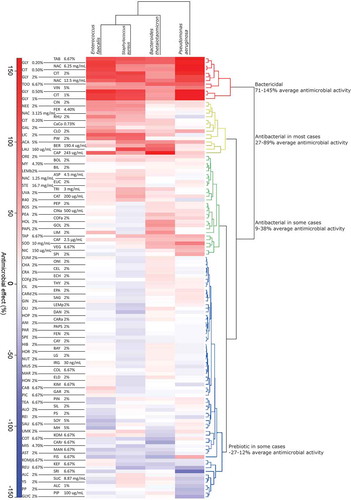
To identify compounds with antimicrobial properties, bacterial growth in the presence of each tested compound was compared to growth without any added compound (growth curves are shown in Supplementary Figure S3). Clustering of the growth curves identified general categories of antimicrobial activity (). The compounds with the strongest and most widespread bactericidal effects were Tabasco (TAB), glycolic acid (GLY), N-acetyl-cysteine (NAC), citric acid (CIT), toothpaste (TOO), and vinegar (VIN). Cinnamon (CIN), neem (NEE), licorice (LIC), Fernet (FER), and clove (CLO) were antibacterial in most cases. Aspartame (ASP), coffee Arabica (COFa), stevia (STE), trigonelline (TRI), and uva ursi (UVA) were antibacterial in some cases. Cottage cheese (COT), cayenne (CAY), miso (MIS), fish sauce (FIS), and reuterin (REU) had potentially prebiotic effects. See Supplementary Table S2 for a complete list of compounds and their effects.
Figure 1. Heat map of clustering based on the antimicrobial effect of each substrate, calculated as described in the Materials and Methods. Percent change in growth is indicated by color: red indicates less growth and blue indicates more growth compared to negative controls. Clusters are classified as bactericidal (red), antibacterial in most cases (yellow), antibacterial in some cases (green), and sometimes prebiotic (blue). Prebiotic compounds can only be digested and utilized by Bacteria, thereby facilitating their growth.
Prophage induction
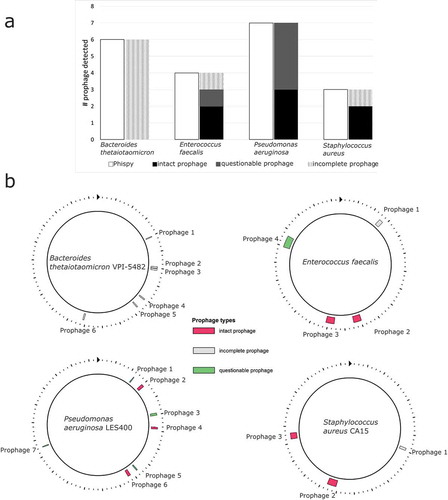
Bioinformatics analyses predicted functional prophages in all four bacterial species ( & Supplementary Table S3), opening the possibility that some of the bactericidal effects might be due to prophage induction. Flow cytometry was used to count VLPs when bacteria were incubated with antimicrobial compounds. Because lysogens produce some phage spontaneously, the VLPs in the treatments were compared to controls without the treatment compound. Compounds were chosen for flow cytometry analysis based on the following criteria: (1) growth curves that suggested a decline in logarithmic growth of at least 1.19 (peak to trough ratio) that might indicate prophage induction, and 2) growth curves where the shifted area under the curve (aucshifted) was less than the control, but not so low as to indicate the majority of bacteria were killed (see Supplementary Figure S5b). These criteria identified 28 compounds for counting VLPs via flow cytometry (). P. aeruginosa was excluded because its mucoid polysaccharides prevent efficient VLP counting in the flow cytometer.
Table 1. Reagents and concentrations chosen for flow cytometry testing based on the growth curve and heat map results. Concentrations were conserved across species where possible but sometimes increased to improve prophage induction or decreased to reduce cytotoxicity. The value next to each concentration is the ratio of the maximum OD of the growth curve to the lowest OD measured after this peak. If the concentration was adjusted for flow cytometry, the initial concentration is provided. Ratios above the 1.19 cutoff are bolded.
Figure 2. (a) A comparison of the number of putative prophages found by Phispy and PHAST. (B) Putative prophage in bacterial genomes calculated with PHAST. Each prophage’s length, genomic position, and most closely related phage are listed in Supplementary Table S3.
Of the 28 compounds tested with flow cytometry, eleven induced VLPs to levels higher than the no-compound control in at least one species (). For B. thetaiotaomicron, the strongest inductor was stevia, which displayed a 410% increase in VLPs in the treatment versus the control. Clove and propolis increased the number of VLPs by +185% and +115%, respectively, in B. thetaiotaomicron. The highest inducers for E. faecalis were uva ursi (+842%), propolis (+695%), and aspartame (+579%). For S. aureus, stevia (+321%), grapefruit seed extract (+103%), and toothpaste (+79%) were the strongest inducers ().
Figure 3. Induction of virus-like-particles (VLPs) by experimental compounds as detected by flow cytometry. VLPs were induced in B. thetaiotaomicron, E. faecalis, and S. aureus separately incubated with 28 compounds and the percent difference in abundances of VLPs were calculated relative to controls that lacked addition of any compound. Solid lines within cells represent deviations from 0 difference (dotted vertical line through columns).
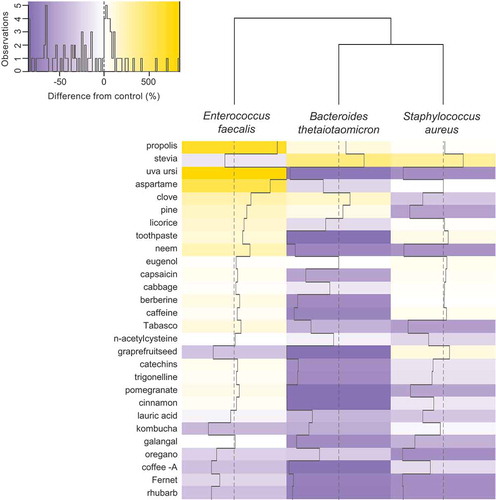
Several compounds reduced the number of VLPs relative to the control. Rhubarb (−62%), Fernet (57%), coffee Arabica (−49%), and oregano (−44%) reduced the number of VLPs in all bacterial species. Several other compounds suppressed VLPs in individual species. Pomegranate (−89%), grapefruit seed extract (−89%), toothpaste (−88%), and cinnamon (−88%) reduced VLP production in B. thetaiotaomicron. Kombucha reduced E. faecalis VLPs by 44%.
Uva ursi increased VLP production in E. faecalis by +842%, while markedly reducing VLP production in B. thetaiotaomicron (−83%) and S. aureus (−68%; ).
Discussion
Foods, herb and dietary supplements are potentially powerful tools to manipulate the relative abundances of gut bacteria. Most recent studies of diet and gut community composition compared prebiotic diets such as high plant polysaccharide vs. high fat/high sugar, Citation11 or high-fat/low fiber vs. low-fat/high fiber.Citation3 Our research complements these studies by identifying reductive modulators of bacterial abundances that may act by inducing prophages.
Hot sauces
Tabasco sauce at a final concentration of 3.3% (v/v) reduced the growth of all three GI species, except the opportunistic pathogen P. aeruginosa, by an average of 92% (Supplementary Table S2). Tabasco’s antimicrobial activity was not solely due to the vinegar, as the vinegar test reduced bacterial growth in all species by an average of 71%. The additional bactericidal activity may be capsaicinCitation23 – a known antimicrobial in hot peppers. Capsaicin had antibacterial effects in our experiments at a concentration of 486 μg ml−1. Since this concentration is much higher than that found in Tabasco, the vinegar and capsaicin may be synergistically interacting to decrease bacterial growth. VLPs were not detected when any species was incubated with Tabasco, vinegar, or capsaicin, so these antimicrobial effects were not due to prophage induction. Kurita et al. found that genes contributing to DNA repair mechanisms were not induced by capsaicin, and that antimicrobial activity was due to membrane damage and osmotic stress.Citation24
Tapatío, a hot sauce similar to Tabasco, reduced bacterial growth by an average of 37% at a final concentration of 6.7% (v/v). Conversely, Sriracha sauce, which contains very similar ingredients as the Tapatío and Tabasco increased growth at a concentration of 6.7% (v/v). This is probably due to the sugar in the Sriracha. The overall antimicrobial effect of Tabasco suggests that an ingredient or a combination of ingredients make it a potent modulator of gut community structure. The consumption of Tabasco and other hot sauces could potentially have similar effects as low dose antibiotics,Citation25,Citation26 due to their powerful antimicrobial properties and high frequency of consumption in some populations.
Hot sauces carry eukaryotic viruses like pepper mild-mottled virus (PMMV), which was the primary RNA virus found in human fecal samples.Citation27 PMMV was found in 4 of 7 chili sauces, indicating that some viruses survived food production processes.Citation27 However, in a flow cytometry analysis of Tabasco diluted in BHIS media, there were no detectable viruses (Supplementary Figure S4).
N-acetyl-cysteine (NAC)
NAC had a strong antimicrobial effect in all species. NAC is a synthetic amino-acid supplement that is converted to glutathione in the body.Citation28 NAC is used as a supplement to treat acetaminophen toxicityCitation28 and Parkinson’s disease,Citation29 to reduce influenza symptoms and viral replication,Citation30 and as a mucolytic agent for cystic fibrosis and chronic obstructive pulmonary disease patients.Citation25 NAC is also used to treat Helicobacter pylori infection in the stomach,Citation26 which implies that NAC may affect the gut microbiome despite stomach acids. NAC is bacteriostatic and inhibitory against biofilm formation in P. aeruginosaCitation31 and E. faecalis.Citation32 In the case of E. faecalis, NAC inhibits infections and biofilm formation following root canal treatment. NAC is thought to be antimicrobial due in part to the effect of its sulfhydryl groups reacting with essential proteins.Citation33 This is consistent with the absence of prophage induction by NAC despite its strong antimicrobial activity.
Several other compounds featured in folklore and world medicine – cinnamon, neem, rhubarb, licorice, pine, and clove – as well as the bitter aromatic herbal spirit Fernet Branca, demonstrated differential antimicrobial effects in our study ().
Prophage inducers
Stevia, an artificial sweetener extracted from the plant species Stevia rebaudiana, was the most potent prophage inducer with an increase of 410% and 321% VLPs detected from B. thetaiotaomicron and S. aureus, respectively. Several studies have demonstrated the antimicrobial potential of stevia extracts,Citation34–Citation36 but none has proposed a mechanism of action. Abundant terpenes may be responsible for the antimicrobial properties of stevia (as reviewed byCitation37). Our results agree with this possibility, in that terpenes have been shown to be more effective against gram-positive bacteria (E. faecalis and S. aureus). Tomita et al.Citation36 showed that fermented stevia is effective against food-borne pathogenic bacteria, with no significant killing of gut microbes.Citation36 A stevoside mixture from Stevia rebaudiana has also been shown to be anti-tumorigenic,Citation38,Citation39 which may involve proviral induction. Together, these studies and our results suggest stevia could be used to manipulate the gut microbiome.
Artificial sweeteners such as saccharin, sucralose, and aspartame have been shown to have detrimental effects, such as decreased glucose tolerance, that are initiated by alterations of gut flora.Citation40,Citation41 Suez et al.Citation41 showed that saccharin supplementation triggered gut dysbiosis and increased Bacteroides spp. abundance in mice. Our results showed a decrease in growth for all species challenged with aspartame, and differential effects from sucraloseCitation42 found that recent consumers of aspartame or acesulfame-K had significant differences in bacterial diversity compared to non-consumers.Citation42 While we only measured the effects of artificial sweeteners on three gut microbes, the data presented here may fall into the dysbiosis paradigm. Additionally, the increased VLP expression in E. faecalis when challenged by aspartame provides mechanistic insight into the potential cause of dysbiosis.
A propolis glycerite increased VLP abundances by 115% and 695% for B. thetaiotaomicron and E. faecalis, respectively. This and other bee products were hypothesized to increase prophage expression based on the antimicrobial effects of honey, which are a product of hydrogen peroxide (a known prophage inducer) and phenolic activity.Citation43,Citation44 It showed that in mice, a 2 or 5-week high-fat diet containing 0.2% w/w of crude propolis extract mitigated the community composition shift toward an increased Firmicutes:Bacteroidetes ratio and subsequent inflammatory markers that result from high-fat diets. This suggests that propolis could be another supplement for shifting or maintaining gut community composition. We were unable to measure whether any bee products were antimicrobial because they formed precipitates that obfuscated OD600 nm readings. Nevertheless, increased VLP production was observed in the Firmicute E. faecalis, suggesting that prophage induction may be partly responsible for the equalizing effect of propolis on the Firmicutes:Bacteroidetes ratio.
Some of the compounds tested for prophage induction had significantly fewer VLPs in their supernatants relative to the mean, and for some compounds, the effect varied between species (). Compounds with the greatest reduction in VLPs are strongly supported in the literature as antivirals – namely rhubarb,Citation45–Citation47 coffee,Citation48–Citation50 oregano,Citation51,Citation52 and pomegranate.Citation53–Citation55
Caveats
For the most part, growth curves did not produce the characteristic pattern of a prophage induction. The lack of a characteristic “induction” growth curve means that future studies of potential prophage inducers show a direct measure of VLPs like flow cytometry or epifluorescence microscopy. Future work needs to determine which prophage is induced by the test treatments. Our study was conducted on one strain of each bacterial species, so these results may not be generalizable to other strains of each species. Therefore, further studies are needed to test the effects of these compounds on additional gut bacteria in vivo, particularly because enzymatic and/or pH alterations of the compounds may occur before they reach the large intestine. Input into a simulator of the intestinal microbial ecosystem (SHIME)Citation56 would be a logical next step. In vivo investigations could be performed in gnotobiotic mice or humans, considering most compounds are recognized as safe food products.
Conclusions
Here we expanded the possibility of microbiome landscaping through intentional ingestion of particular dietary compounds that modulate bacterial abundances in the gut. We found that some compounds act as reductive modulators by inducing prophages, and because some of these are surprisingly common ingredients (e.g., aspartame, toothpaste), diet-induced prophage activation is likely a regular occurrence in the gut ecosystem. As these ingredients are consumed by populations around the world, these mechanisms could further our understanding of how particular foods shape gut microbiomes. They could also provide experimental tools for identifying novel mechanisms of prophage induction; these tools are essential for probing the dark matter of viral functional diversity, and for determining how phages influence and are affected by their environments.
Materials and methods
Bacterial strains and media
B. thetaiotaomicron VPI-5482 (NCBI Taxonomy #226186, Genbank #AE015928.1) and E. faecalis (ATCC #19433, NCBI Taxonomy #1169286) were used for this study. The P. aeruginosa strain RM1 was isolated on cetrimide media from the lung biopsy of a cystic fibrosis donor and S. aureus was isolated from a human fecal sample.Citation1 Bacteria from frozen glycerol stocks were streaked onto supplemented brain–heart infusion (BHIS) plates that were incubated at 37°C for 24 h unless otherwise described. B. thetaiotaomicron VPI-5482 was incubated for 48 h on Schaedler Blood Agar OxyPlates (Oxyrase – Mansfield Ohio).
S. aureus, E. faecalis, and P. aeruginosa were cultured in 3–5 mL of Brain-Heart Infusion Broth (Becton, Dickson, and Company – Sparks, Maryland) supplemented with the following per liter (BHIS): hemin 5 mg, menadione 1 mg, yeast extract 5 g, L-cysteine HCl 50 mg, MgSO4 120 mg, and CaCl2 50 mg. For B. thetaiotaomicron, Oxyrase for Broth (Oxyrase – Mansfield Ohio) was added to BHIS at a concentration of 4% v/v, and media was pre-incubated at 37°C for at least 1 h to ensure complete removal of oxygen (O2). Mineral oil (~1 mL) was floated over the top of inoculated media to maintain anaerobiosis. All species were incubated until the late exponential phase, for up to 24 h at 37°C and shaken at 250 RPM.
Predicting prophages in genomes
To verify prophages are present in these bacterial strains, each genome was screened using Phage Search Tool (PHAST)Citation57 and PhiSpy.Citation58 Because the strains of P. aeruginosa and S. aureus used in this study do not have genome sequences available, genomes from strains also isolated from humans (P. aeruginosa LES400 and S. aureus CA15) were screened for prophage content.
Screening compounds and master plate preparation
One hundred seventeen compounds were screened for antimicrobial activity (Supplementary Table S1). Compounds were selected to include those with known, presumed, or anecdotal antimicrobial activity and test concentrations were obtained from peer-reviewed literature when possible. All compounds were formulated (see Supplementary Table S1), filter-sterilized and then stored in two master 96-well plates (MP1 and MP2) so that a common volume (10 or 20 μL depending on total well volume) could be added to each test-well.
Bacterial growth and prophage-induction assays
Bacteria were cultured in the presence of each of the 117 test compounds for 24 h in 96-well plates. A single colony from each species was used to inoculate a 3 mL liquid BHIS overnight culture, and 140 μL of diluted overnight culture (1:10 in BHIS) was then mixed with 10 μL of test compound solution. For B. thetaiotaomicron, volumes were doubled and 96-well plates sealed with SealPlate Film (Excel Scientific) to promote anaerobic conditions. The following controls were included: BHIS alone (media control), bacteria in BHIS without test compound (bacterial viability control), and each diluent used for the various test compounds (Supplementary Table S1). Using a SpectraMax M2 plate reader/incubator, optical density (OD) at 600 nm (OD600 nm) was measured every 10 min for E. faecalis, S. aureus, and P. aeruginosa, and every 60 min for B. thetaiotaomicron.
Preliminary tests showed that known prophage inducers, mitomycin-C and carbadox, Citation59 reproducibly affected the growth of P. aeruginosa and E. faecalis: logarithmic growth was followed by a rapid decline in OD600 nm as host cells were lysed (Supplementary Figure S2). This pattern of bacterial growth served as a guide for identifying prophage induction; those test compounds eliciting a similar growth profile were further analyzed at varying concentrations. Each test was accompanied by a positive “induction” control of carbadox (Sigma-Aldrich) at a range of final concentrations (Supplementary Figure S3).
Growth curve analyses
The PMAnalyzer pipeline was used to analyze the growth curves (Supplementary Figure S3A).Citation60,Citation61 The PMAnalyzer pipeline receives OD files from the microtiter plate reader as an input and uses the SciPy Python numerical library to model each growth curve.Citation62 Each growth curve was fitted with the Zwietering model to predict the y0 (OD600 nm where growth begins), lag time, maximum growth rate, and biomass yield.Citation63 For this study, several new metrics were added to the pipeline. First, the area under the curve (auc) was calculated using the SciPy integrate library to perform integration on the growth curve using the composite trapezoidal rule. Second, the shifted area under the curve (aucshifted) was calculated using the formula:
where auc is the area under the curve, y0 is the starting OD600 nm value predicted by the Zwietering model and tf is the final time point of the experiment. By using the aucshifted calculation, the y-axis cutoff of y = 0 becomes the actual starting optical density, providing a method of normalization necessary for downstream analysis (Supplementary Figure S3B). Raw growth curves were plotted in R using ggplot2.Citation64
Differences between growth curves were analyzed by comparing experimental wells to controls using a method similar to one developed by FirsovCitation65 who determined that the antimicrobial effect of any compound could be measured by directly comparing the growth of cells when the compound is present or absent. For each growth curve the aucshifted was calculated and then compared to the aucshifted from negative control wells (Supplementary Figure S3B) to derive the antimicrobial effect (%) of each compound:
where C is the shifted area under the growth curve for control (no test compound added) and E is the shifted area under the growth curve for experimental (test compound added).
For each microorganism, the mean antimicrobial effect (Supplementary Table S2) of each compound was used to generate a clustering heatmap in R using the gplots library.Citation66,Citation67 Dendrograms were created in gplots and used to re-order the heatmap, clustering by the compound response and similar bacterial response.
The following compounds were excluded from the heatmap analysis because they formed precipitates in the wells or were too opaque to accurately measure OD600 nm: apple skin (APP), eugenol (EUG), grapefruit seed extract (GRA), pomegranate (POM), propolis glycerite (PROg) and turmeric (TUR). Although these compounds could not be used for growth curve analyses, they were suitable for flow cytometry.
VLP quantification with flow cytometry
Each compound listed in was tested for its ability to induce prophages in B. thetaiotaomicron, E. faecalis and S. aureus using flow cytometry. These compounds were chosen based on the ratio of the maximum OD600 nm of the growth curve to the lowest OD600 nm measured after this peak. The cutoff ratio was set to 1.19, which is the ratio observed when B. thetaiotaomicron was incubated with 1 ug ml−1 of carbadox. Some special cases were included that did not meet the ratio criteria. Licorice (LIC) and toothpaste (TOO) had strong antimicrobial/inhibitory effects without typical induction growth-curves. Although propolis could not be used for growth curve analyses, it was included in flow cytometry analysis based on our hypothesis that bee products’ peroxide-mediated antimicrobial effectCitation43,Citation68 may trigger prophage induction as does peroxide.Citation69,Citation70 An extract of coffee Arabica was included since pure caffeine had a ratio above 1.19 in two of the three species tested.
Overnight liquid cultures were diluted 1:100 in BHIS media and an aliquot (130 μL) of each dilution (260 μL for B. thetaiotaomicron) was transferred to plate wells in duplicate and grown in a SpectraMax M2 plate reader, as described above, until cultures reached early log growth phase. Turbidity of approximately 0.25, 0.35, 0.45 was reached for S. aureus, E. faecalis, and B. thetaiotaomicron, respectively. Upon reaching log growth, antimicrobial test solutions were added to each well, at concentrations optimized for each species based on data from growth curves and heat maps (). Optimal concentrations of traditional prophage inducers slightly inhibit bacterial growth without causing excessive cytotoxicity;Citation71 therefore, the concentration of each antimicrobial compound was optimized to be similar for each species while maximizing prophage induction and minimizing cytotoxicity (). Bacteria were incubated for 4–5 h with each test compound before well contents were removed. Duplicate wells were not sampled but were returned to the plate reader/incubator to determine the growth curve (Supplementary Figure S5a). Growth curves were similar to those in Supplementary Figure S3, with few minimal differences due to compound concentrations being optimized for flow cytometry. The antimicrobial effect of each compound was defined as the negative percent difference between the control and test shifted area under the curve (Supplementary Figure S5b).
Samples were prepared for flow cytometry with the following procedure adapted from Brussaard et al.Citation72 First, bacteria incubated alone or with food and herbal extracts were transferred from 96-well plates to epi-tubes and centrifuged for 5 min at 4000 RPM. A portion (10 μL) of the supernatant was then combined with 970 μL of sterile SM buffer. The purpose of the bacteria grown alone in the plate was to create bacteria controls so that VLP production between bacteria grown with and without experimental compounds could be compared. All samples were then stored overnight at 4°C. Samples were fixed by adding 0.5% (v/v) glutaraldehyde (final concentration) to each sample, vortexing and then incubating at 4°C for 30 min. To stain samples, 10 μL of a 10X solution of SYBR Green I (Thermo Fisher Scientific) was mixed with 200 μL of each fixed sample and then this mixture was heated at 80°C for 10 min, then held at 4°C for 5 min. As an internal flow rate standard, 5 μL of Fluoresbrite yellow-green 0.75 μm microspheres (starting concentration of 107 beads mL−1, Polysciences Inc.) were added to each experimental well containing 195 μL of the sample. Prior to analysis, the BD FACSCanto flow cytometer sheath fluid was replaced with Milli-Q water to reduce the background noise of the instrument and to aid in the separation of stained VLPs. To ensure cleanliness of the machine, 10% bleach followed by Milli-Q water were acquired for 20 min each or until Milli-Q water reached ≤30 events/second, while thresholding on side scatter 200. All samples were analyzed in standard mode utilizing the high-throughput sampler (HTS) 96-well plate reader. For enumeration, 30 μL of each sample was analyzed at a flow rate of 0.5 μL s−1 followed by Milli-Q water to wash any residual products or dye. The 488 nm blue laser was used to excite the SYBR green dye detected in the FITC channel (530/30 nm bandpass filter preceded by a 502 nm long pass mirror). Threshold gating was applied in the FITC channel above the background noise of the Milli-Q water controls. As a positive control, E. coli phage T4 virions (106 VLPs mL−1) were used to confirm that VLPs were detectable in this region. Salmonella enterica serovar Typhimurium strain LT2 [78, 79] incubated with the known prophage inducers mitomycin C and carbadox was used as a positive control (Supplementary Figure S4).
Bivariate plots displaying the FITC channel versus side scatter were created to differentiate beads and microbes from samples so that VLPs could be measured. These values were compared to background controls to determine which conditions had elevated VLPs compared to the control. This comparison was calculated as a percent difference between the test condition and the control (Supplementary Table S4). All data were collected and analyzed on FACSDiva 6.1.1 software (BD Biosciences – San Diego, CA).
Species abundance in environmental samples
To determine ubiquity and abundance of these four species in the human gut, 2,299 human gut metagenomes were chosen from the Sequence Read Archive that were identified to be shotgun sequenced by PARTIE.Citation73 These datasets were then scanned using SearchSRA.Citation74 When a species was found to be present in a metagenome, the number of reads assigned to that species per 10,000 reads was used to calculate its relative abundance. For quality control, reads less than 50 bp or 90% identity were excluded.
Conflict of Interest
The authors report no conflict of interest.
Supplemental Material
Download Zip (8.2 MB)Acknowledgments
This work was supported by an R01 grant from the National Institutes of Health (GM95384-04) to F.L.R. Special thanks to Dr. Yan Wei Lim and Dr. Jeremy Barr for their mentorship and advice. Thanks to Dr. Jeffrey Gordon and Dr. Janaki Lelwala-Guruge for the Bacteroides thetaiotaomicron strain, Dr. Tasha Marie Santiago-Rodriguez for the Enterococcus faecalis strain and Dr. Anca Segall for the Salmonella enterica serovar Typhimurium strain LT2.
Supplementary Material
Supplemental data for this article can be accessed on the publisher’s website.
Correction Statement
This article has been republished with minor changes. These changes do not impact the academic content of the article.
Additional information
Funding
References
- Turnbaugh PJ, Gordon JI. 2009. The core gut microbiome, energy balance and obesity. J Physiol. 587:4153–4158. doi:10.1113/jphysiol.2009.174136.
- Dutilh BE, Cassman N, McNair K, Sanchez SE, Silva GGZ, Boling L, Barr JJ, Speth DR, Seguritan V, Aziz RK, et al. 2014. A highly abundant bacteriophage discovered in the unknown sequences of human faecal metagenomes. Nat Commun. 5:1–11. doi:10.1038/ncomms5498.
- Minot S, Sinha R, Chen J, Li H, Keilbaugh SA, Wu GD, Lewis JD, Bushman FD. 2011. The human gut virome: inter-individual variation and dynamic response to diet. Genome Res. 21:1616–1625. doi:10.1101/gr.122705.111.
- Reyes A, Haynes M, Hanson N, Angly FE, Heath AC, Rohwer F, Gordon JI. 2010. Viruses in the faecal microbiota of monozygotic twins and their mothers. Nature. 466:334–338. doi:10.1038/nature09199.
- Mills S, Shanahan F, Stanton C, Hill C, Coffey A, Paul Ross R. 2013. Movers and shakers: influence of bacteriophages in shaping the mammalian gut microbiota. Gut Microbes. 4:4–16. doi:10.4161/gmic.22371.
- Reyes A, Wu M, McNulty NP, Rohwer FL, Gordon JI. 2013. Gnotobiotic mouse model of phage-bacterial host dynamics in the human gut. Proc Natl Acad Sci. 110:20236–20241. doi:10.1073/pnas.1319470110.
- Jang S, Sun J, Chen P, Lakshman S, Molokin A, Harnly JM, Vinyard BT, Urban JF, Davis CD, Solano-Aguilar G, et al. 2016. Flavanol-enriched cocoa powder alters the intestinal microbiota, tissue and fluid metabolite profiles, and intestinal gene expression in pigs. J Nutr. 146:673–680. doi:10.3945/jn.115.222968.
- Etxeberria U, Fernández-Quintela A, Milagro FI, Aguirre L, Martínez JA, Portillo MP. 2013. Impact of polyphenols and polyphenol-rich dietary sources on gut microbiota composition. J Agric Food Chem. 61:9517–9533. doi:10.1021/jf402506c.
- Louis P, Scott KP, Duncan SH, Flint HJ. 2007. Understanding the effects of diet on bacterial metabolism in the large intestine. J Appl Microbiol. 102:1197–1208. doi:10.1111/jam.2007.102.issue-5.
- Roberfroid MB. 2005. Introducing inulin-type fructans. Br J Nutr. 93(Suppl 1):S13–5. doi:10.1079/BJN20041350.
- Wu, M., McNulty, N.P., Rodionov, D.A., Khoroshkin, M.S., Griffin, N.W., Cheng, J., Latreille, P., Kerstetter, R.A., Terrapon, N., Henrissat, B, et al. Genetic determinants of in vivo fitness and diet responsiveness in multiple human gut Bacteroides. Sci. 3502015; 350.
- Cobián Güemes AG, Youle M, Cantú VA, Felts B, Nulton J, Rohwer F. 2016. Viruses as winners in the game of life. Annu Rev Virol. 3:197–214. doi:10.1146/annurev-virology-100114-054952.
- Barr JJ, Auro R, Furlan M, Whiteson KL, Erb ML, Pogliano J, Stotland A, Wolkowicz R, Cutting AS, Doran KS, et al. 2013. Bacteriophage adhering to mucus provide a non-host-derived immunity. Proc Natl Acad Sci U S A. 110:10771–10776. doi:10.1073/pnas.1305923110.
- Carda-Diéguez M, Mizuno CM, Ghai R, Rodriguez-Valera F, Amaro C. 2015. Replicating phages in the epidermal mucosa of the eel (Anguilla anguilla). Front Microbiol. 6:3.
- Willner D, Furlan M, Schmieder R, Grasis JA, Pride DT, Relman DA, Angly FE, McDole T, Mariella RP, Rohwer F, et al. 2011. Metagenomic detection of phage-encoded platelet-binding factors in the human oral cavity. Proc Natl Acad Sci. 108:4547–4553. doi:10.1073/pnas.1000089107.
- Pavlova SI, Tao L. 2000. Induction of vaginal Lactobacillus phages by the cigarette smoke chemical benzo[a]pyrene diol epoxide. Mutat Res - Genet Toxicol Environ Mutagen. 466:57–62. doi:10.1016/S1383-5718(00)00003-6.
- Danovaro R, Corinaldesi C. 2003. Sunscreen products increase virus production through prophage induction in marine bacterioplankton. Microb Ecol. 45:109–118. doi:10.1007/s00248-002-1033-0.
- Chen Q, Tang S, Jin X, Zou J, Chen K, Zhang T, Xiao X. 2009. Investigation of the genotoxicity of quinocetone, carbadox and olaquindox in vitro using Vero cells. Food Chem Toxicol. 47:328–334. doi:10.1016/j.fct.2008.11.020.
- O’Brien AD, Newland JW, Miller SF, Holmes RK, Smith HW, Formal SB Shiga-like toxin-converting phages from Escherichia coli strains that cause hemorrhagic colitis or infantile diarrhea. Sci 1984; 226: 694–696. doi: 10.1126/science.6387911
- Lozupone CA, Stombaugh J, Gonzalez A, Ackermann G, Wendel D, Vázquez-Baeza Y, Jansson JK, Gordon JI, Knight R. 2013. Meta-analyses of studies of the human microbiota. Genome Res. 23:1704–1714. doi:10.1101/gr.151803.112.
- Turnbaugh PJ, Ridaura VK, Faith JJ, Rey FE, Knight R, Gordon JI. 2009. The effect of diet on the human gut microbiome: a metagenomic analysis in humanized gnotobiotic mice. Sci Transl Med. 1:6ra14. doi:10.1126/scitranslmed.3000322.
- Howe A, Ringus DL, Williams RJ, Choo ZN, Greenwald SM, Owens SM, Coleman ML, Meyer F, Chang EB. 2016. Divergent responses of viral and bacterial communities in the gut microbiome to dietary disturbances in mice. Isme J. 10:1217–1227. doi:10.1038/ismej.2015.183.
- Gonzalez R, Dunkel R, Koletzko B, Schusdziarra V, Allescher HD. 1998. Effect of capsaicin-containing red pepper sauce suspension on upper gastrointestinal motility in healthy volunteers. Dig Dis Sci. 43:1165–1171. doi:10.1023/A:1018831018566.
- Kurita S, Kitagawa E, Kim C-H, Momose Y, Iwahashi H. 2002. Studies on the antimicrobial mechanisms of capsaicin using yeast DNA microarray. Biosci Biotechnol Biochem. 66:532–536. doi:10.1271/bbb.66.532.
- Henke MO, Ratjen F. 2007. Mucolytics in cystic fibrosis. Paediatr Respir Rev. 8:24–29. doi:10.1016/j.prrv.2007.02.009.
- Huynh HQ, Couper RTL, Tran CD, Moore L, Kelso R, Butler RN. 2004. N-acetylcysteine, a novel treatment for Helicobacter pylori infection. Dig Dis Sci. 49:1853–1861. doi:10.1007/s10620-004-9583-2.
- Zhang, T., Breitbart, M., Lee, W.H., Run, J.Q., Wei, C.L., Soh, S.W.L., Hibberd, M.L., Liu, E.T., Rohwer, F. and Ruan, Y. 2006. RNA viral community in human feces: prevalence of plant pathogenic viruses. PLoS Biol. 4:0108–0118.
- Lauterburg BH, Corcoran GB, Mitchell JR. 1983. Mechanism of action of N-acetylcysteine in the protection against the hepatotoxicity of acetaminophen in rats in vivo. J Clin Invest. 71:980–991. doi:10.1172/JCI110853.
- Holmay MJ, Terpstra M, Coles LD, Mishra U, Ahlskog M, Öz G, Cloyd JC, Tuite PJ. 2013. N-acetylcysteine boosts brain and blood glutathione in gaucher and Parkinson diseases. Clin Neuropharmacol. 36:103–106. doi:10.1097/WNF.0b013e31829ae713.
- Geiler J, Michaelis M, Naczk P, Leutz A, Langer K, Doerr H-W, Cinatl J. 2010. N-acetyl-L-cysteine (NAC) inhibits virus replication and expression of pro-inflammatory molecules in A549 cells infected with highly pathogenic H5N1 influenza A virus. Biochem Pharmacol. 79:413–420. doi:10.1016/j.bcp.2009.08.025.
- Parry MF, Neu HC. 1977. Effect of N-acetylcysteine on antibiotic activity and bacterial growth in vitro. J Clin Microbiol. 5:58–61.
- Quah SY, Wu S, Lui JN, Sum CP, Tan KS. 2012. N-acetylcysteine inhibits growth and eradicates biofilm of Enterococcus faecalis. J Endod. 38:81–85. doi:10.1016/j.joen.2011.10.004.
- Sevier CS, Kaiser CA. 2002. Formation and transfer of disulphide bonds in living cells. Nat Rev Mol Cell Biol. 3:836–847. doi:10.1038/nrm954.
- Tadhani MB, Subhash R. 2007. In vitro antimicrobial activity of Stevia rebaudiana Bertoni leaves. Trop J Pharm Res. 5:557–560. doi:10.4314/tjpr.v5i1.14633.
- Fazal H, Ahmad N, Ullah I, Inayat H, Khan L, Abbasi BH. 2011. Antibacterial potential in Parthenium. In Vitro. 43:1307–1313.
- Tomita T, Sato N, Arai T, Shiraishi H, Sato M, Takeuchi M. 1997. Bactericidal activity of a fermented hot-water extract from Stevia rebaudiana Bertoni towards enterohemorrhagic Escherichia coli O157: h7and other food-borne pathogenic bacteria. Microbiol Immunol. 41:1005–1009. doi:10.1111/j.1348-0421.1997.tb01961.x.
- Paduch R, Kandefer-Szerszeń M, Trytek M, Terpenes: FJ. 2007. Substances useful in human healthcare. Arch Immunol Ther Exp (Warsz). 55:315–327. doi:10.1007/s00005-007-0039-1.
- Geuns J. Stevioside. Phytochemistry. 2003;64:913–921.
- Yasukawa K, Kitanaka S, Seo S. 2002. Inhibitory Effect of Stevioside on Tumor Promotion by 12-O-Tetradecanoylphorbol-13-acetate in Two-Stage Carcinogenesis in Mouse Skin. Biol Pharm Bull. 25:1488–1490. doi:10.1248/bpb.25.1488.
- Abou-Donia MB, El-Masry EM, Abdel-Rahman AA, McLendon RE, Schiffman SS. 2008. Splenda alters gut microflora and increases intestinal P-glycoprotein and cytochrome P-450 in male rats. J Toxicol Environ Heal - Part A Curr Issues. 71:1415–1429. doi:10.1080/15287390802328630.
- Suez J, Korem T, Zeevi D, Zilberman-Schapira G, Thaiss CA, Maza O, Israeli D, Zmora N, Gilad S, Weinberger A, et al. 2014. Artificial sweeteners induce glucose intolerance by altering the gut microbiota. Nature. 514:181–186. doi:10.1038/nature13793.
- Frankenfeld CL, Sikaroodi M, Lamb E, Shoemaker S, Gillevet PM. 2015. High-intensity sweetener consumption and gut microbiome content and predicted gene function in a cross-sectional study of adults in the United States. Ann Epidemiol. 25:736–742. doi:10.1016/j.annepidem.2015.06.083.
- Brudzynski K, Abubaker K, Miotto D. 2012. Unraveling a mechanism of honey antibacterial action : polyphenol/H2O2 -induced oxidative effect on bacterial cell growth and on DNA degradation. Food Chem. 133:329–336. doi:10.1016/j.foodchem.2012.01.035.
- Roquetto, A.R., Monteiro, N.E.S., Moura, C.S., Toreti, V.C., de Pace, F., dos Santos, A., Park, Y.K. and Amaya-Farfan, J. 2015. Green propolis modulates gut microbiota, reduces endotoxemia and expression of TLR4 pathway in mice fed a high-fat diet. Food Res Int. 76:796–803. doi:10.1016/j.foodres.2015.07.026.
- Xiao P, He L, Wang L. 1984. Ethnopharmacologic study of chinese rhubarb. J Ethnopharmacol. 10:275–293. doi:10.1016/0378-8741(84)90016-3.
- Allahverdiyev AM, Bagirova M, Yaman S, Koc RC, Abamor ES, Ates SC, Baydar, S.Y., Elcicek, S. and Oztel, O.N. 2013. Development of new antiherpetic drugs based on plant compounds. In: Rai MK, Kon KV, editors. Fighting multidrug resistance with herbal extracts, essential oils and their components. Elsevier; p. 245–259.
- Xiong HR, Shen YY, Lu L, Hou W, Luo F, Xiao H and Yang, Z.Q. 2012. The inhibitory effect of Rheum palmatum against coxsackievirus B3 in vitro and in vivo. Am J Chin Med. 40:801–812. doi:10.1142/S0192415X12500607.
- Utsunomiya H, Ichinose M, Uozaki M, Tsujimoto K, Yamasaki H, Koyama AH. 2008. Antiviral activities of coffee extracts in vitro. Food Chem Toxicol. 46:1919–1924. doi:10.1016/j.fct.2008.01.031.
- Wang G-F, Shi L-P, Ren Y-D, Liu Q-F, Liu H-F, Zhang R-J, Li Z, Zhu F-H, He P-L, Tang W, et al. 2009. Anti-hepatitis B virus activity of chlorogenic acid, quinic acid and caffeic acid in vivo and in vitro. Antiviral Res. 83:186–190. doi:10.1016/j.antiviral.2009.05.002.
- Namba T, Kurokawa M, Kadota S, Shiraki K. 1998. Development of antiviral therapeutic agents from traditional medicines. Yakugaku Zasshi. 118:383–400. doi:10.1248/yakushi1947.118.9_383.
- DH G, Kitajima M, JR T, Bright KR. 2014. Antiviral efficacy and mechanisms of action of oregano essential oil and its primary component carvacrol against murine norovirus. J Appl Microbiol. 116:1149–1163. doi:10.1111/jam.12453.
- Pilau MR, Alves SH, Weiblen R, Arenhart S, Cueto AP, Lovato LT. 2011. Antiviral activity of the Lippia graveolens (Mexican oregano) essential oil and its main compound carvacrol against human and animal viruses. Braz J Microbiol. 42:1616–1624. doi:10.1590/S1517-83822011000400049.
- Reddy BU, Mullick R, Kumar A, Sudha G, Srinivasan N, Das S. 2015. Small molecule inhibitors of HCV replication from Pomegranate. Sci Rep. 4:5411. doi:10.1038/srep05411.
- Su X, Sangster MY, D’Souza DH. 2011. Time-dependent effects of pomegranate juice and pomegranate polyphenols on foodborne viral reduction. Foodborne Pathog Dis. 8:1177–1183. doi:10.1089/fpd.2011.0873.
- Haidari M, Ali M, Ward Casscells S, Pomegranate MM. 2009. (Punica granatum) purified polyphenol extract inhibits influenza virus and has a synergistic effect with oseltamivir. Phytomedicine. 16:1127–1136. doi:10.1016/j.phymed.2009.06.002.
- Molly K, Vande WM, De SI, Verstraete W. 1994. Validation of the Simulator of the Human Intestinal Microbial Ecosystem (SHIME) reactor using microorganism-associated activities. Microb Ecol Health Dis. 7:191–200. doi:10.3109/08910609409141354.
- Zhou Y, Liang Y, Lynch KH, Dennis JJ, Wishart DS. 2011. PHAST: A Fast Phage Search Tool. Nucleic Acids Res. 39:347–352. doi:10.1093/nar/gkr485.
- Akhter S, Aziz RK, Edwards RA. 2012. PhiSpy: A novel algorithm for finding prophages in bacterial genomes that combines similarity-and composition-based strategies. Nucleic Acids Res. 40:1–13. doi:10.1093/nar/gks406.
- Kohler B, Karch H, Schmidt H. 2000. Antibacterials that are used as growth promoters in animal husbandry can affect the bacteriophages and Shiga toxins 2 from Escherichia coli strains. Microbiol. 146:1085–1090. doi:10.1099/00221287-146-5-1085.
- Cuevas DA, Edwards RA. 2017. PMAnalyzer: a new web interface for bacterial growth curve analysis. Bioinf. 33:1905–1906. doi:10.1093/bioinformatics/btx084.
- Sanchez SE, Cuevas DA, Rostron JE, Liang TY, Pivaroff CG, Haynes MR, Nulton, J., Felts, B., Bailey, B.A., Salamon, P, et al. 2015. Phage Phenomics: physiological Approaches to Characterize Novel Viral Proteins. J Vis Exp. 100:e52854.
- Jones E, Oliphant T, Peterson P SciPy: open Source Scientific Tools for Python. 2001.
- Zwietering MH, Jongenburger I, Rombouts FM, van ’t Riet K. 1990. Modeling of the bacterial growth curve. Appl Environ Microbiol. 56:1875–1881.
- Wickham H. 2016 ggplot2.
- Firsov AA, Vostrov SN, Shevchenko AA, Cornaglia G. 1997. Parameters of bacterial killing and regrowth kinetics and antimicrobial effect examined in terms of area under the concentration-time curve relationships: action of ciprofloxacin against Escherichia coli in an in vitro dynamic model. Antimicrob Agents Chemother. 41:1281–1287. doi:10.1128/AAC.41.6.1281.
- R Core Team. R: a language and environment for statistical computing | GBIF.ORG. R: A language and environment for statistical computing.
- Warnes G, Bolker B, Bonebakker L. 2009. gplots: various R programming tools for plotting data. R Packag Version.
- Molan PC. 2006. The antibacterial activity of honey: 1. The Nature of the Antibacterial Activity. 73:5–28.
- Imlay JA, Linn S. 1987. Mutagenesis and stress responses induced in Escherichia coli by hydrogen peroxide. J Bacteriol. 169:2967–2976. doi:10.1128/jb.169.7.2967-2976.1987.
- Selva L, Viana D, Regev-Yochay G, Trzcinski K, JM C, Lasa Í, Novick RP, Penades JR. 2009. Killing niche competitors by remote-control bacteriophage induction. Proc Natl Acad Sci. 106:1234–1238. doi:10.1073/pnas.0809600106.
- Sekulović O, Fortier LC. Characterization of functional prophages in Clostridium difficile. In: Roberts A, Mullany P, editors. Methods in Molecular Biology. New York (NY): Humana Press; 2016. p. 143–165.
- Brussaard CPD, Payet JP, Winter C, Weinbauer MG. Quantification of aquatic viruses by flow cytometry. Man Aquat Viral Ecol. 2010;102–109.
- Torres PJ, Edwards RA, McNair KAPARTIE. 2017. A partition engine to separate metagenomic and amplicon projects in the Sequence Read Archive. Bioinf. 33:2389–2391. doi:10.1093/bioinformatics/btx184.
- Edwards R linsalrob/SearchSRA: Alpha Release. 2017.