
ABSTRACT
Interaction between humans and the gut microbiota is important for human physiology. Here, the gut microbiota was analyzed via metagenomic sequencing, and the fluctuations in the gut microbiota under the conditions of spaceflight were characterized. The composition and function of the gut microbiota were substantially affected by spaceflight; however, individual specificity was uncompromised. We further confirmed the species fluctuations and functional genes from both missions. Resistance and virulence genes in the gut microbiota were affected by spaceflight, but the species attributions remained stable. Spaceflight markedly affected the composition and function of the human gut microbiota, implying that the human gut microbiota is sensitive to spaceflight.
Introduction
The human gut microbiota is a large and diverse microbial community in the human gastrointestinal tract. The interaction between humans and their gut microbiota is important in human physiology. Recent studies have found that the distribution and diversity of the gut microbiota are closely related to immune, cardiovascular and osteoporotic diseases.Citation1-Citation5 The interaction between humans and the gut microbiota plays important roles in human health by producing short-chain fatty acids (SCFAs), vitamins, and amino acids; training the immune system; protecting against pathogens; and contributing to the maturation of the intestinal epithelium among other roles.Citation6-Citation10
The composition and activity of the gut microbiota are unstable and are influenced by endogenous and environmental factors.Citation11 Some studies have illustrated that specific human experiences and environments can quickly and profoundly perturb the gut microbiota composition.Citation12-Citation16 To confirm the influence of the environment on the human gut microbiota, Turroni et al. explored the changes of human gut microbiota in the MARS500 project, which was a 520-day ground-based space simulation mission. The study found that the specific environment greatly influenced the human gut microbiota; however, sharing life in the confined habitat did not compromise the individual specificity of the gut microbiota composition.Citation17
pace is a dangerous environment and a risk to human health. Astronauts’ physiologies change profoundly when exposed to the environment in space.Citation18,Citation19 Recent studies found that the immune system was influenced by spaceflight: blood lymphoid cell reactivity and cytokine production decreased significantly when astronauts were exposed to the space environment.Citation20,Citation21 Previous spaceflight studies showed that astronauts were easily infected by bacteria, viruses, and opportunistic pathogens because of immune dysregulation.Citation22,Citation23 In addition, spaceflight reactivated the varicella-zoster virus (VZV) in astronauts; this virus is always reactivated in immunosuppressed individuals.Citation24,Citation25 In addition to a dysregulated immune system, other factors, including increased biofilm formation, virulence and antibiotic resistance among some bacteria, can increase the risk of infection during spaceflight. Our previous study found that after short-term exposure to a simulated microgravity environment, the biofilm formation ability of Klebsiella pneumoniae increased significantly.Citation26 Wilson et al. found that bacterial gene expression and virulence in Salmonella typhimurium was significantly affected by spaceflight, and the global regulator, Hfq, was expressed in response to the space environment.Citation27 These studies revealed that spaceflight affects the human immune system, bacterial biofilm formation, and virulence. Because the human gut microbiota is an enormous microbial community in the human gastrointestinal tract and interacts with the host immune system, we believe that the unique environment of spaceflight exerts important effects on the human gut microbiota and immune system and the intricate interaction between them. The NASA twins study and the research by Voorhies et al have reported the impact of long-term spaceflight on the human microbiome .Citation28,Citation29 Such studies would shed light on the bacterial abundance in each taxonomic hierarchy after being influenced by spaceflight.
Missions one and two were spaceflight projects that were successfully completed from China. Fecal samples from the astronauts were collected in sterile vials and stored in a -80°C freezer. The fecal samples from mission one were first analyzed by metagenomic sequencing; however, no fecal samples from one week prior to spaceflight were available for comparison. We then collected and characterized the fecal samples from mission two, and the results were used to determine how the gut microbiota was influenced by spaceflight. The results also provide the insights to maintain the astronauts’ gut microbiota during spaceflight, which is critical for the countermeasure of side effects and accomplishment of the spaceflight mission.
Materials and methods
Sampling
Spaceflight missions one and two included five people (S1.01, S1.02, S1.03, S2.01 and S2.02), and the duration of two flights were 15 and 35 days, independently. Of note, no detailed information on dietary, similarities were obtained among the subjects across the spaceflight missions. Each astronaut takes 2900 kcal calories a day and four days for a diet cycle. Eating habits is similar with the ground life. Fecal samples were collected from each person at four or five timepoints, including one week before launch (L-7), recovered one day after spaceflight (R + 1), recovered one week after spaceflight (R + 7), recovered two weeks after spaceflight (R + 14), and recovered four weeks after spaceflight (R + 28). However, the fecal samples from one week before spaceflight from mission one were unavailable for the study. All fecal samples were collected in sterile vials and immediately transferred to a-80°C freezer.
Sample preparation and Illumina HiSeq sequencing
Stool samples (180–220 mg) were weighed in 2-ml microcentrifuge tubes and placed on ice. Total DNA from the fecal microbiotas was extracted using the QIAamp Fast DNA Stool Mini Kit (QIAGEN, Germany) per the manufacturer’s instructions (see the QIAamp Fast DNA Stool Mini Kit Handbook, www.qiagen.com/handbooks). The degradation degree and potential contamination of the DNA were analyzed using 1% agarose gels. The DNA purity was determined using the NanoPhotometer® spectrophotometer (IMPLEN, CA, USA), and the DNA concentration was measured using the Qubit® dsDNA Assay Kit in Qubit® 2.0 Fluorometer (Life Technologies, CA, USA). One microgram of qualified DNA was used to construct the library. DNA samples were fragmented to 350 bp by sonication, then the DNA fragments were end-polished, A-tailed, and ligated with the full-length adaptor for Illumina sequencing with further PCR amplification. Libraries were analyzed for size distribution using the Agilent2100 Bioanalyzer (Agilent, USA) and quantified via real-time PCR. The libraries were sequenced on an Illumina HiSeq platform.
Data analyses
Raw data obtained from the Illumina HiSeq sequencing platform were preprocessed by Readfq (V8,https://github.com/cjfields/readfq), the estimated coverage of all samples were shown in Supplementary table 1, and the acquired clean data were used for subsequent analysis. The clean data were analyzed using SOAPdenovo software (V2.04, http://soap.genomics.org.cn/soapdenovo.html), and the Scaftigs were obtained.Citation30-Citation32 All the sample details of the quality of their assemblies is present in Supplementary table 2. The Scaftigs (≥ 500 bp) were used to predict the open reading frame (ORF) using MetaGeneMark (V2.10; http://topaz.gatech.edu/GeneMark/) and CD-HIT software (V4.5.8; http://www.bioinformatics). The website, org/cd-hit, was used to obtain the initial gene catalog from the predicted ORF.Citation33-Citation37 Clean data from each sample were mapped to the initial gene catalog using SoapAligner software (soap2.21; http://soap.genomics.org.cn/soapaligner.html). The obtained gene catalog (Unigenes) was eventually used for subsequent analyses.Citation38,Citation39 The obtained Unigenes were used to blast the sequences for the bacteria, fungi, archaea and viruses, which were extracted from the NR database (V20161115; https://www.ncbi.nlm.nih.gov/) of NCBI using DIAMOND software (V0.7.9; https://github.com/bbuchfink/diamond/).Citation40 We used the lowest common ancestor (LCA) algorithm to obtain the number of genes and abundance information for each sample in each taxonomic hierarchy (kingdom, phylum, class, order, family, genus, and species).Citation33,Citation41 DIAMOND software (V0.7.9) was used to blast Unigenes to functional databases, including the KEGG (V201609, http://www.kegg.jp/kegg/), eggNOG (V4.5; http://eggnogdb.embl.de/#/app/home) and CAZy databases (V20150704; http://www.cazy.org/), for the blast results, and the best blast hit was used for subsequent analysis.Citation38,Citation42-Citation45 The Unigenes were blasted to the CARD and VFDB databases using DIAMOND software to analyze the resistance and virulence genes (V0.7.9).Citation46-Citation48
Results
Spaceflight affected the composition of the human gut microbiota
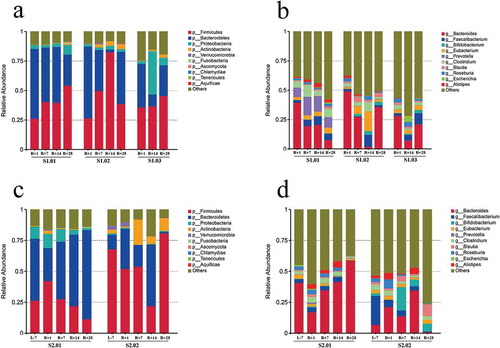
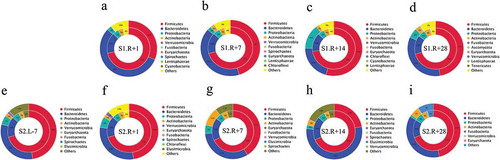
The gut microbiotas of the five subjects from missions one (S1.01, S1.02 and S1.03) and two (S2.01 and S2.02) were tracked over four or five timepoints. Four fecal samples per person from mission one and five fecal samples per person from mission two were collected and characterized by metagenomic sequencing. We first characterized the gut microbiota compositions for mission one at the phylum and genus levels (,). The gut microbiotas at both the phylum and genus levels fluctuated obviously between R + 1 and R + 28. However, because fecal samples for L-7 of mission one were unavailable, we could not compare the gut microbiotas before spaceflight with those after spaceflight. We then characterized the composition of the gut microbiota for mission two at the phylum and genus levels (,). The gut microbiota at both the phylum and genus levels were significantly influenced by spaceflight. Clustering trees based on relative abundances at the phylum and genus levels in missions one and two were used to study the species similarities between samples (Supplementary Figure 1). According to the distance on the tree, we can see that samples from the same person were closer than the samples from different people. We found fluctuations in the top ten microbial abundances of the gut microbiotas at both the phylum and genus levels (Supplementary figures 2 and 3), exhibited a similar fluctuation trend in missions one. Among them, the Firmicutes abundance was gradually increased, while the Bacteroides abundance was gradually decreased after spaceflight. We also found a fluctuation in the top ten microbial abundances of the gut microbiota at both the phylum and genus levels in missions two (Supplementary figures 4 and 5), but the compositions between the two subjects as well as the fluctuations were different. For example, the Firmicutes abundance was increased in S2.01, but decreased in S2.02, and the Bacteroides abundance was decreased in S2.01, but increased in S2.02 between R + 1 and L-7. Thus, the space environment markedly affected the gut microbiota composition. Because the subjects shared a confined habitat and similar diets across the spaceflight mission, we confirmed that the space environment influenced the individual specificity of the gut microbiota. In addition, spaceflight also greatly affected the gut microbiota abundances at the other levels (kingdom, class, order, family and species; Supplementary Figure 6). We found abundance fluctuations in the top four gut microorganisms at the kingdom level (Supplementary figure 7), and the viral abundance in the gut microbiota was increased notably after spaceflight except in subject S2.02. The clustering trees based on relative abundances at the kingdom, class, order, family and species levels in missions one and two were the same as those at the phylum and genus levels (Supplementary figure 8).
Figure 1. Relative abundances in the gut microbiota at the phylum and genus levels. (a) Top ten phylum abundances in the gut microbiota from mission one. (b) Top ten genus abundances in the gut microbiota from mission one. (c) Top ten phylum abundances in the gut microbiota from mission two. (d) Top ten genus abundances in the gut microbiota from mission two.
Spaceflight influenced species diversity and differences in the gut microbiota
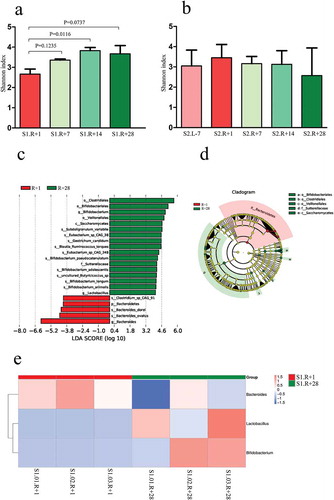
The Shannon index based on the genus profile was used to estimate the alpha diversity of each sample. The α-diversity at the genus level was lower in R + 1 compared with that in R + 7, R + 14 and R + 28 in mission one (P = .1235, R + 1 vs R + 7; P = .0116, R + 1 vs R + 14; P = .0737, R + 1 vs R + 28; ). The reduced richness in genera in the gut microbiota after spaceflight suggests a possible deficiency of healthy microflora. The α-diversity at the genus level did not fluctuate significantly after spaceflight in mission two (). The fluctuations in α-diversity after spaceflight between each subject were similar in mission one but dissimilar between the two subjects in mission two (Supplementary figure 9). To explore the differences among species that were affected by spaceflight in the gut microbiota, LEfSe analysis was used to obtain the species biomarkers. We compared the gut microbiota compositions of R + 1 with R + 28 for mission one and displayed the LDA score of the species. , show the distribution diagram of species differences at all levels and the cladogram based on different species. Four weeks after spaceflight, the abundances of 17 species were increased, while the abundances of 5 species were decreased at all levels. Using the different species abundances, we constructed a cluster heat map at the genus level (). The abundances of Lactobacillus and Bifidobacterium increased, while the Bacteroides abundance decreased in R + 28 compared with those of R + 1 in mission one. LEfSe analysis requires at least three samples per group, and mission two had only two subjects; therefore, we characterized the fluctuations in species at the genus level in missions one and two (Supplementary figure 10). As in mission one, the abundances of Lactobacillus and Bifidobacterium increased, and the abundance of Bacteroides decreased in R + 28 compared with those in R + 1 for subject S2.02; however, these fluctuations were inconsistent for subject S2.01.
Figure 2. Comparison of α-diversity based on the Shannon index at the genus level and the species in the gut microbiota. (a) Comparison of α-diversity across four timepoints in mission one. (b) Comparison of α-diversity across five timepoints in mission two. (c) Distribution diagram of the LDA score in mission one and results of the LEfSe analysis based on the LDA score to screen the species biomarkers. LDA scores of the above 4 species between R + 1 and R + 28 differed significantly. (d) Cladogram based on different species from mission one. Red and green nodes represent the microorganisms that played important roles in each group. (e) Cluster heat map based on different species at the genus level in mission one.
Spaceflight significantly affected the gut microbiota function
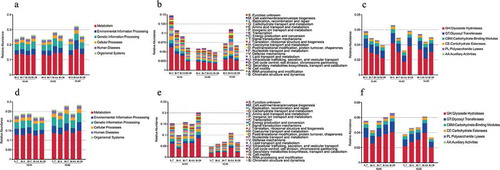
To investigate the influence of spaceflight on the gut microbiota function, we blasted Unigenes to the KEGG, eggNOG, and CAZy databases, and the relative abundances of KEGG, eggNOG, and CAZy at level 1 in mission one and two are shown (). Spaceflight markedly affected the gut microbiota function, especially the relative abundance of environmental information processing in KEGG level 1, the relative abundance of envelope biogenesis in eggNOG level 1, and the relative abundance of glycoside hydrolases in CAZy level 1. To analyze the influence of spaceflight on the metabolic pathway, we listed the unique enzyme reactions from the KEGG pathway overview in missions one and two (Supplementary table 3). The only unique enzyme reactions affected by spaceflight were the enzyme reactions for biosynthesis of antibiotics. In addition, clustering trees based on KEGG, eggNOG and CAZy level 1 in missions one and two was used to investigate the functional similarities between samples (Supplementary figure 11), and the clustering results were the same as those of the clustering trees based on taxonomic hierarchy.
Figure 3. Relative abundances of KEGG, eggNOG and CAZy level 1 in missions one and two. (a) Relative abundance of KEGG level 1 in mission one. (b) Relative abundance of eggNOG level 1 in mission one. (c) Relative abundance of CAZy level 1 in mission one. (d) Relative abundance of KEGG level 1 in mission two. (e) Relative abundance of eggNOG level 1 in mission two. (f) Relative abundance of CAZy level 1 in mission two.
Antibiotic resistance genes and mobile genetic elements in the gut microbiota affected by spaceflight as well as the species attributions were stable
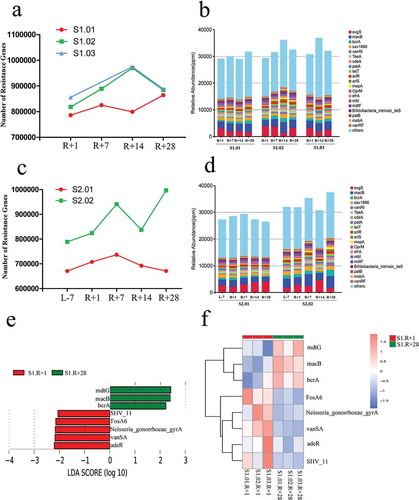
Recent studies on microbiology in space have revealed that spaceflight has an important influence on bacterial resistance genes. The results of this study showed that the only unique enzyme reactions affected by spaceflight were those involved in biosynthesizing antibiotics. Thus, we analyzed the resistance genes in the gut microbiotas from missions one and two. The total resistance genes in the gut microbiota were no significant differences between R + 1 and R + 28D in mission one (). We also showed the top twenty abundances of antibiotic resistance ontologies (AROs) in the gut microbiota (). Some AROs had altered markedly after spaceflight; for example, the abundance of evgS, which is related to macrolide, fluoroquinolone, penam, and tetracycline resistance, was increased in R + 1 compared with that in R + 28 in mission one (Supplementary figure 12a and 12b). The total number of resistance genes in the gut microbiota was increased in R + 1 compared with that in L-7 in mission two () and was also increased compared with that of R + 28 except in subject S2.02. The top twenty ARO abundances in the gut microbiota are shown (). Some of these AROs were also influenced markedly by spaceflight, but the fluctuation trend was inconsistent between the two subjects. For example, the abundance of evgS in the gut microbiota of subject S2.02 was increased in R + 1 compared with L-7 and R + 28, while in subject S2.01 was decreased (Supplementary figure 12c). LEfSe analysis was used to obtain the difference AROs, and we compared the ARO abundance of R + 1 with that of R + 28 from mission one. The LDA score of the AROs above 2 and the distribution diagram of the AROs and the cluster heat map are shown (,). The abundances of 5 AROs were increased, and those of 3 AROs were decreased in R + 1 compared with that in R + 28.
Figure 4. Resistance genes and antibiotic resistance ontologies (AROs) affected by spaceflight in missions one and two; the ARO is the core composition of the CARD database. (a) Total number of resistance genes affected by spaceflight in mission one. (b) Relative abundance of the top 20 AROs affected by spaceflight in mission one. (c) Total number of resistance genes affected by spaceflight in mission two. (d) Relative abundance of the top 20 AROs affected by spaceflight in mission two. (e) Distribution diagram of the AROs; the LDA score of the top 2 AROs is shown. (f) Cluster heat map based on different AROs.
As the potential for transfer of antibiotic resistance genes in human microbiota,Citation49,Citation50 mobile genetic elements’ role in shaping the resistance genes in the astronauts gut is unclear. We have analyzed mobile genetic elements in astronauts’ gut microbiota. We found that the relative abundances of plasmids and integrons were significantly increased in R + 28 compared with that in R + 1 and the relative abundances of transposons had no differences in R + 28 compared with that in R + 1 in mission one (Supplementary figure 13a, 13b and 13c). We also listed the relative abundances of the top 20 plasmids, integrons and transposons in R + 1 and R + 28 in mission one (Supplementary figure 13d, 13e and 13f).Thus, the species abundance and resistance genes in the gut microbiotas were both influenced by spaceflight; therefore, we analyzed the relationship between species attributions at the phylum level with the resistance gene distribution (). We found that no matter how the species attribution fluctuated, the ARO distribution for each species remained stable in both missions one and two.
Figure 5. Relationship between species attributions at the phylum level and the resistance gene distribution in the gut microbiota. The inner circle is the ARO distribution in each species, and the outer circle is the distribution of the gut microbiota in a group. The relationship between ARO distribution and species attribution in mission one includes four groups: (a) one day after spaceflight (S1.R + 1), (b) one week after spaceflight (S1.R + 7), (c) two weeks after spaceflight (S1.R + 14) and (d) four weeks after spaceflight (S1.R + 28). The relationship between ARO distribution and species attribution in mission two included five groups: (e) one week before spaceflight (S2.L-7), (f) one day after spaceflight (S2.R + 1), g one week after spaceflight (S2.R + 7), (h) two weeks after spaceflight (S2.R + 14) and (i) four weeks after spaceflight (S2.R + 28).
Virulence genes in the gut microbiota were altered after spaceflight
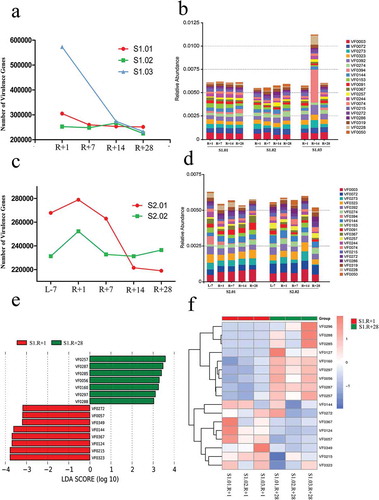
Spaceflight influences bacterial virulence; thus, we analyzed the virulence genes of the gut microbiotas from missions one and two. The total number of virulence genes in the gut microbiota was increased in R + 1 compared with that in R + 28 from mission one (). shows the top twenty virulence factor (VF) abundances in the gut microbiota. Some VFs altered markedly after spaceflight; for example, the abundance of VF0367, which is related to LPS formation and leads to the formation of a protective barrier in Brucella, was increased in R + 1 compared with that in R + 28 (Supplementary figure 14a and 14b). The total number of virulence genes in the gut microbiota was increased in R + 1 compared with those in L-7 and R + 28 in mission two (). shows the top twenty VF abundances in the gut microbiota; the abundance of VF0367 for subject S2.02 was slightly increased in R + 1 compared with L-7 and R + 28, while that for subject S2.01 was decreased (Supplementary figure14c). LEfSe analysis was used to obtain the difference VFs, and we compared the VF abundance of R + 1 with that of R + 28 from mission one. , show the LDA score of the VFs above 3, the distribution diagram of the VFs, and the cluster heat map. The abundances of 8 VFs were increased, while those of 7 VFs were decreased in R + 1 compared with those in R + 28.
Figure 6. Virulence genes and virulence factors (VFs) affected by spaceflight in missions one and two; the VFs are the core composition of the VFDB database. (a) Total number of virulence genes affected by spaceflight in mission one. (b) Relative abundances of the top 20 VFs affected by spaceflight in mission one. (c) Total number of virulence genes affected by spaceflight in mission two. (d) Relative abundances of the top 20 VFs affected by spaceflight in mission two. (e) Distribution diagram of the VFs; the LDA score of the top 3 AROs are displayed. (f) Cluster heat map based on different VFs.
Discussion
During spaceflight, humans must endure a unique environment that can negatively affect their health and the entire mission.Citation18,Citation19 Spaceflight missions one and two contained five people and provided an invaluable opportunity to investigate the influence of spaceflight on the human gut microbiota. In our study, we explored the composition and function of the gut microbiota, including the period before and after spaceflight, for a total of four or five timepoints per person. This study was the first to elucidate the impact of short-term spaceflight on the human gut microbiota, as previous studies only simulated the space environment,Citation17,Citation51 Turroni’s study found that the Bacteroides abundance increased after simulated spaceflight, which is consistent with our results. Our study demonstrated that the composition and function of the human gut microbiota were markedly affected by spaceflight, but after four weeks of recovery, the influence of spaceflight on the human gut microbiota almost disappeared. We found that the characteristics of samples after four weeks recovery is similar to the pre-flight samples in spaceflight mission two. Turroni’s study also found that after simulated spaceflight the composition and function of gut microbiota fluctuated markedly, and the recovered samples look more like the before simulated spaceflight samples. Recently, there are two studies focused on the impact of long-term spaceflight on the human gut microbiota including NASA Twins Study and Voorhies’ study.Citation26,Citation27 In NASA Twins Study, there were no significant fluctuations between subjects in the Shannon index and there were significant differences of viral community structures and functional gene content between subjects. In Voorhies’ study, the Shannon index of the gut microbiota significantly increase during spaceflight missions, However, our results demonstrated that the Shannon index of the gut microbiota significantly decreased after spaceflight in mission one. In mission one, the composition and function of the gut microbiota fluctuated consistently across the three subjects after spaceflight, while there existed some difference in the fluctuations of the two subjects in mission two. We speculate that the reasons for this difference mainly resulted from individual differences. Interestingly, our results showed that the viral abundance in the gut microbiota was increased notably after the spaceflight, this result was consistent with previous reports that the abundance of latent viruses in blood significantly increased after spaceflight.Citation22,Citation23 By analyzing the species biomarkers affected by spaceflight, we observed that after spaceflight, the Bacteroides abundance increased, while the Lactobacillus and Bifidobacterium abundances decreased in missions one and two, except in subject S2.01. Bacteroides in the human gut are efficient degraders of dietary fiber and can efficiently produce propionate and phenolic acids; this genus is an opportunistic pathogen that often breeds rapidly under several stress conditions.Citation52-Citation55 The conditions in space induced immune system injury, and as an opportunistic pathogen, the Bacteroides abundance increased prospectively, which is consistent with simulated space environment tests.Citation17 Lactobacilli are the major producers of lactic acid in the human gut. Bifidobacterium can produce acetic acid and lactic acid from sugars at a 3:2 ratio.Citation56 Several taxa of Lactobacillus and Bifidobacterium are known probiotics that can regulate host immune systems, enhance gut metabolic capacities and maintain balance in the gut microbiota.Citation57,Citation58 Decreased Lactobacillus and Bifidobacterium abundances in the gut can affect host immune system function and the balance of the gut microbiota, and the immune systems impaired by spaceflight could influence reactivation of latent viruses and breeding of opportunistic pathogens in the gut. Whether the gut microbiota or the immune system is the major factor influenced by spaceflight remains unclear, and further studies are warranted. Our study found that genes related to environmental information processing and envelope biogenesis were increased after spaceflight. To respond to environmental changes, the functional genes involved in environmental information processing in the gut microbiota fluctuation. In addition, consistent with previous studies on biofilm formation under space conditions, the genes involved in envelope biogenesis in the gut microbiota, which are related to biofilm formation, were increased after spaceflight. The clustering trees based on species abundance and functional genes all showed that spaceflight markedly affected the gut microbiota; however, the individual steady states of the gut microbiota could still be identified, and the influence of spaceflight on the gut microbiota did not compromise individual specificity. The resistance genes of the gut microbiota were affected by spaceflight, but the species attribution remained stable, which is similar to the individual steady states of the gut microbiota. These fluctuations in antibiotic resistance genes and mobile genetic elements in the gut microbiota after spaceflight may provide insight for antibiotic use in space. In addition, the fluctuations in virulence genes after spaceflight may provide insight for prevention; for example, the increased VF0367 could suggest that Brucella has increased virulence and infection opportunities in spaceflight missions. Because of the limited number of subjects and the unique environment, we could not distinguish the influences of microgravity, isolation, stress, and other factors on the human gut microbiota during spaceflight. Another important question is whether the gut microbiota or the immune system is the major factor influenced by spaceflight and whether the two affect each other.
Conclusions
Fecal samples obtained from two spaceflight missions enabled evaluating the influence of spaceflight on the human gut microbiota. This was the first study to elucidate the impact of short-term spaceflight on the human gut microbiota. Our results revealed that spaceflight markedly affected the composition and function of the human gut microbiota; however, the steady states of individual specificity and the species attribution of resistance genes can always be identified. Our results suggest that the human gut microbiota should be considered during future spaceflight missions. More studies are warranted to analyze the mutualistic relationship between humans and the gut microbiota under unique environmental conditions.
Disclosure of potential conflicts of interest
The authors declare that they have no competing interests.
Availability of data and materials
The sequencing data of this study have been deposited in the CNSA (https://db.cngb.org/cnsa/) of CNGBdb with accession number CNP0000570.
Supplemental Material
Download Zip (17 MB)Acknowledgments
We would like to express our deepest thanks to the five crewmembers in spaceflight mission one and two. We thank Voorhies et al for providing the reference for analysis of the effect of spaceflight on the human microbiome. We thank Traci Raley, MS, ELS, from Liwen Bianji, Edanz Editing China (www.liwenbianji.cn/ac), for editing the draft of this manuscript.
Supplementary material
Supplemental data for this article can be accessed on the publisher’s website.
Correction Statement
This article has been republished with minor changes. These changes do not impact the academic content of the article.
Additional information
Funding
References
- Deng Z, Mu J, Tseng M, Wattenberg B, Zhuang X, Egilmez NK, Wang Q, Zhang L, Norris J, Guo H, et al. Enterobacteria-secreted particles induce production of exosome-like S1P-containing particles by intestinal epithelium to drive Th17-mediated tumorigenesis. Nat Commun. 2015;6:6956. doi:10.1038/ncomms7956.
- Gensollen T, Iyer SS, Kasper DL, Blumberg RS. How colonization by microbiota in early life shapes the immune system. Science. 2016;352(6285):539–544. doi:10.1126/science.aad9378.
- Arumugam M, Raes J, Pelletier E, Le Paslier D, Yamada T, Mende DR, Fernandes GR, Tap J, Bruls T, Batto JM, et al. Enterotypes of the human gut microbiome. Nature. 2011;473(7346):174–180. doi:10.1038/nature09944.
- Spanogiannopoulos P, Bess EN, Carmody RN, Turnbaugh PJ. The microbial pharmacists within us: a metagenomic view of xenobiotic metabolism. Nat Rev Microbiol. 2016;14(5):273–287. doi:10.1038/nrmicro.2016.17.
- Schroeder BO, Backhed F. Signals from the gut microbiota to distant organs in physiology and disease. Nat Med. 2016;22(10):1079–1089. doi:10.1038/nm.4185.
- Walter J, Ley R. The human gut microbiome: ecology and recent evolutionary changes. Annu Rev Microbiol. 2011;65:411–429. doi:10.1146/annurev-micro-090110-102830.
- Koh A, De Vadder F, Kovatcheva-Datchary P, Backhed F. From dietary fiber to host physiology: short-chain fatty acids as key bacterial metabolites. Cell. 2016;165(6):1332–1345. doi:10.1016/j.cell.2016.05.041.
- Degnan PH, Taga ME, Goodman AL. Vitamin B12 as a modulator of gut microbial ecology. Cell Metab. 2014;20(5):769–778. doi:10.1016/j.cmet.2014.10.002.
- Macpherson AJ, de Aguero MG, Ganal-Vonarburg SC. How nutrition and the maternal microbiota shape the neonatal immune system. Nat Rev Immunol. 2017;17(8):508–517. doi:10.1038/nri.2017.58.
- Planer JD, Peng Y, Kau AL, Blanton LV, Ndao IM, Tarr PI, Warner BB, Gordon JI. Development of the gut microbiota and mucosal IgA responses in twins and gnotobiotic mice. Nature. 2016;534(7606):263–266. doi:10.1038/nature17940.
- Candela M, Biagi E, Turroni S, Maccaferri S, Figini P, Brigidi P. Dynamic efficiency of the human intestinal microbiota. Crit Rev Microbiol. 2015;41(2):165–171. doi:10.3109/1040841X.2013.813900.
- Flores GE, Caporaso JG, Henley JB, Rideout JR, Domogala D, Chase J, Leff JW, Vazquez-Baeza Y, Gonzalez A, Knight R, et al. Temporal variability is a personalized feature of the human microbiome. Genome Biol. 2014;15(12):531. doi:10.1186/s13059-014-0531-y.
- Lax S, Smith DP, Hampton-Marcell J, Owens SM, Handley KM, Scott NM, Gibbons SM, Larsen P, Shogan BD, Weiss S, et al. Longitudinal analysis of microbial interaction between humans and the indoor environment. Science. 2014;345(6200):1048–1052. doi:10.1126/science.1254529.
- Song SJ, Lauber C, Costello EK, Lozupone CA, Humphrey G, Berg-Lyons D, Caporaso JG, Knights D, Clemente JC, Nakielny S, et al. Cohabiting family members share microbiota with one another and with their dogs. eLife. 2013;2:e00458. doi:10.7554/eLife.00458.
- Hao Z, Wang W, Guo R, Liu H. Faecalibacterium prausnitzii (ATCC 27766) has preventive and therapeutic effects on chronic unpredictable mild stress-induced depression-like and anxiety-like behavior in rats. Psychoneuroendocrinology. 2019;104:132–142. doi:10.1016/j.psyneuen.2019.02.025.
- Li L, Su Q, Xie B, Duan L, Zhao W, Hu D, Wu R, Liu H. Gut microbes in correlation with mood: case study in a closed experimental human life support system. Neurogastroenterol Motil. 2016;28(8):1233–1240. doi:10.1111/nmo.2016.28.issue-8.
- Turroni S, Rampelli S, Biagi E, Consolandi C, Severgnini M, Peano C, Quercia S, Soverini M, Carbonero FG, Bianconi G, et al. Temporal dynamics of the gut microbiota in people sharing a confined environment, a 520-day ground-based space simulation, MARS500. Microbiome. 2017;5(1):39. doi:10.1186/s40168-017-0256-8.
- Chapes SK. Lessons from Immune 1-3: what did we learn and what do we need to do in the future? J Gravitational Physiol. 2004;11:P45–48.
- Zhang LF, Hargens AR. Spaceflight-induced intracranial hypertension and visual impairment: pathophysiology and countermeasures. Physiol Rev. 2018;98(1):59–87. doi:10.1152/physrev.00017.2016.
- Cogoli A, Cogoli-Greuter M. Activation and proliferation of lymphocytes and other mammalian cells in microgravity. Adv Space Biol Med. 1997;6:33–79.
- Sonnenfeld G. Extreme environments and the immune system: effects of spaceflight on immune responses. J Allergy Clin Immunol. 2001;107(1):19–20. doi:10.1067/mai.2001.112034.
- Klaus DM, Howard HN. Antibiotic efficacy and microbial virulence during space flight. Trends Biotechnol. 2006;24(3):131–136. doi:10.1016/j.tibtech.2006.01.008.
- Mermel LA. Infection prevention and control during prolonged human space travel. Clin Infect Dis. 2013;56(1):123–130. doi:10.1093/cid/cis861.
- Cohrs RJ, Mehta SK, Schmid DS, Gilden DH, Pierson DL. Asymptomatic reactivation and shed of infectious varicella zoster virus in astronauts. J Med Virol. 2008;80(6):1116–1122. doi:10.1002/(ISSN)1096-9071.
- Mehta SK, Cohrs RJ, Forghani B, Zerbe G, Gilden DH, Pierson DL. Stress-induced subclinical reactivation of varicella zoster virus in astronauts. J Med Virol. 2004;72(1):174–179. doi:10.1002/(ISSN)1096-9071.
- Wang H, Yan Y, Rong D, Wang J, Wang H, Liu Z, Wang J, Yang R, Han Y. Increased biofilm formation ability in Klebsiella pneumoniae after short-term exposure to a simulated microgravity environment. MicrobiologyOpen. 2016;5(5):793–801. doi:10.1002/mbo3.2016.5.issue-5.
- Wilson JW, Ott CM, Honer Zu Bentrup K, Ramamurthy R, Quick L, Porwollik S, Cheng P, McClelland M, Tsaprailis G, Radabaugh T, et al. Space flight alters bacterial gene expression and virulence and reveals a role for global regulator Hfq. Proc Natl Acad Sci USA. 2007;104(41):16299–16304. doi:10.1073/pnas.0707155104.
- Garrett-Bakelman FE, Darshi M, Green SJ, Gur RC, Lin L, Macias BR, McKenna MJ, Meydan C, Mishra T, Nasrini J, et al. The NASA Twins study: a multidimensional analysis of a year-long human spaceflight. Science. 2019;364(6436). doi:10.1126/science.aav6390.
- Voorhies AA, Mark Ott C, Mehta S, Pierson DL, Crucian BE, Feiveson A, Oubre CM, Torralba M, Moncera K, Zhang Y, et al. Study of the impact of long-duration space missions at the international space station on the astronaut microbiome. Sci Rep. 2019;9(1):9911. doi:10.1038/s41598-019-46303-8.
- Luo R, Liu B, Xie Y, Li Z, Huang W, Yuan J, He G, Chen Y, Pan Q, Liu Y, et al. SOAPdenovo2: an empirically improved memory-efficient short-read de novo assembler. GigaScience. 2012;1(1):18. doi:10.1186/2047-217X-1-18.
- Qin N, Yang F, Li A, Prifti E, Chen Y, Shao L, Guo J, Le Chatelier E, Yao J, Wu L, et al. Alterations of the human gut microbiome in liver cirrhosis. Nature. 2014;513(7516):59–64. doi:10.1038/nature13568.
- Nielsen HB, Almeida M, Juncker AS, Rasmussen S, Li J, Sunagawa S, Plichta DR, Gautier L, Pedersen AG, Le Chatelier E, et al. Identification and assembly of genomes and genetic elements in complex metagenomic samples without using reference genomes. Nat Biotechnol. 2014;32(8):822–828. doi:10.1038/nbt.2939.
- Karlsson FH, Tremaroli V, Nookaew I, Bergstrom G, Behre CJ, Fagerberg B, Nielsen J, Backhed F. Gut metagenome in European women with normal, impaired and diabetic glucose control. Nature. 2013;498(7452):99–103. doi:10.1038/nature12198.
- Karlsson FH, Fak F, Nookaew I, Tremaroli V, Fagerberg B, Petranovic D, Backhed F, Nielsen J. Symptomatic atherosclerosis is associated with an altered gut metagenome. Nat Commun. 2012;3:1245. doi:10.1038/ncomms2266.
- Oh J, Byrd AL, Deming C, Conlan S, Program NCS, Kong HH, Segre JA. Biogeography and individuality shape function in the human skin metagenome. Nature. 2014;514(7520):59–64. doi:10.1038/nature13786.
- Sunagawa S, Coelho LP, Chaffron S, Kultima JR, Labadie K, Salazar G, Djahanschiri B, Zeller G, Mende DR, Alberti A, et al. Ocean plankton. Structure and function of the global ocean microbiome. Science. 2015;348(6237):1261359. doi:10.1126/science.1261359.
- Fu L, Niu B, Zhu Z, Wu S, Li W. CD-HIT: accelerated for clustering the next-generation sequencing data. Bioinformatics. 2012;28(23):3150–3152. doi:10.1093/bioinformatics/bts565.
- Li J, Jia H, Cai X, Zhong H, Feng Q, Sunagawa S, Arumugam M, Kultima JR, Prifti E, Nielsen T, et al. An integrated catalog of reference genes in the human gut microbiome. Nat Biotechnol. 2014;32(8):834–841. doi:10.1038/nbt.2942.
- Qin J, Li Y, Cai Z, Li S, Zhu J, Zhang F, Liang S, Zhang W, Guan Y, Shen D, et al. A metagenome-wide association study of gut microbiota in type 2 diabetes. Nature. 2012;490(7418):55–60. doi:10.1038/nature11450.
- Buchfink B, Xie C, Huson DH. Fast and sensitive protein alignment using DIAMOND. Nat Methods. 2015;12(1):59–60. doi:10.1038/nmeth.3176.
- Qin J, Li R, Raes J, Arumugam M, Burgdorf KS, Manichanh C, Nielsen T, Pons N, Levenez F, Yamada T, et al. A human gut microbial gene catalogue established by metagenomic sequencing. Nature. 2010;464(7285):59–65. doi:10.1038/nature08821.
- Kanehisa M, Goto S, Sato Y, Kawashima M, Furumichi M, Tanabe M. Data, information, knowledge and principle: back to metabolism in KEGG. Nucleic Acids Res. 2014;42(Database issue):D199–205. doi:10.1093/nar/gkt1076.
- Powell S, Forslund K, Szklarczyk D, Trachana K, Roth A, Huerta-Cepas J, Gabaldon T, Rattei T, Creevey C, Kuhn M, et al. eggNOG v4.0: nested orthology inference across 3686 organisms. Nucleic Acids Res. 2014;42(Database issue):D231–239. doi:10.1093/nar/gkt1253.
- Cantarel BL, Coutinho PM, Rancurel C, Bernard T, Lombard V, Henrissat B. The Carbohydrate-Active EnZymes database (CAZy): an expert resource for glycogenomics. Nucleic Acids Res. 2009;37(Database issue):D233–238. doi:10.1093/nar/gkn663.
- Backhed F, Roswall J, Peng Y, Feng Q, Jia H, Kovatcheva-Datchary P, Li Y, Xia Y, Xie H, Zhong H, et al. Dynamics and stabilization of the human gut microbiome during the first year of life. Cell Host Microbe. 2015;17(6):852. doi:10.1016/j.chom.2015.05.012.
- Martinez JL, Coque TM, Baquero F. What is a resistance gene? Ranking risk in resistomes. Nat Rev Microbiol. 2015;13(2):116–123. doi:10.1038/nrmicro3399.
- Liu B, Pop M. ARDB–antibiotic resistance genes database. Nucleic Acids Res. 2009;37(Database issue):D443–447. doi:10.1093/nar/gkn656.
- Forsberg KJ, Patel S, Gibson MK, Lauber CL, Knight R, Fierer N, Dantas G. Bacterial phylogeny structures soil resistomes across habitats. Nature. 2014;509(7502):612–616. doi:10.1038/nature13377.
- Broaders E, Gahan CG, Marchesi JR. Mobile genetic elements of the human gastrointestinal tract: potential for spread of antibiotic resistance genes. Gut Microbes. 2013;4(4):271–280. doi:10.4161/gmic.24627.
- Parnanen K, Karkman A, Hultman J, Lyra C, Bengtsson-Palme J, Larsson DGJ, Rautava S, Isolauri E, Salminen S, Kumar H, et al. Maternal gut and breast milk microbiota affect infant gut antibiotic resistome and mobile genetic elements. Nat Commun. 2018;9(1):3891. doi:10.1038/s41467-018-06393-w.
- Mardanov AV, Babykin MM, Beletsky AV, Grigoriev AI, Zinchenko VV, Kadnikov VV, Kirpichnikov MP, Mazur AM, Nedoluzhko AV, Novikova ND, et al. Metagenomic analysis of the dynamic changes in the gut microbiome of the participants of the MARS-500 experiment, simulating long term space flight. Acta Naturae. 2013;5(3):116–125. doi:10.32607/20758251-2013-5-3-116-125.
- Tremaroli V, Backhed F. Functional interactions between the gut microbiota and host metabolism. Nature. 2012;489(7415):242–249. doi:10.1038/nature11552.
- Russell WR, Duncan SH, Scobbie L, Duncan G, Cantlay L, Calder AG, Anderson SE, Flint HJ. Major phenylpropanoid-derived metabolites in the human gut can arise from microbial fermentation of protein. Mol Nutr Food Res. 2013;57(3):523–535. doi:10.1002/mnfr.201200594.
- Lee SM, Donaldson GP, Mikulski Z, Boyajian S, Ley K, Mazmanian SK. Bacterial colonization factors control specificity and stability of the gut microbiota. Nature. 2013;501(7467):426–429. doi:10.1038/nature12447.
- Fischbach MA, Sonnenburg JL. Eating for two: how metabolism establishes interspecies interactions in the gut. Cell Host Microbe. 2011;10(4):336–347. doi:10.1016/j.chom.2011.10.002.
- Pokusaeva K, Fitzgerald GF, van Sinderen D. Carbohydrate metabolism in bifidobacteria. Genes Nutr. 2011;6(3):285–306. doi:10.1007/s12263-010-0206-6.
- Presti I, D’Orazio G, Labra M, La Ferla B, Mezzasalma V, Bizzaro G, Giardina S, Michelotti A, Tursi F, Vassallo M, et al. Evaluation of the probiotic properties of new lactobacillus and bifidobacterium strains and their in vitro effect. Appl Microbiol Biotechnol. 2015;99(13):5613–5626. doi:10.1007/s00253-015-6482-8.
- Citar M, Hacin B, Tompa G, Stempelj M, Rogelj I, Dolinsek J, Narat M, Matijasic BB. Human intestinal mucosa-associated lactobacillus and bifidobacterium strains with probiotic properties modulate IL-10, IL-6 and IL-12 gene expression in THP-1 cells. Benef Microbes. 2015;6(3):325–336. doi:10.3920/BM2014.0081.