
ABSTRACT
Infection with Helicobacter pylori causes chronic inflammation and is a risk factor for gastric cancer. Antibiotic treatment or increased dietary folate prevents gastric carcinogenesis in male INS-GAS mice. To determine potential synergistic effects, H. pylori-infected male INS-GAS mice were fed an amino acid defined (AAD) diet with increased folate and were treated with antibiotics after 18 weeks of H. pylori infection. Antibiotic therapy decreased gastric pathology, but dietary folate had no effect. However, the combination of antibiotics and the AAD diet induced anemia, gastric hemorrhage, and mortality. Clinical presentation suggested hypovitaminosis K potentially caused by dietary deficiency and dysbiosis. Based on current dietary guidelines, the AAD diet was deficient in vitamin K. Phylloquinone administered subcutaneously and via a reformulated diet led to clinical improvement with no subsequent mortalities and increased hepatic vitamin K levels. We characterized the microbiome and menaquinone profiles of antibiotic-treated and antibiotic-free mice. Antibiotic treatment decreased the abundance of menaquinone producers within orders Bacteroidales and Verrucomicrobiales. PICRUSt predicted decreases in canonical menaquinone biosynthesis genes, menA and menD. Reduction of menA from Akkermansia muciniphila, Bacteroides uniformis, and Muribaculum intestinale were confirmed in antibiotic-treated mice. The fecal menaquinone profile of antibiotic-treated mice had reduced MK5 and MK6 and increased MK7 and MK11 compared to antibiotic-free mice. Loss of menaquinone-producing microbes due to antibiotics altered the enteric production of vitamin K. This study highlights the role of diet and the microbiome in maintaining vitamin K homeostasis.
Introduction
Helicobacter pylori is a gram-negative, microaerophilic bacterium that infects half of the world’s population, and causes a persistent, chronic gastritis, which can lead to peptic ulcers and gastric adenocarcinoma.Citation1 The prevalence of H. pylori infection is decreasing in developed countries but remains static or is increasing in developing countries.Citation2,Citation3 Eradication therapy, a combination of gastric acid suppressive drugs and antimicrobials, has played an important role in decreasing disease prevalence, limiting progression of preneoplastic lesions, and preventing gastric cancer.Citation4,Citation5 However, H. pylori resistance to clarithromycin and metronidazole is steadily increasing,Citation6,Citation7 which decreases the efficacy of a commonly prescribed regimen, such as proton pump inhibitor (PPI), clarithromycin, and amoxicillin or metronidazole. Recurrence and recrudescence of H. pylori following antibiotic eradication pose another concern.Citation8 Given the increasing antibiotic resistance and chance of recurrence, newer therapies focus on modifying lifestyle risks alone, or in combination with drugs, to decrease the progression of H. pylori-mediated gastric cancer.Citation9 Smoking, sodium, increased vitamin A intake, and meat consumption are associated with increased risk of stomach cancer, while intake of fruit, vegetables, and vitamins C and E may decrease risk.Citation8 Due to its role in the biosynthesis of purine and thymidylate, folate is crucial for DNA synthesis and repair. As a methyl donor, folate is fundamental in maintaining DNA methylation. Folate deficiency induces genomic instability, chromosomal gaps, DNA breaks and decreased total DNA methylation, which can be corrected with folate supplementation.Citation10 As DNA instability, damage and global hypomethylation are hallmarks of cancer, the role of folate supplementation in cancer has been studied, but results have been inconclusive, as dietary folate both prevents cancer development and promotes cancer progression in patients with preneoplastic and existing neoplastic conditions.Citation11,Citation12 Randomized clinical trials have not been able to conclusively determine the effect of dietary folate in cancer.Citation13,Citation14
Hypergastrinemic INS-GAS mice develop gastric cancer spontaneously by 20 months of age, but cancer can be observed as early as 24 weeks post-infection (WPI) when mice, particularly males, are infected with gastric Helicobacter spp.Citation15,Citation16 We previously demonstrated that antibiotic therapy eradicated H. pylori and decreased gastric dysplasia in male INS-GAS mice, even when treatment was initiated at 22 WPI.Citation17 We also reported that male INS-GAS mice infected with H. felis had decreased gastric dysplasia and inflammation when an increased supplementation of folate was provided through a chemically defined or amino acid defined (AAD) diet commencing as late as 16 WPI.Citation18 In our prior studies, the effect of increased folate supplementation was particularly pronounced when it was started earlier in life (as early as weaning). Given that this is not a realistic chemoprevention strategy, our current study tests the hypothesis that a combination of antimicrobial eradication therapy and increased dietary folate at a late, post-H. pylori infection timepoint would synergistically augment the chemopreventive effect in H. pylori-infected male INS-GAS mice.
During the course of the study evaluating the effects of increased dietary folate and antibiotics on gastric disease, unexpected morbidities, and mortalities related to extensive gastric hemorrhage occurred within days of oral administration of H. pylori antibiotic eradication therapy. As our previous studies using the AAD diet or antibiotic therapy alone did not elicit gastric hemorrhage or clinical signs of blood loss anemia, we investigated the cause of the coagulopathy and hypothesized that marginal vitamin K levels in the AAD diet in conjunction with antibiotic-induced dysbiosis resulted in morbidity and mortality. Vitamin K refers to a family of structurally related fat-soluble vitamers involved in blood coagulation. Phylloquinone (PK or vitamin K1) is produced by plants, while menaquinones (MKn where n = numberof sidechain prenyl units collectively called vitamin K2) are predominantly produced by bacteria and play a role in vitamin K homeostasis in animals.Citation19–Citation22 Menadione (MD or vitamin K3) is a synthetic provitamin lacking vitamin K activity that can be converted to biologically active MK4 in the liver. Along with variable levels of PK derived from plant-based components, MD is the predominant source of vitamin K in conventional rodent diets. However, in AAD diets, the substitution of grain-based products for chemically defined materials makes MD the sole dietary source of vitamin K. While antibiotics are known to disrupt microbe-regulated physiologic functions and intestinal homeostasis,Citation23,Citation24 we report that antibiotic-mediated dysbiosis can lead to gastric hemorrhage and blood loss anemia in mice fed defined diets with suboptimal vitamin K levels. Eradication of menaquinone-producing bacteria by antibiotics altered the enteric vitamin K reservoir leading to clinical disease, which was reversible with parenteral supplementation with PK.
Results
Antibiotic therapy eradicated H. pylori in INS-GAS mice independent of dietary folate
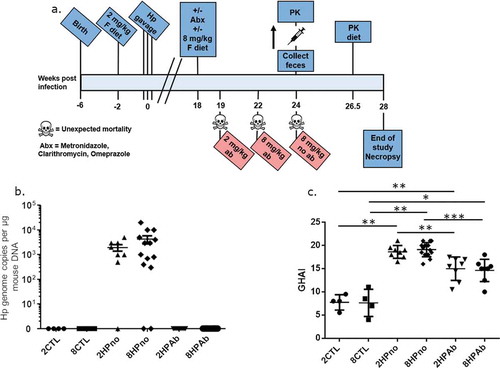
To evaluate potential synergistic effects of antibiotic therapy and increased dietary folate on H. pylori-mediated carcinogenesis, we set out to define whether late interventions using antibiotics and increased dietary folate altered the development of gastric cancer in H. pylori-infected INS-GAS mice. For this purpose, weaned INS-GAS mice were maintained on an amino acid defined (AAD) diet containing recommended levels of dietary folate (2 mg folate/kg diet). After 2 weeks on the AAD diet, mice were sham dosed or infected with H. pylori for 18 weeks to promote the development of gastric disease. At 18 weeks post infection (WPI), H. pylori-infected INS-GAS mice were given antibiotic eradication therapy (omeprazole, clarithromycin, and metronidazole), increased dietary folate (8 mg/kg of AAD diet), or both (, )). All mice were euthanized at 28 WPI. In the gastric tissue, H. pylori qPCR confirmed that mice receiving eradication therapy had no detectable H. pylori, while antibiotic-free cohorts were colonized with high levels of H. pylori ()). Three antibiotic-free mice had no detectable H. pylori but exhibited significant gastric pathology, indicating that the mice naturally cleared the infection. Increased dietary folate supplementation had no effect on H. pylori colonization or eradication.
Table 1. Mice included in the study.
Figure 1. Antibiotic therapy, but not increased folate, reduces gastric pathology of INS-GAS mice at 18 WPI. (a) Timeline describing the experimental design and clinical interventions in this study. (b) Complete eradication of H. pylori in cohorts receiving antibiotic therapy was measured by qPCR. Antibiotic-free mice remained infected with high levels of H. pylori, and bacterial levels were unaffected by folate. (c) Histopathologic scoring of gastric pathology shows decreased gastric pathology dependent on antibiotic treatment but not folate supplementation. *P ≤ .05; **P ≤ .01; ***P ≤ .001.
Antibiotic eradication therapy but not increased folate supplementation significantly decreased gastritis, premalignant lesions and expression of pro-inflammatory genes
Having established the successful elimination of H. pylori, we evaluated the effect of antibiotics and increased folate supplementation on the progression of H. pylori-induced pathology. Uninfected control mice fed AAD diets containing folate at either normal (2 mg folate/kg diet) (2CTL) or increased (8 mg folate/kg diet) (8CTL) levels, exhibited baseline pathology consistent with the INS-GAS mouse strain including sparse inflammation, moderate oxyntic atrophy, and hyperplasia, as well as minimal pseudopyloric metaplasia. H. pylori-infected mice not treated with antibiotics and fed diets containing 2 or 8 mg folate/kg diet (2HPno and 8HPno, respectively) had increased gastric pathology with severe gastric corpus alterations including moderate inflammation, multifocal epithelial defects, diffuse loss of oxyntic glands and foveolar and glandular hyperplasia accompanied by pseudopyloric metaplasia (), S1 and S2). Additionally, high-grade dysplastic lesions were observed in 2HPno and 8HPno mice. In contrast, antibiotic-treated, H. pylori-infected mice fed either 2 or 8 mg folate/kg of diet (2HPab and 8HPab, respectively) had reduced gastric pathology, attenuated inflammation, moderate oxyntic atrophy and metaplasia and the presence of low-grade dysplasia (Figures S1 and S2). Although antibiotic eradication therapy was protective, the development of low-grade dysplasia in this model was expected as we previously observed that H. pylori eradication prevented high-grade dysplasia, but mice treated at a late time point still developed low-grade dysplasia.Citation17 In contrast to our earlier study evaluating increased dietary folate at early time points,Citation18 increased dietary folate at 18 WPI had no effect on disease progression alone or in conjunction with antibiotic therapy. Similarly, gastric expression of pro-inflammatory cytokines (TNFα, Ifnγ, Il-1β, Il-17a, Il-22), as well as iNOS, Foxp3, and Mip1b, showed significant upregulation caused by H. pylori infection, which was abrogated by antibiotic treatment in 2HPab and 8HPab mice (Figure S3). Mipd and anti-inflammatory Il-10 showed increased levels in H. pylori-infected mice that did not receive antibiotics compared to uninfected mice, but the antibiotic treatment did not reduce the expression of these genes. No significant changes in gene expression were observed between 2 and 8 mg folate/kg diet groups.
Antibiotic therapy and an AAD diet promoted clinical anemia in H. pylori-infected mice, but PK supplementation restored normal CBC values and promoted recovery
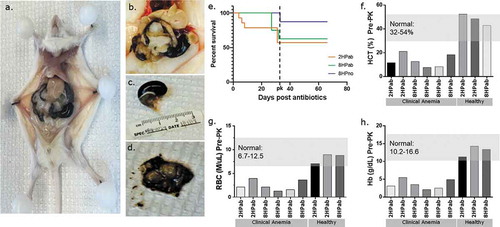
During the course of the experiment, 12 of 30 H. pylori-infected mice receiving antibiotic therapy and maintained on an AAD diet developed unexpected morbidity and mortality compared to 2 of 24 H. pylori-infected mice on AAD diet alone (). The increased mortality was not observed in our previous studies using either antibiotics or the AAD diet alone.Citation20,Citation21 Following the last dose of antibiotics, three 2HPab mice died due to unexpected gastrointestinal (GI) bleeding (). Three weeks later, three additional 2HPab and six 8HPab mice were found dead or moribund. Necropsies performed on euthanized animals exhibiting clinical signs revealed severe gastric hemorrhage with stomachs distended with unclotted blood. The liver, connective tissue, and other organs were pale and friable consistent with severe anemia (–)). Of the infected mice that did not receive antibiotics, two 8HPno mice were found dead with signs of gastric hemorrhage at day 33 post-antibiotic treatment. Due to the high mortality rate observed, veterinary staff evaluated the remaining H. pylori-infected cohorts on day 33 post-antibiotic treatment and found acute pallor and lethargy in the majority of mice. We performed complete blood counts (CBC) on six H. pylori-infected, antibiotic-treated mice that were clinically anemic, and three clinically healthy, H. pylori-infected, antibiotic-treated mice to aid in our diagnosis. CBC results revealed reduced hematocrit (HCT), red blood cell count (RBC), hemoglobin (Hb) and low white blood cell (WBC) consistent with acute blood loss in the six clinically affected mice (–)). In contrast, CBC results of clinically healthy mice from the same cohorts were within established normal reference ranges (–)). As the platelet count, mean corpuscular volume (MCV) and mean corpuscular hemoglobin concentration (MCHC) were within normal ranges, the anemia was classified as normocytic and normochromic. Increased reticulocytes suggested anemias were regenerative (). Together these findings suggested a coagulopathy leading to a presumptive diagnosis of vitamin K deficiency.
Table 2. Complete Blood Count results prior to PK supplementation.
Figure 2. Antibiotic therapy promotes clinical anemia, but phylloquinone supplementation restores normal CBC values. (a–d) Necropsy photos from clinically anemic mice. (a, b) Gross pathology of euthanized, moribund mouse. Livers present acute pallor and gastrointestinal tract is filled with hemorrhagic contents. (c) Significantly distended stomach filled with hemorrhagic contents. d) Incised stomachs exposing unclotted, digested blood content. (e) Kaplan-Meier plot showing mortality following the last antibiotic treatment (day 0). Following PK supplementation (dotted line), no further mortality was observed. (f–h) CBC results of six clinically ill and three healthy mice prior to vitamin K treatment. Each column represents an individual mouse. Mice showing clinical signs of lethargy, pallor, and dullness had hematocrit (HCT), red blood cell (RBC) and hemoglobin (Hb) values consistently lower than established reference ranges in mice. Clinically healthy mice had CBC values within normal reference ranges.
Based on the observed gastric hemorrhaging following treatment with antibiotics, suspected hypovitaminosis K and clinical signs of anemia, PK (Vitamin K1) treatment was initiated 5 weeks after the last antibiotic dose ()). All mice remaining on the study received 100 µg of PK, subcutaneously daily for 3 d, followed by an injection every 3 d for 2 weeks. Within 24–48 h of the first dose, PK-treated mice improved clinically, exhibiting increased activity and regaining normal-appearing mucus membranes and skin color. Rapid recovery upon PK treatment supported the diagnosis of hypovitaminosis K, as reported in other animal species in veterinary settings.Citation25,Citation26 Current recommendations suggest using PK over menadione (MD) as a source of vitamin K in defined rodent diets, and recommend providing 1 mg vitamin K/kg diet.Citation27 As such, both AAD diets containing 0.5 mg MD/kg diet were reformulated with 1.2 mg PK/kg diet to prevent a potential relapse. Dietary folate levels in the reformulated AAD diets were maintained according to the original specifications. Mice were switched to the reformulated AAD diets at 26.5 WPI. Following PK treatment and the switch to the reformulated diet, no additional clinically apparent anemias, morbidities or mortalities were observed for the remainder of the study ()).
As PK treatment promoted clinical recovery, we compared CBC values from clinically anemic mice prior to PK supplementation (PRE-PK) and following PK treatment (POST-PK) at the end of the study (). No statistical differences were observed between mice receiving normal folate containing diet of 2 mg/kg of diet or increased dietary folate supplementation of 8 mg/kg of diet; therefore, cohorts 2HPab and 8HPab were combined for PRE- and POST-PK treatment comparison. Prior to PK treatment, the complete blood cell count blood analysis of antibiotic-treated mice exhibiting clinical signs of anemia (n = 6) was below the established normal reference ranges for HCT, RBC and Hb, which is consistent with the diagnosis. Following PK treatment, HCT, Hb, and RBC counts for antibiotic-treated mice (n = 10) returned to normal limits for the majority of mice (). While three POST-PK mice had slightly depressed RBC and HB counts, the values were closer to clinically normal ranges than those observed PRE-PK (). While platelets remained within normal ranges throughout the study, PK supplementation was associated with robust increases in platelet counts (data not shown).
Figure 3. Phylloquinone supplementation restores normal CBC values. (a-c) Hematocrit (HCT), red blood cell (RBC) and hemoglobin (Hb) values of clinically anemic mice PRE-PK (n = 5) vs. mice POST-PK (n = 10). PK supplementation increased HCT, RBC and Hb values. ****P ≤ .001.
Insufficient vitamin K in the diet and antibiotics significantly decreased hepatic PK and MK4 levels, as well as fecal MK5 and MK6 levels
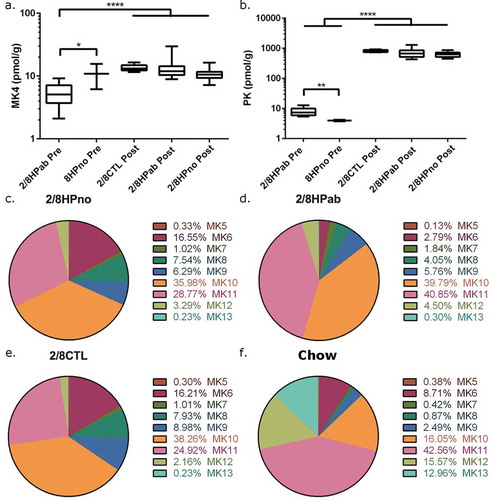
As the clinical recovery in response to PK treatment was consistent with the diagnosis of vitamin K hypovitaminosis, we measured the levels of metabolically functional vitamin K (PK and MK4) in the liver and determined menaquinone (MK5-MK13) levels in feces from both PRE- and POST-PK mice. Hepatic levels of PK and MK4 were measured in all POST-PK animals at the end of the study, as well as in necropsied, antibiotic-treated PRE-PK mice with anemia. Low levels of PK were measured in anemic PRE-PK animals (8.0 ± 2.4 pmol/g), but a 100-fold increase was detected POST-PK treatment (2HPab & 8HPab, 715 ± 220 pmol/g). This robust increase is likely due to dietary PK supplementation and confirmed the efficacy of the intervention ()). MK4 was also significantly higher in POST-PK animals (13.0 ± 4.8 pmol/g) compared to antibiotic-treated PRE-PK mice (5.5 ± 2.2 pmol/g, P < .0001, )).
Figure 4. Effects of antibiotic treatment in vitamin K levels in the liver and feces. (a) Liver MK4 and (b) liver PK levels were measured PRE-PK and POST-PK supplementation. For PRE-PK mice, 2/8HPab (n = 10) and 8HPno (n = 2). For POST-PK mice, 2/8CTL (n = 8), 2/8HPab (n = 17) and 2/8Hpno (n = 21). *P ≤ .05, **P ≤ .01, ***P ≤ .001, ****P ≤ .0001. (c-f) The relative abundance of fecal MKn prior to PK supplementation in (c) antibiotic-free, H. pylori-infected (2/8HPno), (d) antibiotic-treated, H. pylori-infected (2/8HPab), (e) uninfected mice on the AAD diet (2/8CTL), and (f) uninfected mice on standard rodent chow (Chow).
As menaquinones (MKn) produced by bacteria are another source of vitamin K, we measured fecal MKn levels to determine the effect of antibiotics on bacterial MKn. Fecal pellets were collected both PRE-PK and POST-PK and levels of MK5-13 were determined (Tables S1 and S2). The relative contribution of each MKn to the total vitamin K pool of each mouse was calculated and summarized in for each treatment group. The total fecal vitamin K pool is the sum of MK5-13 levels, and surprisingly was not significantly reduced by antibiotic treatment, diet or PK supplementation ().
Table 3. Total vitamin K (sum of MK5-MK13) in feces by treatment group.
As the clinical disease was only observed PRE-PK, we focused on comparing the fecal MKn profiles prior to PK supplementation. To evaluate the effect of the AAD diet on MKn, we obtained fecal pellets from age- and sex-matched, uninfected INS-GAS mice that were maintained on a conventional rodent diet from a separate study. To minimize other variables that might influence the microbiome, these mice were selected from the same cubicle in the vivarium. PRE-PK MKn levels were measured in the following treatment groups: a) uninfected mice on AAD diet (2CTL & 8CTL) ()); b) antibiotic-free, H. pylori-infected mice on AAD diet (2HPno & 8HPno) (); c) antibiotic-treated, H. pylori-infected mice on AAD diet (2HPab & 8HPab) ()); and d) uninfected mice on regular rodent diet (Chow) ()). In all groups, MK10 and MK11 were the most abundant MKn forms in feces (–f), Table S1). Uninfected (2/8CTL) and antibiotic-free, H. pylori-infected mice (2/8HPno) had similar fecal MKn profiles and lacked significant changes in composition. In contrast, antibiotic treatment significantly decreased fecal MK5 (p < .01) and MK6 (p < .0001) levels compared to uninfected and antibiotic-free, HP-infected mice (–e)). MK7 and MK11 were elevated in antibiotic-treated animals compared to antibiotic-free animals (MK7, p < .05; MK11, p < .01).
As AAD diets have a reduced fiber content, and low-fiber diets have been implicated in vitamin K deficiency in rats,Citation28 we compared feces from uninfected mice on the low-fiber AAD diet (2/8CTL) with feces from uninfected, age- and sex-matched INS-GAS mice on standard rodent diet (Chow) (–f)). 2/8CTL mice had increased relative abundance of MK7, MK8, MK9, and MK10 but decreased abundance of MK11, MK12 and MK13 compared to Chow mice (P< .05). Interestingly, both Chow and antibiotic-treated mice experienced a large increase in the relative abundance of MK11 compared to uninfected and antibiotic-free, H. pylori-infected mice on the AAD diet. However, as Chow mice did not develop severe gastric hemorrhage, we concluded MK11 increases in antibiotic-treated mice were not responsible for the phenotype observed. Furthermore, as the blood in the GI of anemic mice was unclotted, we speculated that antibiotic-treated mice experienced a loss of clotting function due to the loss of MKn, specifically MK5 and MK6, which were in lower abundance following antibiotic treatment. Differences in MKn abundances caused by antibiotics were largely lost in POST-PK mice (Figure S4). Interestingly, differences in multiple menaquinones were observed in mice fed diets with either 2 or 8 mg folate/kg of diet but did not lead to anemia or gastric hemorrhage (Figure S4).
Antibiotic therapy affected gut microbial community composition in PRE-PK mice but increased dietary folate influenced POST-PK microbiome
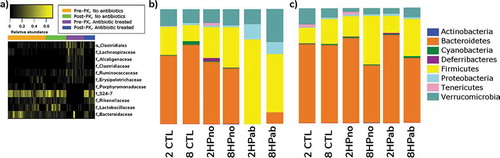
To measure the differences between microbial communities in mice with or without antibiotics, 16S rRNA profiling was performed on feces collected from PRE-PK (n = 55), POST-PK (n = 45), and Chow (n = 9) mice. Antibiotic treatment in 2HPab and 8HPab mice mediated the loss of families S24-7, Rikenellaceae, Lactobacillaceae, and Bacteroidaceae, while increases were observed in families Lachnospiraceae, Alcaligenaceae and an unknown family in order Clostridiales () and Table S3). This translated to a severe decrease in phylum Bacteroidetes and increases in Firmicutes and Proteobacteria in PRE-PK mice ()). The decreases in Bacteroidaceae are of note, as members of the genus Bacteroides have been associated with specific MKn profiles in humans.Citation29 We also noticed cage effects associated with antibiotic treatment, notably in the family Verrucomicrobiaceae (Figure S5). In our study, this family is entirely represented by Akkermansia muciniphila, a commensal bacterium of the gastrointestinal tract whose genome possesses canonical menaquinone synthesizing genes.Citation30 Following antibiotic-treatment, a bimodal distribution of Verrucomicrobiaceae was observed as 15 of 25 2HPab/8HPab mice had abundances <0.01%, while the average relative abundance of 49.8% in the remaining 10 mice was higher than that observed in antibiotic-free mice (13%) (Figure S5). Other bacterial families with potential cage effects are Lactobacillaceae and Bacteroidaceae (Figure S5). We believe these cage effects could potentially exacerbate vitamin K deficiency, which may account for increased mortality in specific 2HPab and 8HPab cages. Interestingly, POST-PK microbiome profiles of antibiotic-treated mice resembled antibiotic-free, H. pylori-infected mice with similar folate supplementation, and only two families with greater than 1% relative abundance showed significant changes (Table S4).
Figure 5. Antibiotic effects on microbiota. (a) Heatmap of microbial taxa that were differentially expressed due to antibiotic treatment in mice before (Pre-PK) and after (Post-PK) Vitamin K supplementation. Selected taxa displayed relative abundances >1%, a Linear Discriminant Analysis (LDA) log-score >2.0, and p < .05 by the Kruskal–Wallis test. The complete list is provided in Table S3. Color intensity indicates increasing relative abundances. (b–c) Bar plots showing relative abundances of bacteria at the phylum level b) prior to PK supplementation and (c) at the end of the study following PK supplementation.
We next elucidated the effect of folate between 2CTL and 8CTL mice. Significant differences were observed in seven bacterial families with greater than 1% abundance in the microbiome (Tables S3 and S4). Of interest, increased dietary folate in the 8CTL group decreased the abundance of families S24-7, Bacteroidaceae, and Verrucomicrobiaceae, which were identified as menaquinone producers and were sensitive to antibiotic treatment (Figure S7, Tables S3 and S4). Two other potential confounders, H. pylori infection and PK supplementation, were also evaluated. H. pylori effects were evaluated in uninfected (2CTL/8CTL) and antibiotic-free H. pylori-infected (2HPno/8HPno) mice, and the major finding was a significant increase in Lactobacillaceae (Tables S3 and S4). The effect of PK supplementation was assessed in PRE-PK and POST-PK uninfected mice (2CTL/8CTL), but no differences were detected by LEfSe in families with greater than 1% abundance (Table S3 and S4). We concluded that PK supplementation had little effect on the fecal microbiome of antibiotic-free, uninfected mice.
Antibiotic therapy altered alpha and beta diversity PRE-PK, while folate influenced POST-PK diversity
As antibiotics and folate affected the bacterial composition, we next determined the effects on alpha diversity or species diversity. In PRE-PK samples, the chao1 index was highest in antibiotic-free mice and was dependent on dietary folate (2CTL: 1,118 ± 12; 2HPno: 1,126 ± 56; 8CTL: 421 ± 27 and 8HPno: 638 ± 80, [mean±SEM]). The lowest chao1 values were observed in antibiotic-treated mice (2HPab: 244 ± 16 and 8HPab: 197 ± 14) and mice fed standard chow (Chow: 249 ± 22) ()). In POST-PK samples, low dietary folate increased alpha diversity (2CTL: 1029 ± 44; 2HPno: 1071 ± 28 and 2HPab: 1140 ± 28), while high dietary folate decreased alpha diversity (8CTL: 420.9 ± 16; 8HPno: 639.8 ± 66 and 8HPab: 466.6 ± 32) ()). However, prior antibiotic treatment did not modulate species diversity. Significant differences in chao1 and observed species are summarized in Table S5.
Figure 6. Antibiotics and folate affect alpha and beta diversity in the fecal microbiome. (a–b) Alpha diversity plots. (a) In PRE-PK mice, decreased alpha diversity is associated with both 8 mg folate/kg diets, conventional chow and antibiotic treatment. (b) In POST-PK mice, the effect of antibiotics is lost, but increased dietary folate reduces alpha diversity. P-values computed using a Kruskal–Wallis test followed by a Dunn’s multiple comparison test. *p < .05, **p < .01, and ***p < .001. (c–d) Principal coordinates analysis. (c) Unweighted UniFrac ordination and d) box plot of PC1 by treatment group highlight differences in fecal microbial communities due to antibiotics and dietary folate. Fecal microbiomes clearly clustered by either antibiotic treatment or dietary folate suggesting effects of both treatments on the microbiome.
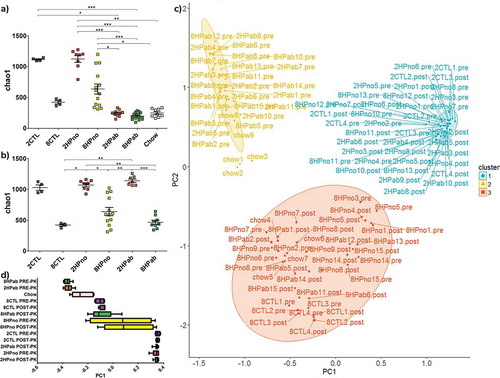
To measure the similarity between microbial communities in mice with or without antibiotic treatment, principal coordinate analysis (PCoA) was performed using unweighted UniFrac on both PRE-PK and POST-PK samples. PCoA showed that samples clearly segregated into three clusters based on 1) low dietary folate, 2) recent antibiotic treatment, and 3) high dietary folate (–)). Cluster 1 includes PRE-PK and POST-PK 2HPno mice, as well as POST-PK 2HPab mice, which confirms that antibiotic effects were transient. Cluster 2 was mainly composed of PRE-PK antibiotic-treated mice, but also included a subset of Chow diet mice. Cluster 3 includes the mice receiving increased folate (8mg/kg of diet), with the exception of PRE-PK mice receiving antibiotics and a single cage of 8HPno that grouped with cluster 1. Weighted UniFrac analysis segregated the data into PRE-PK mice receiving antibiotics vs. the rest of the treatment groups (Figure S6). Beta diversity statistics are compiled in Table S6. In summary, antibiotics affect the composition, alpha diversity and beta diversity at PRE-PK, but the effects are reduced 9 weeks after the final antibiotic administration when POST-PK samples were collected. While antibiotic treatment masked folate effects in PRE-PK mice, dietary folate levels affect both alpha and beta diversity POST-PK, but these differences were not associated with clinical anemia.
Antibiotics decreased copies of menaquinone biosynthesis genes
To gain a functional understanding of the antibiotic- and folate-mediated effects, we used PICRUSt to predict functional profiles of the fecal metagenome. Of 6,909 genes analyzed, we focused on 14 menaquinone metabolism and 16 folate biosynthesis genes listed in Table S7. We analyzed the functional profiles of antibiotic-treated (2HPab/8HPab) and antibiotic-free mice (2CTL/8CTL/2HPno/8HPno) prior to PK supplementation, and we observed an antibiotic-mediated reduction in menA and menD, two genes necessary for menaquinone synthesis ()). A smaller, but significant, antibiotic-mediated increase was also predicted in menaquinone genes, menH and wrbA. The decrease in menA and menD calculated by PICRUSt were associated with the reduced abundance of bacteria within orders Bacteroidales and Verrucomicrobiales in antibiotic-treated mice ()).
Figure 7. Menaquinone biosynthesis is reduced by antibiotics. (a) Significant differences in gene copy number due to antibiotic treatment were predicted in menaquinone metabolism genes (menA, menD, menH, and wrbA) in PRE-PK samples. (b) Copy numbers of menA gene from Akkermansia muciniphila, Bacteroides uniformis, and Muribaculum intestinale were determined by qPCR and show decreased gene copies in antibiotic-treated mice. P-values computed using a Kruskal–Wallis test followed by a Dunn’s multiple comparison test. *p < .05, **p < .01, and ***p < .001.
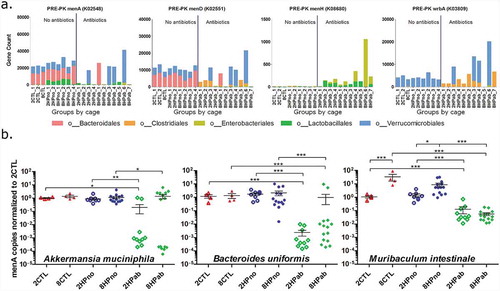
Due to its importance in menaquinone biosynthesis, we hypothesized that the predicted loss of menA in antibiotic-treated mice could account for shifts in the MKn profiles observed in fecal samples. To confirm the PICRUSt results, we identified Akkermansia muciniphila, Muribaculum intestinale, and Bacteroides uniformis within orders Verrucomicrobiales and Bacteroidales as the major menA (K02548) contributors in the analysis. Using published menA sequences for each species, we designed three primer pairs to quantify copies of menA DNA. Significant reductions in menA copies were measured in antibiotic-treated mice for the three menaquinone-producing bacteria surveyed ()).
Folate biosynthesis genes were modulated by both antibiotics and dietary folate
Examining the effect of antibiotics on folate biosynthesis before PK treatment, antibiotics increased counts of two folate genes and decreased the copies of seven genes (Figure S8 and Table S8). The changes in predicted copies of these genes were associated with shifts in abundance observed in Clostridiales, Bacteroidales, and Verrucomicrobiales. However, all predicted antibiotic-mediated functional changes were lost in POST-PK samples.
As noted in the microbiome results, antibiotic treatment strongly masked the effect of folate in PRE-PK samples. However, in POST-PK samples, five folate and one menaquinone genes were differentially expressed between the low and high folate groups due to Bacteroidales and Clostridiales shifts (Figure S8 and Table S8).
Reduced MK5-6 levels associated with antibiotic treatment by PCA and PLSDA models
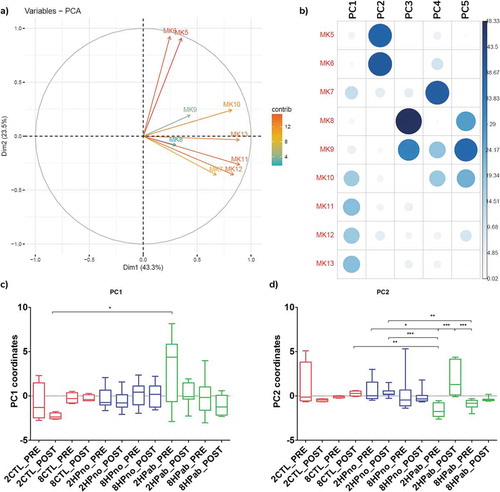
To study the relationship between treatment, MKn profile, and microbiome composition, we next generated a Principal Component Analysis (PCA) plot including MKn data and a partial least squares discriminant analysis (PLSDA) model combining microbiome data and MK6 data. In the PCA plot of MKn data from PRE-PK and POST-PK mice, three principal components (PC) accounted for 84.2% of the variability in MKn data. The first PC was determined by MK7 and MK10-13, while MK5-6 associated with the second PC, and MK8-9 contributed to the third PC (–b)). Plotting PC1 and PC2 coordinates by treatment group (–d)), we observed that PRE-PK mice receiving antibiotics (2HPab & 8HPab) had significantly lower PC2 coordinates compared to mice without antibiotics or POST-PK samples ()). Negative PC2 coordinates imply a negative correlation between the MKn profiles of PRE-PK antibiotic-treated mice with MK5 and MK6. As MK6 was associated with antibiotic-treated mice that developed anemia, we created a PLSDA model to identify bacterial families associated with changes in MK6. Bacteroidaceae was the single most informative family in predicting MK6 levels in the model (Figure S9), which concurred with the microbiome analysis and PICRUSt results.
Figure 8. Principal component analysis of fecal menaquinones associates MK5-6 with antibiotic treatment. (a) PCA of MKn data. (b) Contribution of each MKn to principal components (PC) shows PC2 is associated with MK5-6. (c) Boxplots of PC1 coordinates by treatment group. d) Boxplots of PC2 coordinate by treatment group. Negative PC2 values for PRE-PK antibiotic-treated mice (2HPab_PRE and 8HPab_PRE) indicate an inverse correlation with MK5-6 values. *p < .05, **p < .01, and ***p < .001.
Discussion
In this study, we hypothesized that H. pylori antibiotic eradication therapy and increased dietary folate supplementation at a late time point would synergistically prevent gastric cancer in H. pylori-infected INS-GAS mice. We had previously demonstrated that antibiotic therapy in H. pylori-infected INS-GAS mice significantly decreased gastric pathology,Citation17 and increased dietary folate starting at 0 and 8 WPI prevented global DNA methylation and reduced gastric dysplasia.Citation18 However, at 16 WPI increasing dietary folate only reduced the degree of gastric dysplasia, but did not reduce methylation levels.Citation18 In the current study, antibiotic therapy reduced gastric pathology and expression of pro-inflammatory cytokines, while increased dietary folate had no effect when implemented at 18 WPI. The lack of effect might be due to the complex role of folate in carcinogenesis, which is highlighted by the lack of consensus on the role of folate in colorectal cancer (CRC). Studies have associated folate intake at the recommended levels with reduced risk of CRC,Citation31,Citation32 while others show CRC prevention with reduced folate intake.Citation12,Citation33 Still, others have shown no association between CRC and folate or increased CRC rates with folic acid fortification.Citation34 Similarly, randomized clinical trials have shown both increased rates of cancer, lesions, and colorectal adenomas,Citation13 but others have found protective effects.Citation14,Citation35 Our current data suggest that the therapeutic window of increased dietary folate in INS-GAS mice is earlier than 16 WPI. Furthermore, increased dietary folate intake combined with antibiotics provided no synergistic protection in H. pylori-infected INS-GAS mice at 18 WPI.
However, the combination of antibiotics with an AAD diet resulted in unanticipated morbidity and mortality, which presented as severe gastric hemorrhage, markedly pale tissues and acute anemia defined by low HCT, RBC, and Hb values. Unfortunately, diagnostic coagulation profiles (prothrombin time (PT) or partial thromboplastin time (PTT)) were not performed prior to PK treatment due to the acute and unexpected onset of mortality. Nevertheless, based on the clinical presentation and CBC results, we suspected vitamin K deficiency, possibly caused by the combination of AAD diet and antibiotic therapy. We hypothesized that in antibiotic-treated mice fed AAD diets with marginal amounts of vitamin K, both dietary and bacterial reservoirs of vitamin K were destabilized, which led to reduced clotting ability,Citation36 gastric hemorrhage, and clinical anemia. Additional risk factors included the sex of the mice and the duration of the experiment, as aged male mice have increased dietary vitamin K requirements.Citation27
Our previous study demonstrates that markedly reducing enteric bacteria alone is not sufficient to cause anemia in INS-GAS when provided sufficient dietary vitamin K in a standard rodent diet (1.9 mg MD/kg of diet).Citation17 Upon evaluating current nutritional guidelines for mice, we determined the AAD diet containing menadione (MD) at 0.5 mg/kg diet provided suboptimal levels of vitamin K.Citation27,Citation37 However, diet alone does not explain the hemorrhage observed as no clinically apparent anemias were observed prior to antibiotic treatment, and our previous study using INS-GAS mice on the AAD diets with 0.5 mg MD/kg of diet did not result in anemia.Citation18 Interestingly, in the current study, two H.pylori infected mice fed increased folate (8 mg/kg diet) with no antibiotic treatment developed fatal gastric hemorrhages. While both studies used INS-GAS mice fed identical AAD diets, the studies differed in the species of gastric Helicobacter used and the location of the vivarium. The INS-GAS model has been successfully reproduced in multiple research institutions using both Helicobacter felis and H. pylori, but the severity of the disease can vary between organisms and institutions.Citation18,Citation38–Citation40 Increased ulceration could exacerbate pathologies related to hypovitaminosis K and anemia. Another important variable is that the Gonda study was performed at Columbia Medical Center, while our current study was performed at MIT. Location can strongly influence the microbiome of mice, and we have previously demonstrated that alterations in the microbiota at different institutions or from different vendors can affect the pathogenesis of Helicobacter-mediated models.Citation41,Citation42 We have also determined that the gastric microbiome of INS-GAS mice from different institutions can change significantly and have an effect on the severity of H. pylori-induced disease (Sheh et al., unpublished data). In addition to altering Helicobacter-mediated inflammation, the changes in bacterial communities may directly alter the MKn levels in the mice in both vivariums. Further research is necessary to determine the role of different gastric Helicobacter species and the underlying microbiome in the coagulopathy described in the current study.
The contribution of gut-produced MKn to vitamin K nutriture in humans is not fully understood.Citation43 However, broad-spectrum antibiotics reduce total hepatic MKn levels in patients, implying a connection between the microbiome and bioavailable vitamin K in the liver.Citation44 Additionally, cephalosporins can induce hypoprothrombinemia either through the elimination of MKn producers or inhibition of vitamin K-epoxide reductase and vitamin K-dependent carboxylase.Citation45,Citation46 In laboratory animals, the importance of gut-produced vitamins acquired via coprophagy is well documented.Citation21,Citation22 The lower gut serves as a reservoir of bacterially produced MKn. MKn from the gut has been detected in the liver, implying intestinal absorption or coprophagy as mechanisms of MKn uptake.Citation47 Rats fed vitamin K-free diets and prevented from practicing coprophagy uniformly develop vitamin K deficiency manifested as an increased prothrombin time.Citation21 Hypovitaminosis K in germ-free rats fed vitamin K-deficient diets were rescued by mono-association with Escherichia coli.Citation48 In our current study, two broad-spectrum antibiotics (clarithromycin and metronidazole) eliminated well-known MKn producers within the phylum Bacteroidetes. The family Bacteroidaceae produces MK9-11 and is associated with MK9-MK10 menaquinotype in humans.Citation29,Citation49 S24-7 (currently Muribaculaceae), a putative MK11 and MK12 producer, was the single most abundant family in antibiotic-free mice but was found at 0.1% following antibiotic treatment. Following antibiotic treatment, there was a transient replacement with non-MKn producing bacteria such as members of the order Clostridiales. Based on PICRUSt predictions, we focused on the menA gene, also known as 1,4-dihydroxy-2-naphthoate octaprenyltransferase. MenA catalyzes the addition of an isoprenyl diphosphate to 1,4-dihydroxy-2-naphthoate to form demethylmenaquinone in the canonical menaquinone biosynthesis pathway, and loss of the menA gene abrogates synthesis of MKn in E. coli.Citation50 Using qPCR, we measured a significant reduction in the menA genes of A. muciniphila, B. uniformis, and M. intestinale caused by antibiotics (). As decreases in the copy number of menA gene were observed, we expected reductions in fecal total vitamin K levels; however, total vitamin K levels were not significantly different across treatment groups (). We did observe a reduction in the levels of biologically active MK4, albeit in a small sample size, in the livers of antibiotic-treated mice ()), which implied that antibiotics reduced the levels of specific MKn required for MK4 synthesis. As bacteria synthesize different MKn based on length of the isoprenyl sidechain attached by MenA,Citation36 we hypothesized that loss of specific bacteria in antibiotic-treated mice reduced levels of specific MKn that play an important role in blood clotting as evidenced by decreased hepatic MK4, anemia, and gastric hemorrhage.
MKn composition was markedly different in antibiotic-treated groups where there was a 13.8% decrease in MK6 abundance and a 12.1% increase in MK11 abundance (–f)). As an increase of similar magnitude in MK11 was observed in healthy mice on chow diet ()), we focused on the large decrease in MK6 in antibiotic-treated mice on AAD diets. While bacterially derived MKn alone may not be sufficient to improve all blood coagulation metrics,Citation51 Akiyama et al. were able to show differences in liver absorption and coagulation activity based on the number of prenyl units of MKn in a rat model of hypoprothrombinemia.Citation49 In this model, hypoprothrombinemia was induced via a vitamin K-deficient diet and warfarin, leading to undetectable MKn levels in both plasma and liver. MK1-14, as well as MD, was administered orally or intravenously to hypoprothrombinemic rats. MK4, MK5, and MK6 increased hepatic MKn levels and markedly improved hypoprothrombinemia. MK7 and MK8 slightly improved coagulation activity, but the remaining MKn, including MK11, provided no improvement in coagulation activity.Citation49
In our study, significant reductions in fecal MK5-6 were observed in antibiotic-treated groups, which experienced a 40% mortality rate due to gastric hemorrhage (, ) and )). As MK5-6 improves blood coagulation in hypoprothrombinemic rats,Citation49 we hypothesize that gastric erosions induced by H. pylori infection led to uncontrolled bleeding due to reduced coagulation activity in antibiotic-treated mice consuming the AAD diet. Compensation with other MKn, notably MK11, had negligible effects on coagulation activity.Citation49 Due to the magnitude of MK6 loss in our model, we examined changes in abundance of known MK6 producers, such as Helicobacter spp., E. coli and Eggerthella lenta (previously Eubacterium lentum).Citation52,Citation53 H. pylori infection of the stomach did not alter fecal MK6 levels as uninfected controls and antibiotic-free, H. pylori-infected mice had similar MK6 levels (,e)). As mice were housed in specific pathogen-free conditions, enteric Helicobacter spp. or Escherichia spp. were not detected in the fecal microbiome. Eggerthella, a known MK6 producer, was enriched in antibiotic-free mice compared to antibiotic-treated mice but was present in low abundance (<0.1%) (Tables S3 (Family Coriobacteriaceae) and S12). Further studies will be required to identify bacterial species contributing to MK6 production and its role in coagulopathy.
In summary, our study demonstrated that at 18 WPI antibiotic eradication of H. pylori in INS-GAS mice decreased gastric neoplasia, but late supplementation with high levels of dietary folate had no significant benefit. In addition, our data indicate that the combination of an AAD diet with suboptimal levels of vitamin K and antibiotic eradication of MKn producers induced vitamin K deficiency, clinical anemia, and severe gastric hemorrhage, which led to unexpected morbidity and mortality in aged, male INS-GAS mice infected with H. pylori. This study highlights the importance of meeting nutritional requirements when utilizing synthetic or custom-made diets and when manipulating the microbiome, as nutrient metabolism or absorption may be altered. Additionally, our results highlight the potential risk of hypovitaminosis K in humans with dietary deficiencies or malabsorption that limit vitamin K intake, who require concurrent antibiotic treatments.
Methods
Diets
Amino acid defined (AAD) diets containing folic acid at 2 (A08112102, Research Diets, Inc, Newark, NJ) or 8 mg/kg diet (A08112103) were formulated for this study to regulate dietary folate intake. Rodent vitamin mix V14901 was added as a vitamin source to both AAD diets, which contains menadione sodium bisulfite at 0.5 mg/kg diet as the vitamin K source. While the vitamin K requirements of the AAD diets were reflective of the AIN76A rodent diet, which provides 0.5 mg MD/kg diet, AAD diets lacked casein, which provides an additional 17-25% increase in PK (vitamin K1).Citation27 As vitamin K deficiency was suspected, the original AAD diets were reformulated to increase vitamin K by using 1.2 mg PK/kg diet. The change from MD to PK reflects newer recommendations suggesting PK as the vitamin K source in the rodent diets such as AIN93G and AIN93M.Citation27 Additionally, the conventional, grain-based, closed-formula diet (RMH3000, Purina Mills, St. Louis, MO) was used for comparative vitamin K and microbiome analysis. RMH3000 is a standard rodent chow formulated with 1.9 mg/kg diet of menadione dimethylpyrimidone bisulfite as a vitamin K source.
Mice and infection studies
All studies were approved by the Massachusetts Institute of Technology (MIT) Committee on Animal Care. Specific pathogen-free, male INS-GAS mice on an FVB/N background (Tg (Ins1-GAS) 1Sbr) were bred and maintained within an AAALAC International accredited facility at MIT. Mice were housed on hardwood chip bedding (SaniChip, PJ Murphy, Methuen, MA) in microisolator, solid-bottomed polycarbonate cages. Room temperatures were set at 20 ± 1°C and relative humidity at 30-70%. Four-week-old male INS-GAS mice were fed an AAD diet containing folic acid at 2 mg/kg diet (A08112102). At 6 weeks of age, H. pylori-infected mice were infected by oral gavage with 0.2 ml of H. pylori SS1 at 1 × 10⁹ CFU/ml every other day for a total of three doses, and control mice were sham infected three times with 0.2 ml Brucella broth at the same intervals. Approximately 1 month after infection, four mice were euthanized to confirm H. pylori colonization. At 18 WPI, a subset of the infected and uninfected mice was switched to an AAD diet containing folic acid at 8 mg/kg diet (A08112103). Concurrent with placing mice on the enriched folate diet, 14 infected mice on 2 mg folic acid/kg diet and 16 infected mice on 8 mg folic acid/kg diet were dosed by oral gavage with omeprazole (400 μmol/kg/d; Wedgewood Pharmacy), metronidazole (14.2 mg/kg/d; Wedgewood Pharmacy), and clarithromycin (7.15 mg/kg/d; Wedgewood Pharmacy) in a 0.2-mL volume twice a day for 7 d as previously described.Citation17 The number of mice included in the study is summarized in .
Following unexpected morbidity and mortality associated with acute gastric bleeding at approximately 24 WPI, all mice received subcutaneous injections of 100 µg of phylloquinone (PK) in NaCl and dextrose solution for 3 d followed by an injection every 3 d for 2 weeks. At 26.5 WPI, all mice were placed on reformulated AAD diets containing either 2 or 8 mg folate/kg diet and 1.2 mg PK/kg diet ()). Study cohorts are summarized in and consisted of mice fed 2 mg folate/kg diet with no H. pylori infection or antibiotics (2CTL), H. pylori-infected mice with no antibiotics (2HPno), and H. pylori-infected mice receiving antibiotics (2HPab). Similarly, mice receiving 8 mg folate/kg diet were divided into uninfected mice with no antibiotics (8CTL), H. pylori-infected mice with no antibiotics (8HPno), and H. pylori-infected mice receiving antibiotics (8HPab) ( and )). Age- and sex-matched, uninfected INS-GAS mice on a standard rodent diet (RMH3000) had feces collected for comparative vitamin K and microbiome analysis. Mice on the standard rodent diet were bred at MIT and housed in the same cubicle as mice on the AAD diet and were included as the “Chow” group.
Necropsy
At 28 WPI, mice were euthanized by CO2 inhalation. Serum was collected and frozen. Stomach tissue was collected from the squamous forestomach to the proximal duodenum. A central longitudinal strip of gastric tissue was collected from each animal and processed for histological examination as previously described.Citation54 Adjacent gastric tissue was flash-frozen for RNA and DNA extraction. Gastric lesions were graded by a blinded, boarded veterinary pathologist (SM) on an ascending score from 0 to 4 for inflammation, epithelial defects, atrophy, hyperplasia, pseudopyloric metaplasia, dysplasia, and mucous metaplasia.Citation55 The gastric histopathologic assessment index (GHAI) provides an overall index of gastric disease severity and consists of the sum of the following six criteria: inflammation, epithelial defects, oxyntic atrophy, hyperplasia, pseudopyloric metaplasia, and dysplasia/neoplasia.
Complete blood count (CBC)
Clinically anemic mice were humanely euthanized using CO2 following AVMA guidelines. Following intra-cardiac collection, approximately 1 ml of blood was placed into an EDTA blood collection tube. Blood from clinically healthy mice was collected from the submandibular vein using a 5 mm lancet. All collected blood was immediately inverted multiple times in EDTA tubes. CBCs were performed by the Comparative Pathology Diagnostic laboratory at the MIT Division of Comparative Medicine with the HEMAVET 950FS (Drew Scientific, Miami Lakes, FL).
H. pylori colonization levels
Gastric tissue was extracted using the DNeasy PowerLyzer PowerSoil Kit according to the supplier’s protocol (Qiagen Inc., Valencia, CA). Bead beating of samples was performed with a Next Advance Bullet blender (Troy, NY) for 8 min at the maximum speed. Concentration and quality of the prepared DNA were analyzed using Nanodrop 2000C (Thermo Scientific, Wilmington, DE). H. pylori colonization levels were quantified using a fluorogenic PCR assay with urease B primers.Citation56 H. pylori copy numbers were normalized to a microgram of mouse chromosomal DNA as determined by quantitative PCR with a eukaryotic 18S endogenous control (Life Technologies, Carlsbad, CA).
Vitamin K analysis
Liver (0.2 g) was homogenized in PBS using a Powergen homogenizer (Fisher Scientific). Reversed phase HPLC was used to measure PK and MK4 in livers.Citation57 Fecal vitamin K (PK, MK5-MK13) in 0.1 g feces was measured by LC-atmospheric pressure chemical ionization-MS as previously described.Citation58
Microbiome analysis
Fecal DNA was extracted using the DNeasy PowerLyzer PowerSoil Kit, and DNA was amplified using universal primers of F515 (GTGYCAGCMGCCGCGGTAA) and R926 (CCGYCAATTYMTTTRAGTTT) to target the V4 and V5 regions of bacterial 16S rRNA fused to Illumina adaptors and barcode sequences as described previously.Citation59 Individual samples were barcoded and pooled to construct the sequencing library, followed by sequencing with an Illumina MiSeq instrument to generate pair-ended 300 × 300 reads. Overlapping pair-end reads were aligned using PEAR.Citation60 Paired reads shorter than 300 bp were filtered out. Subsequent analysis and normalization were performed using QIIME 1.9.1 within the MicrobiomeHelper v. 2.0.0 virtual box.Citation59,Citation61,Citation62 Chimeric sequences were removed by comparison to the database Bacteria_RDP_trainset15_092015.fa. Operational taxonomic units (OTUs) present at less than 0.1% of total reads were removed. Microbial communities were compared using UniFrac. Sequences were grouped into OTUs at 97% sequence similarity using uclust. Taxonomy was assigned using Ribosomal Database Project (RDP) classifier against GreenGenes database, and sequences were aligned, and a phylogenetic tree was constructed from reference sequences using FastTree. An OTU table showing counts of each OTU in each sample was produced. To control for differences in sequencing depth, OTU tables were rarified at a single sequencing depth.Citation63,Citation64 Alpha diversity was determined using the Chao 1 index. Significant differences in alpha diversity were evaluated using a non-parametric two-sample t-test with p-values <0.05 were considered significant. Beta diversity was determined using weighted UniFrac and the results presented as principal coordinate analysis (PCoA) plots.Citation65 Microsoft Excel and R (v 3.4.1 at http://www.R-project.org/) were used to perform statistical analyses and graphically represent data. Additionally, R library ggplot2 (2.2.1), FactoMineR, factoextra, missMDA, corrplot, cluster, fpc, plsdepot, caret, vegan, and gtools were used to model microbiome and menaquinone data.Citation66,Citation67 Two-sample unequal variance t-tests were performed on the distance matrices with P-values <0.05 considered significant. Abundance of bacterial families was plotted using an arcsine transformation of the square root of the relative abundance of each bacterial family in each individual sample. Significant differences in the relative abundance of select bacterial taxa were analyzed using Linear discriminant analysis effect size (LEfSe) to compare the effects of antibiotics, dietary folate, and H. pylori infection.Citation68 Statistical significance was determined using the Kruskal–Wallis test with a posthoc pairwise Wilcoxon test to compare subclasses. Samples with P-values <0.05 for both tests were then screened for effect size using a threshold of 2 for the logarithmic linear discriminant analysis score computed by LEfSE. In silico prediction for the capability of KEGG pathways was performed using PICRUSt 1.1.Citation62 STAMP software was used to analyze the differences in KEGG orthology identifiers in the feces using a two-sided White’s non-parametric t-test with the Benjamini-Hochberg procedure for multiple test correction.Citation69 Pathways with corrected P-values <0.05 were considered significant.
Quantitative PCR of cytokines, FoxP3, iNOS, and menA
Total RNA was extracted from gastric tissue with Trizol reagent (Invitrogen, Carlsbad, CA), and cDNA was synthesized from 5 μg of total RNA using the High Capacity cDNA Archive kit (Applied Biosystems, Foster City, CA). mRNA levels for IL-10, TGFβ, IL-17A, IL-1β, TNFα, IFNγ, iNOS, FoxP3, and endogenous control, GAPDH, were quantified using TaqMan gene expression assays (Applied Biosystems, Foster City, CA) in the 7500 FAST Sequence Detection System. mRNA levels were normalized to GAPDH expression with baseline comparisons made to uninfected mice using the ΔΔCT method.
Quantitative PCR of the menA gene was performed on fecal DNA extracted for microbiome analysis using SYBR Green Master Mix (Applied Biosystems). Briefly, Akkermansia muciniphila, Bacteroides uniformis, and Muribaculum intestinale were identified as the three major bacterial contributors to the menA gene (K0548) in PICRUSt analysis. These three species contributed >60% of menA copies in the study. Published genomes for each species were collected, and 83, 71 and 3 menA sequences were extracted and aligned for A. muciniphila, B. uniformis, and M. intestinale, respectively. Based on alignments, qPCR primers were designed for each species with specificity confirmed using BLASTn. Preliminary testing revealed clean peaks in melting curve analysis. Primers used to detect menA were AKK_f 5ʹ-TGCCTCCAGATTGCCTGCA-3ʹ and AKK_r 5ʹ-CCGCTGGCCGTCATGCGCA-3ʹ for A. muciniphila, BAC_f 5ʹ-AACAGAATTCACCCTACGCATGGT-3ʹ and BAC_r 5ʹ- GCAATCTGCATGCCGCAGG-3ʹ for B. uniformis and MUR_f 5ʹ-TCTGCGCACACTGCCTGT-3ʹ and MUR_r 5ʹ-GCCACCTGCGCCAGCA-3ʹ for M. intestinale. Universal 16S rRNA levels were also measured using primers 1047F (5ʹ-GTGSTGCAYGGYTGTCGTCA-3ʹ) and 1174R (5ʹ-ACGTCRTCCMCACCTTCCTC-3ʹ).Citation70 The thermal cycling conditions used were as follows: denaturation at 95°C for 20 s; 40 amplification cycles of denaturation at 95°C for 3 s and annealing at 60°C for 30 s; followed by a single dissociation stage consisting of denaturation at 95°C for 15 s followed by incubation at 60°C with the temperature increased from 60°C to 95°C at 0.1°C/s. For each sample, ∆Ct is the difference between the Ct value when menA was detected and the Ct of universal bacteria. The average ∆Ct of uninfected mice on 2 mg folate/kg diet (2CTL) was used as the control group, and the ∆∆Ct was the difference between each sample’s ∆Ct and the average ∆Ct of 2CTL mice.
Statistical analysis
Statistical analyses distinct from statistical analysis of the microbiome were performed using GraphPad Prism Versions 6.01 and 8.02. Sample distributions were evaluated and statistical analyses were performed using non-parametric Mann–Whitney tests comparing group means for gastric pathology and cytokine evaluation. MK values were converted to relative abundances using the fraction of total analysis in GraphPad. The relative contribution of each MK between groups (CTL, HPno, and HPab) was compared using one-way ANOVA and analyzed using Sidak’s multiple comparisons test. Statistical significance for all analyses was designated as a p-value <0.05. For menA qPCR results, statistical significance between ∆∆Ct values of the treatment groups was computed using the Kruskal–Wallis test followed by a posthoc Dunn’s test.
Abbreviations
| AAD | = | Amino Acid Defined, or chemically defined, diet |
| CRC | = | Colorectal cancer |
| CTL | = | Uninfected mice on the AAD diet without antibiotics |
| GI | = | Gastrointestinal |
| Hb | = | Hemoglobin |
| HCT | = | Hematocrit |
| HP or H. pylori | = | Helicobacter pylori |
| HPab | = | H. pylori infected mice on the AAD diet treated with antibiotics |
| HPno | = | H. pylori infected mice on the AAD diet without antibiotics |
| LDA | = | Linear Discriminant Analysis |
| LEfSe | = | Linear discriminant analysis Effect Size |
| MCHC | = | Mean corpuscular hemoglobin concentration |
| MD | = | Menadione or Vitamin K3 |
| MKn | = | Menaquinone or Vitamin K2. “n” represents the number of isoprenyl units attached to the menaquinone side chain |
| OUT | = | Operational Taxonomic Unit |
| PCA | = | Principal Component Analysis |
| PCoA | = | Principal Coordinate Analysis |
| PICRUSt | = | Phylogenetic Investigation of Communities by Reconstruction of Unobserved States |
| PK | = | Phylloquinone or Vitamin K1 |
| PLSDA | = | Partial least squares discriminant analysis |
| POST-PK | = | End of study time point after treatment with phylloquinone |
| PRE-PKq | = | Time point prior to phylloquinone treatment |
| PT | = | Prothrombin time |
| PTT | = | Partial thromboplastin time |
| RBC | = | Red blood cells |
| SEM | = | Standard error of the mean |
| WBC | = | White blood cells |
| WPI | = | Weeks post infection |
Disclosure of Potential Conflicts of Interest
No potential conflicts of interest were disclosed.
Ethics approval
All of the experiments were discussed and approved by the MIT Committee on Animal Care.
Availability of data and material
The sequencing data used in this article are available in the NCBI repository under BioProject PRJNA534120: Fecal Microbiome of Vitamin K deficient INS-GAS treated with antibiotics.
Authors’ contributions
LQ, AS, HH conceived the study, performed laboratory assays, analyzed the data and wrote the manuscript. JLE, XF performed laboratory assays. DP, LQ, HH collected samples. SM, ZG, JLE, XF, DS, SLB, JGF analyzed the data and contributed resources. TCW, TAG, JGF conceived the study and contributed resources. All authors edited the manuscript and approved the final draft.
Supplemental Material
Download Zip (26.5 MB)Acknowledgments
The authors would like to thank Dr. Sebastian Carrasco for help with editing and reviewing the manuscript.
Supplementary material
Supplemental data for this article can be accessed on the publisher’s website.
Additional information
Funding
References
- Wroblewski LE, Peek RM, Wilson KT. Helicobacter pylori and gastric cancer: factors that modulate disease risk. Clin Microbiol Rev. 2010;23:713–739. doi:10.1128/CMR.00011-10.
- Burucoa C, Axon A. Epidemiology of Helicobacter pylori infection. Helicobacter. 2017;22(Suppl 1):e12403. doi:10.1111/hel.12403.
- Hooi JKY, Lai WY, Ng WK, Suen MMY, Underwood FE, Tanyingoh D, Malfertheiner P, Graham DY, Wong VWS, Wu JCY, et al. Global prevalence of helicobacter pylori infection: systematic review and meta-analysis. Gastroenterology. 2017;153(2):420–429. doi:10.1053/j.gastro.2017.04.022.
- Ito M, Haruma K, Kamada T, Mihara M, Kim S, Kitadai Y, Sumii M, Tanaka S, Yoshihara M, Chayama K, et al. Helicobacter pylori eradication therapy improves atrophic gastritis and intestinal metaplasia: A 5-year prospective study of patients with atrophic gastritis. Aliment Pharmacol Ther. 2002;16(8):1449–1456. doi:10.1046/j.1365-2036.2002.01311.x.
- Seta T, Takahashi Y, Noguchi Y, Shikata S, Sakai T, Sakai K, Yamashita Y, Nakayama T. Effectiveness of Helicobacter pylori eradication in the prevention of primary gastric cancer in healthy asymptomatic people: a systematic review and meta-analysis comparing risk ratio with risk difference. PLoS One. 2017;12(8):1–18. doi:10.1371/journal.pone.0183321.
- Alba C, Blanco A, Alarcon T. Antibiotic resistance in Helicobacter pylori. Curr Opin Infect Dis. 2017;30(5):489–497. doi:10.1097/QCO.0000000000000396.
- Savoldi A, Carrara E, Graham DY, Conti M, Tacconelli E. Prevalence of antibiotic resistance in helicobacter pylori: a systematic review and meta-analysis in World Health Organization regions. Gastroenterology. 2018;155(5):1372–1382.e17. doi:10.1053/j.gastro.2018.07.007.
- Venneman K, Huybrechts I, Gunter MJ, Vandendaele L, Herrero R, Van Herck K. The epidemiology of Helicobacter pylori infection in Europe and the impact of lifestyle on its natural evolution toward stomach cancer after infection: A systematic review. Helicobacter. 2018;23(3):e12483. doi:10.1111/hel.12483.
- Thung I, Aramin H, Vavinskaya V, Gupta S, Park JY, Crowe SE, Valasek MA. Review article: the global emergence of Helicobacter pylori antibiotic resistance. Aliment Pharmacol Ther. 2016;43(4):514–533. doi:10.1111/apt.13497.
- Duthie SJ. Folate and cancer: how DNA damage, repair and methylation impact on colon carcinogenesis. J Inherit Metab Dis. 2011;34(1):101–109. doi:10.1007/s10545-010-9128-0.
- Kim YI. Folate and DNA methylation: a mechanistic link between folate deficiency and colorectal cancer? Cancer Epidemiol Biomarkers Prev. 2004;13(4):511–519. doi:10.1158/1055-9965.epi-07-2557.
- Van GB, Hultdin J, Johansson I, Hallmans G, Stenling R, Riboli E, Winkvist A, Palmqvist R. Low folate levels may protect against colorectal cancer. Gut. 2006;1461–1466. doi:10.1136/gut.2005.085480.
- Cole BF, Baron JA, Sandler RS, Haile RW, Ahnen DJ, Bresalier RS, McKeown-Eyssen G, Summers RW, Rothstein RI, Burke CA, et al. Folic acid for the prevention of colorectal adenomas: a randomized clinical trial. JAMA. 2007;297(21):2351–2359. doi:10.1001/jama.297.21.2351.
- Ding H, Gao Q, Chen H. People with low serum folate levels have higher risk of colorectal adenoma/advanced colorectal adenoma occurrence and recurrence in China. J Int Med Res. 2016;44:767–778. doi:10.1177/0300060516650075.
- Fox JG, Wang TC, Rogers AB, Poutahidis T, Ge Z, Taylor N, Dangler CA, Israel DA, Krishna U, Gaus K, et al. Host and microbial constituents influence Helicobacter pylori-induced cancer in a murine model of hypergastrinemia. Gastroenterology. 2003;124(7):1879–1890. doi:10.1016/S0016-5085(03)00406-2.
- Wang TC, Dangler CA, Chen D, Goldenring JR, Koh T, Raychowdhury R, Coffey RJ, Ito S, Varro A, Dockray GJ, et al. Synergistic interaction between hypergastrinemia and Helicobacter infection in a mouse model of gastric cancer. Gastroenterology. 2000;118(1):36–47. doi:10.1016/S0016-5085(00)70412-4.
- Lee C, Rickman B, Rogers AB, Ge Z, Wang TC, Fox JG. Helicobacter pylori eradication prevents progression of gastric cancer in hypergastrinemic INS-GAS mice helicobacter pylori eradication prevents progression of gastric cancer in hypergastrinemic INS-GAS mice. Cancer Res. 2008;68(20):3540–3548. doi:10.1158/0008-5472.CAN-07-6786.
- Gonda TA, Kim YI, Salas MC, Gamble MV, Shibata W, Muthupalani S, Sohn K, Abrams JA, Fox JG, Wang TC, et al. Folic acid increases global DNA methylation and reduces inflammation to prevent helicobacter-associated gastric cancer in mice. Gastroenterology. 2012;142:4. doi:10.1053/j.gastro.2011.12.058.
- Collins MD, Jones D. Distribution of isoprenoid quinone structural types in bacteria and their taxonomic implication. Microbiol Rev. 1981; 45(2):316–354. [[accessed 2018 July 31]]. http://www.ncbi.nlm.nih.gov/pubmed/7022156.
- Walther B, Karl JP, Booth SL, Boyaval P. Menaquinones, bacteria, and the food supply: the relevance of dairy and fermented food products to vitamin K requirements. Adv Nutr. 2013;4(4):463–473. doi:10.3945/an.113.003855.
- RH BARNES, FIALA G. Effects of the prevention of coprophagy in the rat. J Nutr. 1959;68(4):603–614. doi:10.1093/jn/68.4.603.
- Ebino KY. Studies on coprophagy in experimental animals. Jikken Dobutsu. 1993;42(1):1–9. doi:10.1538/expanim1978.42.1_1.
- Frohlich EE, Farzi A, Mayerhofer R, Reichmann F, Jačan A, Wagner B, Zinser E, Bordag N, Magnes C, Fröhlich E, et al. Cognitive impairment by antibiotic-induced gut dysbiosis: analysis of gut microbiota-brain communication. Brain Behav Immun. 2016;56:140–155. doi:10.1016/j.bbi.2016.02.020.
- Sonoda A, Kamiyama N, Ozaka S, Gendo Y, Ozaki T, Hirose H, Noguchi K, Saechue B, Sachi N, Sakai K, et al. Oral administration of antibiotics results in fecal occult bleeding due to metabolic disorders and defective proliferation of the gut epithelial cell in mice. Genes Cells. 2018;23(12):1043–1055. doi:10.1111/gtc.12649.
- Ettinger SJECF. Textbook of veterinary internal medicine. 5thed. Philadelphia (Pennsylvania): W.B. Saunders Company; 2000.
- Woody BJ, Murphy MJ, Ray AC, Green RA. Coagulopathic effects and therapy of brodifacoum toxicosis in dogs. J Vet Intern Med. 1992;6(1):23–28. doi:10.1111/j.1939-1676.1992.tb00981.x.
- Fu X, Booth SL, Smith DE. Vitamin K contents of rodent diets: a review. J Am Assoc Lab Anim Sci. 2007;46:8–12.
- Mathers JC, Fernandez F, Hill MJ, McCarthy PT, Shearer MJ, Oxley A. Dietary modification of potential vitamin K supply from enteric bacterial menaquinones in rats. Br J Nutr. 1990;63(3):639–652. doi:10.1079/BJN19900150.
- Karl JP, Fu X, Wang X, Zhao Y, Shen J, Zhang C, Wolfe BE, Saltzman E, Zhao L, Booth SL, et al. Fecal menaquinone profiles of overweight adults are associated with gut microbiota composition during a gut microbiota–targeted dietary intervention. Am J Clin Nutr. 2015;102(1):84–93. doi:10.3945/ajcn.115.109496.
- Ormerod KL, Wood DLA, Lachner N, Gellatly SL, Daly JN, Parsons JD, Dal’Molin CGO, Palfreyman RW, Nielsen LK, Cooper MA, et al. Genomic characterization of the uncultured Bacteroidales family S24-7 inhabiting the guts of homeothermic animals. Microbiome. 2016;4(1):36. doi:10.1186/s40168-016-0181-2.
- Kennedy DA, Stern SJ, Moretti M, Matok I, Sarkar M, Nickel C, Koren G. Folate intake and the risk of colorectal cancer: a systematic review and meta-analysis. Cancer Epidemiol. 2011;35(1):2–10. doi:10.1016/j.canep.2010.11.004.
- Sanjoaquin MA, Allen N, Couto E, Roddam AW, Key TJ. Folate intake and colorectal cancer risk: a meta-analytical approach. Int J Cancer. 2005;113(5):825–828. doi:10.1002/ijc.20648.
- Lee JE, Wei EK, Fuchs CS, Hunter DJ, Lee I-M, Selhub J, Stampfer MJ, Willett WC, Ma J, Giovannucci E, et al. Plasma folate, methylenetetrahydrofolate reductase (MTHFR), and colorectal cancer risk in three large nested case-control studies. Cancer Causes Control. 2012;23(4):537–545. doi:10.1007/s10552-012-9911-3.
- Mason JB, Dickstein A, Jacques PF, Haggarty P, Selhub J, Dallal G, Rosenberg IH. A temporal association between folic acid fortification and an increase in colorectal cancer rates may be illuminating important biological principles: a hypothesis. Cancer Epidemiol Biomarkers Prev. 2007;16(7):1325–1329. doi:10.1158/1055-9965.EPI-07-0329.
- Gao Q-Y, Chen H-M, Chen Y-X, Wang Y-C, Wang Z-H, Tang J-T, Ge -Z-Z, Chen X-Y, Sheng J-Q, Fang D-C, et al. Folic acid prevents the initial occurrence of sporadic colorectal adenoma in Chinese older than 50 years of age: a randomized clinical trial. Cancer Prev Res (Phila). 2013;6(7):744–752. doi:10.1158/1940-6207.CAPR-13-0013.
- Beulens JWJ, Booth SL, EGHM VDH, Stoecklin E, Baka A, Vermeer C. The role of menaquinones (vitamin K2) in human health. Br J Nutr. 2013;110(08):1357–1368. doi:10.1017/S0007114513001013.
- Reeves PG, Nielsen FH, Fahey GCJ. AIN-93 purified diets for laboratory rodents: final report of the American Institute of Nutrition ad hoc writing committee on the reformulation of the AIN-76A rodent diet. J Nutr. 1993;123(11):1939–1951. doi:10.1093/jn/123.11.1939.
- Lemos LMS, Miyajima F, Castilho GRC, Martins DTO, Pritchard DM, Burkitt MD. Hexane extracts of calophyllum brasiliense inhibit the development of gastric preneoplasia in helicobacter felis infected INS-gas mice. Front Pharmacol. 2017;8:92. doi:10.3389/fphar.2017.00092.
- Fox JG, Rogers AB, Ihrig M, Taylor NS, Whary MT, Dockray G, Varro A, Wang TC. Helicobacter pylori-associated gastric cancer in INS-GAS mice is gender specific. Cancer Res. 2003;63:942–950.
- Thomson MJ, Pritchard DM, Boxall SA, Abuderman AA, Williams JM, Varro A, Crabtree JE. Gastric helicobacter infection induces iron deficiency in the INS-GAS mouse. PLoS One. 2012;7:11. doi:10.1371/journal.pone.0050194.
- Ge Z, Sheh A, Feng Y, Muthupalani S, Ge L, Wang C, Kurnick S, Mannion A, Whary MT, Fox JG, et al. Helicobacter pylori-infected C57BL/6 mice with different gastrointestinal microbiota have contrasting gastric pathology, microbial and host immune responses. Sci Rep. 2018;8(1):1–15. doi:10.1038/s41598-018-25927-2.
- Yang I, Eibach D, Kops F, Brenneke B, Woltemate S, Schulze J, Bleich A, Gruber AD, Muthupalani S, Fox JG, et al. Intestinal microbiota composition of interleukin-10 deficient C57BL/6J mice and susceptibility to helicobacter hepaticus-induced colitis. PLoS One. 2013;8(8):e70783. Heimesaat MM, ed. doi:10.1371/journal.pone.0070783.
- Binkley NC, Suttie JW. Vitamin K nutrition and osteoporosis. J Nutr. 1995;125(7):1812–1821. doi:10.1093/jn/125.7.1812.
- Conly J, Stein K. Reduction of vitamin K2 concentrations in human liver associated with the use of broad spectrum antimicrobials. Clin Invest Med. 1994;17:531–539.
- Brown RB, Klar J, Lemeshow S, Teres D, Pastides H, Sands M. Enhanced bleeding with cefoxitin or moxalactam. Statistical analysis within a defined population of 1493 patients. Arch Intern Med. 1986;146(11):2159–2164. doi:10.1001/archinte.1986.00360230079013.
- Uchida K, Matsubara T. Effect of flomoxef on blood coagulation and alcohol metabolism. Infection. 1991;19(Suppl 5):S284–95. doi:10.1007/BF01645541.
- Kindberg C, Suttie JW, Uchida K, Hirauchi K, Nakao H. Menaquinone production and utilization in germ-free rats after inoculation with specific organisms. J Nutr. 1987;117(6):1032–1035. doi:10.1093/jn/117.6.1032.
- Gustafsson BE, Daft FS, Mcdaniel EG, Smith JC, Fitzgerald RJ. Effects of vitamin K-active compounds and intestinal microorganisms in vitamin K-deficient germfree rats. J Nutr. 1962;78(4):461–468. doi:10.1093/jn/78.4.461.
- Akiyama Y, Hara K, Matsumoto A, Takahashi S, Tajima T. Comparison of intestinal absorption of vitamin K2 (menaquinone) homologues and their effects on blood coagulation in rats with hypoprothrombinaemia. Biochem Pharmacol. 1995;49(12):1801–1807. doi:10.1016/0006-2952(94)00531-P.
- Young IG. Biosynthesis of bacterial menaquinones. Menaquinone mutants of Escherichia coli. Biochemistry. 1975;14(2):399–406. doi:10.1021/bi00673a029.
- Uchida K, Nomura Y, Takase H, Harauchi T, Yoshizaki T, Nakao H. Effects of vitamin K-deficient diets and fasting on blood coagulation factors in conventional and germ-free rats. Jpn J Pharmacol. 1986;40(1):115–122. doi:10.1254/jjp.40.115.
- Kageyama A, Benno Y, Nakase T. Phylogenetic evidence for the transfer of Eubacterium lentum to the genus Eggerthella as Eggerthella lenta gen. nov., comb. nov. Int J Syst Bacteriol. 1999;49(Pt 4):1725–1732. doi:10.1099/00207713-49-4-1725.
- Yamamoto T, Matsui H, Yamaji K, Takahashi T, Øverby A, Nakamura M, Matsumoto A, Nonaka K, Sunazuka T, Ōmura S, et al. Narrow-spectrum inhibitors targeting an alternative menaquinone biosynthetic pathway of Helicobacter pylori. J Infect Chemother Off J Japan Soc Chemother. 2016;22(9):587–592. doi:10.1016/j.jiac.2016.05.012.
- Rogers AB, Taylor NS, Whary MT, Stefanich ED, Wang TC, Fox JG. Helicobacter pylori but not high salt induces gastric intraepithelial neoplasia in B6129 mice. Cancer Res. 2005;(23):10709–10716. doi:10.1158/0008-5472.CAN-05-1846.
- Lertpiriyapong K, Whary MT, Muthupalani S, Lofgren JL, Gamazon ER, Feng Y, Ge Z, Wang TC, Fox JG. NIH public access. Gut. 2014;63(1):54–63. doi:10.1136/gutjnl-2013-305178.Gastric.
- Maurer KJ, Rogers AB, Ge Z, Wiese AJ, Carey MC, Fox JG. Helicobacter pylori and cholesterol gallstone formation in C57L/J mice: a prospective study. Am J Physiol Gastrointest Liver Physiol. 2006;290(1):G175–82. doi:10.1152/ajpgi.00272.2005.
- Davidson KW, Sadowski JA. Determination of vitamin K compounds in plasma or serum by high-performance liquid chromatography using postcolumn chemical reduction and fluorimetric detection. Methods Enzymol. 1997;282:408–421.
- Karl JP, Fu X, Dolnikowski GG, Saltzman E, Booth SL. Quantification of phylloquinone and menaquinones in feces, serum, and food by high-performance liquid chromatography-mass spectrometry. J Chromatogr B Anal Technol Biomed Life Sci. 2014;963:128–133. doi:10.1016/j.jchromb.2014.05.056.
- Comeau AM, Douglas GM, Langille MGI. Microbiome helper: a custom and streamlined workflow for microbiome research. mSystems. 2017;2(1):e00127–16. doi:10.1128/mSystems.00127-16.
- Zhang J, Kobert K, Flouri T, Stamatakis A. PEAR: a fast and accurate illumina paired-end reAd mergeR. Bioinformatics. 2014;30(5):614–620. doi:10.1093/bioinformatics/btt593.
- Caporaso JG, Kuczynski J, Stombaugh J, Bittinger K, Bushman FD, Costello EK, Fierer N, Peña AG, Goodrich JK, Gordon JI, et al. QIIME allows analysis of high-throughput community sequencing data. Nat Methods. 2010;7(5):33–56. doi:10.1038/nmeth.f.303.
- Langille MGI, Zaneveld J, Caporaso JG, McDonald D, Knights D, Reyes JA, Clemente JC, Burkepile DE, Vega Thurber RL, Knight R, et al. Predictive functional profiling of microbial communities using 16S rRNA marker gene sequences. Nat Biotechnol. 2013;31(9):814–821. doi:10.1038/nbt.2676.
- Hamady M, Knight R. Microbial community profiling for human microbiome projects: tools, techniques, and challenges. Genome Res. 2009;19(7):1141–1152. doi:10.1101/gr.085464.108.
- Kuczynski J, Liu Z, Lozupone C, McDonald D, Fierer N, Knight R. microbial community resemblance methods differ in their ability to detect biologically relevant patterns. Nat Methods. 2010;7:10. doi:10.1038/nMeth.1499.
- Lozupone C, Hamady M, Knight R. UniFrac–an online tool for comparing microbial community diversity in a phylogenetic context. BMC Bioinformatics. 2006;7(1):371. doi:10.1186/1471-2105-7-371.
- Wickham H. ggplot2: elegant graphics for data analysis. 2nd ed. New York: Springer; 2009. doi:10.1007/978-0-387-98141-3.
- Warnes GR, Bolker B, Lumley T. gtools: various R programming tools. R package version 3.5.0; 2015. http://CRAN.R-project.org/package=gtools
- Segata N, Izard J, Waldron L, Gevers D, Miropolsky L, Garrett WS, Huttenhower C. Metagenomic biomarker discovery and explanation. Genome Biol. 2011;12(6):R60. doi:10.1186/gb-2011-12-6-r60.
- Parks DH, Tyson GW, Hugenholtz P, Beiko RG. STAMP: statistical analysis of taxonomic and functional profiles. Bioinformatics. 2014;30(21):3123–3124. doi:10.1093/bioinformatics/btu494.
- Maeda H, Fujimoto C, Haruki Y, Maeda T, Kokeguchi S, Petelin M, Arai H, Tanimoto I, Nishimura F, Takashiba S, et al. Quantitative real-time PCR using TaqMan and SYBR Green for Actinobacillus actinomycetemcomitans, Porphyromonas gingivalis, Prevotella intermedia, tetQ gene and total bacteria. FEMS Immunol Med Microbiol. 2003;39(1):81–86. doi:10.1016/S0928-8244(03)00224-4.