
ABSTRACT
Nutrition during pregnancy plays an important role in maternal–neonatal health. However, the impact of specific dietary components during pregnancy on maternal gut microbiota and the potential effects on neonatal microbiota and infant health outcomes in the short term are still limited. A total of 86 mother–neonate pairs were enrolled in this study. Gut microbiota profiling on maternal–neonatal stool samples at birth was carried out by 16S rRNA gene sequencing using Illumina. Maternal dietary information and maternal–neonatal clinical and anthropometric data were recorded during the first 18 months. Longitudinal Body Mass Index (BMI) and Weight-For-Length (WFL) z-score trajectories using the World Health Organization (WHO) curves were obtained. The maternal microbiota was grouped into two distinct microbial clusters characterized by Prevotella (Cluster I) and by the Ruminococcus genus (Cluster II). Higher intakes of total dietary fiber, omega-3 fatty acids, and polyphenols were observed in Cluster II compared to Cluster I. Higher intakes of plant-derived components were associated with a higher presence of the Christensellaceae family, Dehalobacterium and Eubacterium, and lower amounts of the Dialister and Campylobacter species. Maternal microbial clusters were also linked to neonatal microbiota and infant growth in a birth-dependent manner. C-section neonates from Cluster I showed the highest BMI z-score at age 18 months, along with a higher risk of overweight. Longitudinal BMI and WL z-score trajectories from birth to 18 months were shaped by maternal microbial cluster, diet, and birth mode. Diet was an important perinatal factor in early life that may impact maternal microbiota; in particular, fiber, lipids and proteins, and exert a significant effect on the neonatal microbiome and contribute to infant development during the first months of life.
Abbreviations
NCDs: Non-Communicable Diseases, C-section: Cesarean Section, BMI: Body Mass Index; WL: Weight for length; EPA: Eicosapentanoic Acid; DHA: Docosahexaenoic Acid; DPA: Docosapentaenoic Acid; SCFA: Short Chain Fatty Acids; MD: Mediterranean Diet; FFQ: Food Frequency Questionnaire; CHI: Calinski Harabasz Index
Introduction
The first 1,000 days of life comprise a sensitive, critical period in which nutrition has a pivotal impact,Citation1,Citation2 influencing the risk of non-communicable diseases (NCDs) such as metabolic disorders, cardiovascular diseases, allergies and obesity.Citation3 Maternal nutrition during this period is considered crucial for supporting health status and promoting adequate neonatal growth and development,Citation4,Citation5 as the diet is one of the most powerful factors driving the microbiota. Recent studies have highlighted the impact of maternal diet on maternal microbiota; most of these studies focused on maternal obesity and gestational diabetes (GDM).Citation6-Citation10 In addition, some studies have reported the effects of maternal diet on the offspring’s microbiota.Citation11 Despite the evidence of the effects of maternal diet on the microbiome, little is known about the potential effects on the infant’s health outcomes. It is well known that the maternal microbiota represents the most important microbial source for the development of the neonatal microbiota. Shifts in infant microbiota development have been linked to alterations at the immunological and metabolic levels, leading to an increased risk of NCDs.Citation12,Citation13 Early exposure to antibiotic use, unbalanced diets, and the increased ratios of C-section deliveries could disrupt this adequate early infant colonization, which have been linked to the risk of childhood obesity.Citation14,Citation15 Maternal overweight and obesity have an impact on the infant microbiota and can influence the risk of obesity later in life.Citation16-Citation18
In this scenario, the relevance of maternal dietary patterns and the role of specific nutritional compounds on the gut microbiota during pregnancy has not been fully understood. Moreover, little is known about its influence on infant health outcomes in the short and long term. Thus, the aim of this study is to assess whether maternal gut microbiota is shaped by diet and specific nutritional components during pregnancy and to evaluate the potential impact on infant development during the first 18 months of life.
Results
Maternal microbial clusters at birth and clinical data
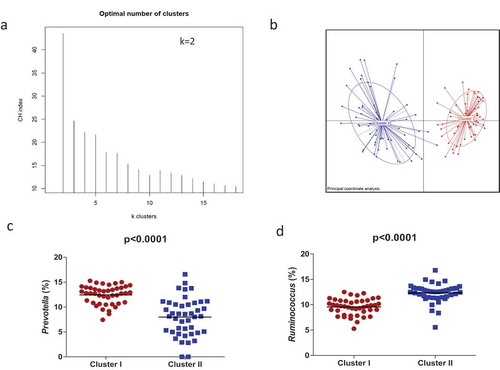
Microbial relative abundance-based clustering using Jensen Shannon distances revealed two clusters of maternal gut microbiota at birth (). The clustering was validated using the Calinski Harabasz Index (CHI) and prediction strength, which uses a cross-validation approach to validate the robustness of clustering.
Figure 1. Maternal gut microbial clusters and representative genus. The PAM method shows that participants are separated into two clusters (a) and Principal Component Analysis (PCA) showed the two differential clusters (b); the relative abundances (%) of the representative bacterial genus in each cluster are represented, Prevotella in Cluster I (red circles) (c) and Ruminococcus in Cluster II (blue squares) (d). The middle line represents the media of all values.
From a total number of 116 mother–infant dyads, we excluded the pairs lacking biological infant samples and/or clinical data as well as maternal and infant data. Then a total of 86 mother–infant pairs were analyzed based on the matched biological samples as well as dietary information and clinical data availability up to 18 months of life.
No significant differences in maternal clinical and anthropometric data were found between the maternal microbiota clusters (). The prevalence of C-section as well as the administration of antibiotics due to the mode of delivery was significantly higher for Cluster I than for Cluster II. Cluster II presented higher rates of exclusive breastfeeding. Neonates belonging to Cluster II presented significantly lower BMI and WFL z-scores at birth, 1 month, and 18 months of age.
Table 1. Characteristics of mothers-neonates.
Maternal microbial cluster composition and diversity
Microbial structure between maternal microbial clusters was also confirmed by principal coordinates analysis (PCoA) with Bray–Curtis dissimilarity matrices (PERMANOVA R2 = 0.188, p < .001) (). A redundancy analysis (RDA) was also consistent with a clear differentiation in the microbiota composition between clusters (variance = 31.74, F = 4.95 p = .001) ().
Figure 2. Maternal microbial clusters characteristics and alfa and beta diversity. Principal Coordinate Analysis (PCoA) with Bray–Curtis index (a) and Multivariate RDA (b) showed significant differences in microbial communities between clusters. Linear Discriminant Analysis (LDA) Effect Size (LEfSe) plot of taxonomic biomarkers was identified in both clusters. Cluster I (red color) and Cluster II (blue color). (c) and microbial diversity and richness indexes at species level according to each cluster (D, E, F). Mean ±SD and p-values with T-test. Cluster I = red circles and Cluster II = blue squares.
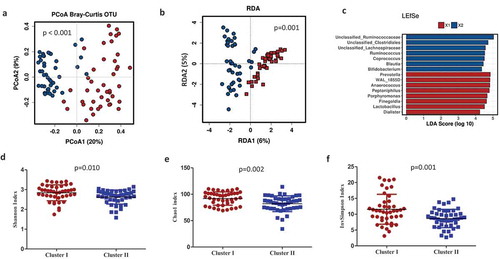
Specifically, the maternal gut microbial in Cluster I was enriched by the genus Prevotella (p < .0001), followed by Peptoniphilus, Anaerococcus, and Porphyromonas; Cluster II was enriched by Ruminococcus (p < .0001) and an unclassified genus from the Ruminococcaceae family (p < .001), followed by the unclassified genus Clostridiales (p < .001), an unclassified genus from the Lachnospiraceae family (p < .001), Bacteroides (p < .001), Blautia (p < .001), and Bifidobacterium (p < .001). To further investigate the association of specific microbial taxa with maternal microbiota clusters, a linear discriminant analysis of effect size (LEfSe) was performed. The prevalence of the Ruminococcus as well as unclassified Ruminococcaceae, Clostridiales, and Lachnospiraceae reliably identified Cluster II. In addition, the prevalence of Prevotella and WAL_1855D (order Clostridiales), Anaerococcus, Peptoniphilus, and the Finegoldia genus were linked to Cluster I (). Microbiota alpha-diversity values, measured by Shannon, Chao1 and inverse Simpson indexes, also showed significant differences according to clustering stratification (p < .05). Higher significant microbial diversity and richness were observed in maternal gut microbiota in Cluster I than those observed in Cluster II (–).
Maternal microbial clusters are linked to specific dietary compounds
The maternal intakes of the major dietary nutrients were significantly different between microbial clusters (). A significantly higher intake of total and insoluble dietary fiber (attributable to insoluble pectin), higher intakes of omega-3 fatty acids (mainly of docosahexaenoic acid [DHA] and docosapentaenoic acid [DPA], and polyphenols were observed in mothers from Cluster II compared to Cluster I.
Furthermore, a PERMANOVA test for dietary factors contributing to overall differences in maternal microbiota composition showed that the main contributors were polyunsaturated fatty acids (PUFA (R2 = 0.044, p = .010), animal protein (R2 = 0.036, p = .022), and total fiber (R2 = 0.036, p = .023); no relevance was found for lipids, monounsaturated fatty acids (MUFA), saturated fatty acids (SFA), carbohydrates (CHO), total protein, and vegetable protein. A principal component analysis (PCA) biplot showed that maternal microbiota clusters were associated with a specific microbial genus () and nutrients (). Cluster I was associated with CHO, SFA, and proteins (mostly animal protein), and to Prevotella, Peptoniphilus, Finegoldia, and Anaerococcus, while Cluster II was associated with dietary fiber, vegetable protein, polyphenols, and lipids (mainly, the n-3 fatty acids DHA and DPA) as well as Ruminococcus and unclassified Ruminococcaceae.
Figure 3. Maternal diet shapes the microbial clusters. Biplots from the principal component analysis (PCA) showed that maternal microbiota clusters were associated with specific microbial genus (a) and nutrients (b). Cluster I = red squares and Cluster II = blue circles. Pearson correlations between nutrient intake during pregnancy and bacterial abundance at the genus level at delivery (c). Association of dietary components with the most abundant bacterial group of each cluster. Significant correlations (p < .05) were marked by an asterisk (*). Blue squares marked the negative correlations, whereas the red color showed positive correlations as measured by Pearson’s correlations.
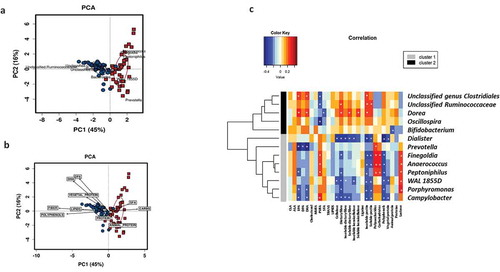
Specific associations between different nutrient intakes and the most predominant gut bacteria at the genus level were found (). We observed a strong positive association of bacterial groups representative of Cluster II with omega-3 fatty acids such as EPA, DHA, and DPA and several dietary fibers. Moreover, we also demonstrated significant correlations between all these analyzed nutrients and other specific gut bacteria that appeared in lower relative abundances. A significant pattern was detected that associated the consumption of nutrients present in foods of plant-based origin, such as vegetable proteins, dietary fiber, and polyphenols with members of the family Christensenellaceae, Dehalobacterium, and Eubacterium and negatively with bacterial groups such as Campylobacter and Dialister.
Maternal microbial clusters are linked to neonatal microbiota at birth
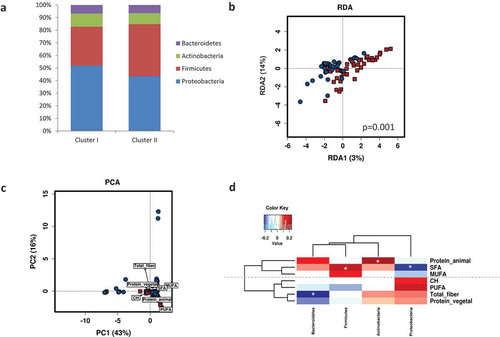
Neonatal microbiota composition at birth was shaped by maternal microbial clusters (PERMANOVA, R2 = 0.035, p = .005). A higher relative abundance of Firmicutes was observed in Cluster I compared to Cluster II (p = .060) (). A multivariate analysis (RDA) at the genus level also showed distinct neonatal microbial communities at birth shaped significantly by the maternal microbial cluster (F = 2.21, p = .001) (). No differences were found in neonatal alpha-diversity indexes (Shannon, Chao1, and Inverse Simpson indexes) according to maternal clusters. Further, a PERMANOVA model test (Bray-Curtis matrix, p = .050) for dietary factors contributing to overall differences in neonatal microbiota composition showed that the main contributors were PUFA (R2 = 0.028, p = .020) and animal protein (R2 = 0.030, p = .015). A PCA biplot showed that maternal microbiota clusters were linked to neonatal microbiota, explaining the first two principal components (PC1 and PC2) a 59% of the total variance (). Cluster I was associated with PUFA and animal protein, while Cluster II was associated with fiber and vegetable protein. Furthermore, specific maternal nutrients were associated with neonatal microbiota (). Higher maternal intake of SFA was significantly associated with lower Proteobacteria and higher Firmicutes, while higher maternal intake of fiber and vegetable protein were associated with lower Bacteroidetes phylum in neonatal gut microbiota.
Figure 4. Maternal gut microbial clusters and diet drive the neonatal first pass microbiota. Relative abundances (%) of the neonatal microbial at the phylum level stratified by maternal microbial cluster (a). Multivariate RDA showed significant differences in neonatal microbial communities depending on maternal microbial clusters (b). Biplots from the principal component analysis (PCA) showed that neonatal microbiota is shaped by maternal microbiota clusters and they are associated with specific nutrients (c). Pearson correlations between maternal intake of nutrients during pregnancy and neonatal first pass bacterial relative abundance at phylum level at birth (d). Significant correlations (p < .05) were marked by an asterisk (*). Blue squares marked the negative correlations, whereas red showed positive correlations as measured by Pearson’s correlations.
Maternal microbial clusters are linked to infant growth development and risk of overweight
Maternal microbial clusters had a significant impact on the BMI z-scores during the first 18 months (). Higher BMI z-scores and WFL z-scores were observed in Cluster I compared to Cluster II. Infants from maternal Cluster I and born by C-section showed significantly higher BMI and WFL z-scores at 18 months than those observed in infants from vaginal births from mothers classified in Cluster II (). Furthermore, in stratifying the infants by BMI-for-age z-score cut-points of >1.0 as being at risk of overweight, we found that 52.4% (11/21) of C-section neonates from maternal Cluster I were at risk compared to 0% (0/5) in neonates from maternal Cluster II (Fisher test p = .052 two-tailed and p = .045 one-tailed); no differences were found in vaginal-born neonates. Additionally, a multivariate linear model analysis, adjusted by mode of delivery, antibiotic exposure, pregestational maternal BMI, and feeding method, demonstrated that neonates belonging to maternal Cluster I presented a significantly higher BMI z-score at 1 month of life (p = .020) and later at 18 months of life (p = .040).
Figure 5. Maternal gut microbial clusters and mode of birth impact the infant risk of overweight and obesity. BMI z-scores(a) and WL (b) z-scores at 18 months of age adjusted by covariates according to mode of birth and maternal microbial cluster (Cluster I = red and Cluster II = blue color). The middle line represents the media of all values; a general linear model multivariate ANOVA test adjusted by factors and covariates was done and p < .05 was considered significant. **p < .05; ***p < .001; p < .0001. Infant BMI z-score (c) and WL Z-score (d) trajectories from birth to 18 months were stratified by maternal microbial cluster and birth mode. The GLM for repeated measures adjusted for maternal cluster, pregestational BMI, mode of delivery and breastfeeding up to 6 months was done and p < .05 was considered statistically significant. Points at each time represent the media and lines mark the time series. Cluster I = red and Cluster II = blue; a continuous line = vaginal birth and a dotted line = C-section plus antibiotic. * represents a significant difference in each time point between groups.
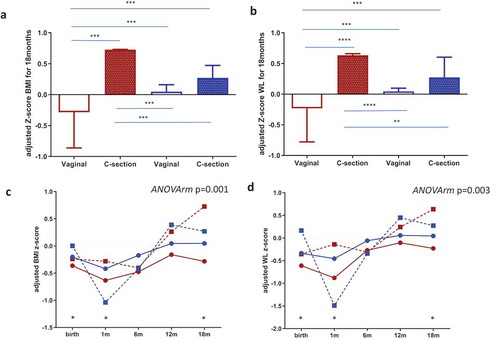
Infant longitudinal BMI and WFL z-score trajectories from birth to 18 months were shaped by maternal microbial clusters and mode of delivery (adjusted ANOVA repeated measures p = .001) showed higher BMI z-scores in children born by C-section and, remarkably, in those born from mothers stratified in Cluster I (), which was enriched in the genus Prevotella, followed by Peptoniphilus, Anaerococcus, and Porphyromonas, and was linked to lower fiber intake and n-3 fatty acids and higher intakes of animal protein and SFA (). Similar longitudinal trajectories in WL z-scores from birth to 18 months were observed ().
Discussion
Our study showed that maternal microbiota was clustered in two distinct microbial groups linked to specific dietary components during pregnancy. We reported that maternal diet modulates maternal microbiota and shapes the neonatal first pass of microbiota at birth, affecting the initial microbial establishment, with potential effects on infant development and health later in life. We observed an association between the maternal gut microbiota composition, neonatal gut microbiota, and WFL and BMI z-score at 1 and at 18 months, depending on birth type. These findings are the first step for the design of dietary strategies targeted at improving the microbial composition of the mother and therefore the newborn microbiota, thus affecting their future health status.
Maternal microbial clusters were predominantly characterized by a higher abundance of Prevotella (Cluster I) and a higher abundance of the Ruminococcus species (Cluster II), which were closely linked to diets comprising a high content of plant foods and some types of fatty acids.
Maternal microbiota Cluster I was linked to higher intakes of carbohydrates, while Cluster II tended to be associated with higher intakes of vegetable protein and fats. The role of the Prevotella genus, mainly Prevotella copri, in the response to diet and its influence on human health is still unclear. It has been reported that a dietary intervention using fiber induced an improvement in glucose; this was related to an increase in the relative abundance of Prevotella copri, which favors glycogen storage.Citation19 However, another study reported that P. copri induced insulin resistance and affected glucose intolerance.Citation20 We also found significantly higher intakes of total dietary fiber as well as insoluble dietary fiber and insoluble pectin, polyunsaturated fatty acids (EPA, DHA, and DPA), and polyphenols in mothers in Cluster II, which was characterized by enrichment of the Ruminococcus genus. The Ruminococcus species have been reported to be enriched in individuals under a diet rich in plant polysaccharides;Citation21 in addition, they are cellulolytic bacteria that utilize cellulose and hemicellulose rich in plant material.Citation22 In fact, Walker et al.Citation22 also showed that the Ruminococcus species were also strongly associated with solid particles, as insoluble dietary fibers present in the human colon compared to Bacteroides. Our data showed the presence of Faecalibacterium prausnitzii in higher relative abundance in Cluster II. Faecalibacterium prausnitzii is a well-known butyrate producer. Considered to be a biomarker of colonic health, it has been associated with anti-inflammatory properties.Citation23,Citation24
In addition to members of the Ruminococcaceae family as main players in Cluster II, we also observed a significantly higher representation of other bacterial groups, such as members of the Clostridiales genus, Lachnospiraceae family, Bacteroides, Blautia, Bifidobacterium, and Coprococcus in Cluster II with respect to Cluster I. Many of these bacterial taxa are also involved in butyrate production.Citation25 It is well known that fiber intake leads to an increase in the production of short chain fatty acids (SCFA) through microbiota. It has been reported that Lachnospira, Blautia, Coprococcus, and in the case of Bifidobacterium, through cross-feeding interactions consume plants to produce SCFA, with important benefits on human health.Citation26 However, Cluster I showed lower butyrate-producing bacteria but higher presence of oral bacteria Prevotella corporis and Prevotella nigrescens, Porphyromonas, or bacteria related to disease, such as Peptoniphilus, Campylobacter, and DialisterCitation27-Citation31
There is growing evidence linking several disorders associated with a translocation of oral bacteria in the intestinal tract.Citation32-Citation34 It has been suggested that oral bacteria present in the gut might be linked to an increased risk of disease as well as a risk of pregnancy complications.Citation3,Citation35 In addition, the presence of periodontal pathogenic bacteria at delivery can be transmitted to the neonate, promoting an aberrant early colonization pattern.Citation33,Citation34 An inverse association has been described between dietary fiber intake and the prevalence and incidence of periodontal disease in large-scale epidemiological studies.Citation36,Citation37 A recent study, which considered the impact of a dietary pattern on the oral microbiota, demonstrated significant differences in the oral microbiota composition of vegans in comparison with omnivores.Citation30
Many other works highlight the relevant effect of dietary fiber on gut microbiota composition and diversity, but less is known about the impact of fatty acids such as omega-3 PUFAs. Omega-3 PUFAs, including DHA, EPA, and DPA, are essential nutrients with potential health benefits during pregnancy and for infant development.Citation38 Omega-3 PUFAs reduce the risk of preeclampsia and pre-term birth and promote correct neurological and visual development in the neonate.Citation39,Citation40 Furthermore, omega-3 PUFAs have been shown to decrease inflammatory status, thereby having a positive effect on obesity, diabetes mellitus type-2, and several cardiovascular diseases.Citation41 Therefore, a diet rich in omega-3 is considered beneficial in several respects; however, the changes in gut microbiota composition associated with PUFAs are poorly understood. In our study, Cluster II showed significantly higher intakes of some of the main fatty acids, such as EPA, DHA, and DPA. The overrepresentation of members of the Ruminococcaceae and Lachnospiraceae families, the Blautia, Bifidobacterium, Coprococcus, and Oscillospira genera in Cluster II, and the association with omega-3 fatty acids is consistent with some previous human studies described by Costantini et al.Citation42 Moreover, in some cases, the taxa could differ from previous studies due to the type of food matrix in the diet the mother consumes during pregnancy. These differences in the type of PUFA administration could drive these differential changes in the gut microbiota composition. Furthermore, some phenolic compounds present antimicrobial properties with a potential bacteriostatic or bactericidal role, whereas others, such as flavanols, ellagitannins, or quercetin, promote the growth of beneficial bacterial groups belonging to the Lactobacillus, Bifidobacterium, and Blautia coccoides-Eubacterium rectale groups. Interestingly, bacterial communities that are present in higher relative abundances in Cluster II were characterized by significantly higher intakes of polyphenols.Citation43,Citation44
Specific relationships between nutrients and maternal microbes were also identified. A higher intake of nutrients present in plant-based foods, such as vegetable proteins, dietary fiber, and polyphenols, was associated with a higher presence of members of Christensenellaceae, Dehalobacterium, and Eubacterium, and negatively associated with Campylobacter and Dialister. In a previous study, we demonstrated higher levels of Christensellaceae in individuals who presented a high-level adherence to the Mediterranean diet (MD).Citation26 The MD pattern is characterized by a high intake of fruits, vegetables, legumes, and olive oil as the main source of fats, and foods that contain large amounts of the previously cited nutritional compounds. In addition, Christensellaceae has been linked with leanness.Citation45 Dehalobacterium and Eubacterium as well as Anaeroplasma, Roseburia, and Oscillospira, appeared to play an important role against atherosclerosis and showed significant negative correlation with atherosclerotic plaque size and plasma adipocytes.Citation46 Dehalobacterium and Eubacterium produce butyrate and propionate, respectively, and are two of the SCFAs that are most often considered beneficial to health.Citation25,Citation47 The prevalence of overweight and obesity has nearly tripled in the last 40 years, and the rate among children is also rapidly increasing.Citation48 Consequently, it is important to identify infants at risk for overweight to avoid short- and long-term health consequences.
For that purpose, various studies have examined specific anthropometrical measurements such as WFL and BMI z-scores to assess the risk of overweight and obesity before age 2. WFL is the current measurement recommended by the American Academy of Pediatrics (AAP).Citation49,Citation50 However, recent studies have suggested that BMI would be a useful tool that also provides information of adiposity and future obesity risk.Citation51-Citation53 For children under age 5, the WHO defines the risk of overweight when BMI and/or WLF z-score are greater than 1 standard deviation (SD), overweight when they are greater than 2 SD, and obesity when they are greater than 3 SD according to the WHO Child Growth Standards median.Citation54 In our study, a higher prevalence of children at risk of overweight according to BMI and WFL z-scores at 18 months was found within mothers in Cluster I. Although no significant differences in maternal BMI according to the clusters were observed, a recent study pointed out that Finegoldia and Wal_1885D, bacterial features associated with maternal Cluster I, were associated with maternal overweight, obesity, and excessive gestational weight gain during pregnancy.Citation55 Those maternal gut microbial shifts would have health consequences for the child through an early colonization of the infant gut microbiota. It is well known that other factors during early life such as mode of delivery, antibiotic exposure, and infant feeding practices may cause potentially adverse effects on the development of the infant gut microbiota and may have an impact on obesity risk.Citation56,Citation57 Several studies have shown an increased risk of obesity in infants exposed to antibiotics mainly due to C-section birth.Citation12,Citation58-Citation60 C-section is always performed under antibiotic exposure to avoid infections, and both C-section and antibiotics together alter the natural transmission of microbes from the mother to the child; this affects the correct development of the gut microbiota. In addition, this effect occurs in early life, a period of time when the gut microbiota is particularly susceptible to perturbations with long-lasting effects on metabolic programming and obesity risk.
Children from maternal Cluster I and born by C-section showed higher BMI and WFL z-scores at 18 months than those observed in vaginal births and in infants from mothers in Cluster II. Additionally, a multivariate linear model analysis, adjusted by mode of delivery, antibiotic exposure, pre-gestational maternal BMI, and feeding method demonstrated that neonates belonging to maternal Cluster I presented significantly higher BMI and WFL z-scores at 1 month and 18 months. Regression models also showed that the maternal microbial cluster and mode of delivery were significant predictors of risk of overweight at 18 months according to the WHO cutoff for BMI z-score. Children’s BMI and WFL z-score trajectories from birth to 18 months of age were shaped by maternal microbial clusters and mode of birth, showing higher BMI and WFL z-scores in neonates born by C-section and, remarkably, in those born from mothers in Cluster I, which was enriched in the genus Prevotella, followed by Peptoniphilus, Anaerococcus, and Porphyromonas, was linked to lower fiber intake and n-3 fatty acids, and had higher intakes of animal protein and SFA. This suggests that maternal diet is also a relevant factor during early life due to the potential role in mother–infant microbial transference, which would affect infant growth and development. Although C-section birth limits maternal microbial transfer due to antibiotic treatment together with reduced exposure to the intestinal maternal microbiota, maternal diet would modulate microbial pioneers that could be relevant for colonization of the neonatal microbiota and have a potential effect on infant health. The direct relationship between maternal diet–microbiota and C-section with infant development and the risk of overweight and obesity later in life warrants further investigation.
Study limitations
Our study has some limitations related to its observational nature, the sample size and power analysis, and the collection of dietary information. The limited power size may have hampered our ability somewhat to detect other significant associations; large-scale prospective longitudinal studies are required. However, this would be mitigated by the difficulty of including mother–infant pairs in the study. Dietary information recorded by the Food Frequency Questionnaire (FFQ) would introduce bias caused by errors in memory and the lack of perception of food proportion sizes. Therefore, the quantification of the nutritional compound intake is limited and 24 h recall and/or 3 d recall, including portions, would be desirable for future studies. Additionally, there is increasing evidence suggesting that dietary patterns are usually associated with other lifestyle routines such as exercise or chronic stress, which are not considered in this study. Furthermore, our study considered some perinatal factors, but it is known that during the first 18 months of life, many other environmental factors play a role in infant development and risk of diseases.
Despite all these limitations, our study demonstrated how diets during healthy pregnancies have an influence on the maternal–neonatal microbiota, with potential effects on infant growth. Furthermore, the microbiota composition was analyzed using DNA methods; microbiota activity measured by SCFA or metabolomics would provide novel perspectives to understand the diet–microbiota interactions and their effects on host health. Further studies with a larger number of infants as well as a longer follow-up period are needed.
Conclusions
Maternal diet during pregnancy, together with other perinatal factors such as mode of delivery, antibiotic exposure, and breastfeeding, represent potential factors to consider for infant microbial colonization. The maternal microbiota is shaped by diet, especially with regard to fiber, lipids, and proteins, and may have a significant effect on the establishment of neonatal microbiota, as well as a potential contribution on infant development and the risk of overweight during the first months of life. C-section neonates from mothers with more adequate diets shaping specific microbiota presented a lower risk of overweight at age 18 months. Diet matters for maternal–neonatal microbiota and health outcomes. Therefore, specific dietary programs targeting pregnant women may be a cost-effective intervention factor to promote adequate vertical mother–infant exposition.
Subjects and methods
Study design and volunteers
The study included 116 mother–neonate pairs from the prospective and observational MAMI birth cohort, recruited from 2015–2017. MAMI is a prospective mother–infant birth cohort in the Spanish-Mediterranean area, as detailed by García-Mantrana et al.Citation61
The following nutritional and clinical parameters were collected: maternal antibiotic exposure, BMI and weight gain during pregnancy, mode of delivery, birth weight, birth length, infant feeding, infant BMI, and WFL z-scores.
None of the participating volunteers were diagnosed with any disease; none were under drug treatment or prebiotics administration, with the exception of antibiotics use during pregnancy and/or at delivery. All participants received oral and written information about the study and written consent was obtained. The study was approved by the Hospital Ethics Committees (HECs) (Hospital Universitario y Politécnico La Fe and Hospital Clínico Universitario de Valencia). The study is registered on the ClinicalTrial.gov platform, with registration number NCT03552939.
Nutritional assessment
Dietary records were collected during the first week after birth by a nutritionist using a 140-item Food Frequency Questionnaire (FFQ) about their regular diet during the pregnancy.Citation62 FFQ information was analyzed for the energy and daily intake of macro- and micronutrients by using the nutrient Food Composition Tables developed by the Centro de Enseñanza Superior de Nutrición Humana y Dietética (CESNID).Citation63 The intake of specific dietary fiber, as soluble and insoluble fiber types, was completed from the Marlett food composition tables.Citation64 Polyphenol content was obtained from the Phenol-Explorer database.Citation65 Data were normalized by 2500 kcal/day.
Furthermore, adherence to the Mediterranean Diet (MD) was also calculated by the use of the PREDIMED validated test.Citation66 The MD score ranged from 0 (minimal adherence) to 14 (maximal adherence). A score of nine or more points meant good adherence to the Mediterranean diet.
Child growth development
Length and weight were registered at birth, 1, 6, 12, and 18 months. Z-scores of anthropometric measures were electronically computed using WHO Anthro software (www.who.int/childgrowth/software/en/). The WHO Child Growth Standards provide child growth measures standardized by age and sex using z-score. Longitudinal BMI and WFL z-score trajectories from birth to 18 months were obtained. For children under 5 years old, the WHO defines the risk of overweight when BMI and/or WLF z-score are greater than 1 standard deviation (SD), overweight when they are greater than 2 SD, and obesity when they are greater than 3 SD according to the WHO Child Growth Standards median.Citation54
Fecal samples and DNA extraction
Maternal–neonatal samples were collected in the delivery room by trained clinical personnel, in order to avoid the potential impact of the environment during the first 24 h after birth. Maternal gut samples were obtained by swabbing a sterile, cotton-tipped swab in the rectum before birth in the delivery room. Neonatal sample collection was also obtained by introducing a sterile, cotton-tipped swab in the neonatal rectum just after birth in the delivery room.
Both swabs were stored in pre-numbered sterile containers to avoid errors. After collection, all samples were immediately transported to the specimen biobank within 1 hour of collection and placed in sterile, pre-numbered cryovials at −80°C under specific standardized protocols at Biobanco para la Investigación Biomédica y en Salud Pública de la Comunidad Valenciana (Fisabio Public Health Biobank IBSP-CV) until further analysis. Once all samples were collected and placed in the biobank, aliquots were transported in dry ice to IATA-CSIC for the analysis.
Total DNA was isolated from the fecal samples using the Master-Pure DNA Extraction Kit (Epicenter, Madison, WI, USA) according to the manufacturer’s instructions; modifications included physical and enzymatic treatments. In brief, cell lysis was performed by mechanical disruption using 3-µm diameter glass beads in a FastPrep 24-5G Homogenizer (MP Biomedicals, CA, USA), followed by an enzymatic treatment for 60 min at 37°C with the lysis buffer supplemented with lysozyme (20 mg/ml) and mutanolysine (5U/ml). A DNA Purification Kit (Macherey–Nagel, Duren, Germany) was used and DNA was quantified using Qubit 2.0 Fluorometer (Life Technology, Carlsbad, CA, United States). Meconium is a low-microbial biomass sample that would be affected by potential contaminants from the environment and DNA extraction kits reagents (kitome). Then, to rule out potential contamination, controls during DNA extraction and polymerase chain reaction (PCR) amplification were also included and sequenced.
16S rRNA amplicon sequencing
Gut microbiota composition and diversity were determined by the V3-V4 variable region of the 16S rRNA gene sequencing, following Illumina protocols. A Nextera XT Index Kit (Illumina, CA, USA) was used for the multiplexing step and a Bioanalyzer DNA 1000 chip (Agilent Technologies, CA, USA) was used to check the PCR product quality. Libraries were sequenced using a 2 × 300 pb paired-end run (MiSeq Reagent kit v3) on a MiSeq-Illumina platform (FISABIO sequencing service, Valencia, Spain), according to manufacturer´s instructions (Illumina).
Quality filtering, sequence joining, and chimera removal were obtained using an ad-hoc pipeline written in an RStatistics environment; data processing was performed using a QIIME pipeline (version 1.9.0).Citation67 Operational Taxonomic Units (OTUs) were constructed by an open-reference OTU picking method with 99% as a threshold of identity. Representative sequences were taxonomically assigned based on the RDP database. Samples with a relative abundance of less than 0.05% and sequences classified as Cyanobacteria and Chloroplast were removed from the dataset as they represent ingested plant material.
Statistical analysis
Microbiota data was analyzed in the Calypso online platform (v8.84) (http://cgenome.net/wiki/index.php/Calypso/) and data was normalized by the Total-Sum Scaling (TSS) method. Alpha diversity indexes (Chao1, Shannon, and inverse Simpson indexes) were determined and beta diversity based on Bray–Curtis distance was obtained.
Maternal microbiota clustering was performed at the genus level, as described elsewhere.Citation68 Jensen-Shannon distance and partitioning around medoid (PAM) clustering were used. The optimal number of clusters was calculated by the Calinski-Harabasz (CH) index. The clusters were generated using the phyloseq, cluster, MASS, clusterSim, and ade4 R packages.Citation69-Citation73
Linear discriminant analysis effect size (LEfSe) was used to identify microbial genera enriched in maternal clusters. An LDA score (log10) > 3 was considered significant. Multivariate analysis, including Redundancy Analysis (RDA), Principal Component Analysis (PCA) as well as Principal Coordinate Analysis (PCoA), and permutational multivariate analysis of variance (PERMANOVA) based on Bray–Curtis distance was also achieved on Calypso. Specific correlations, general linear models (GLM) for fixed factors and/or covariate analysis were assessed by SPSS software v26 and Graphpad Prims v5.04.Citation74 P-values were corrected with Benjamini-Hochberg’s false discovery rate (FDR) method. RStudio was also used to represent the heatmaps between bacterial groups at the genus level and dietary components through the ggplot package.Citation75,Citation76
Author contributors
The authors’ responsibilities were as follows: MCC: designed the study; CM, AP: recruited the families and collect the biological samples; IGM and CM were collecting and calculating infant records including calculation of z-scores; IGM and SG were responsible of the dietary information and analysis; IGM and MSR were responsible for the microbiota data and statistical analysis; IGM drafted first draft; and all authors: read and approved the final manuscript.
Disclosure of potential conflicts of interest
The authors report no potential conflict of interest.
Acknowledgments
The authors thank the families involved in MAMI study as well as all the members of the MAMI cohort study. This research has received funding from the European Research Council (ERC) under the European Union’s Horizon 2020 research and innovation programme (ERC starting grant, n° 639226). M. Selma-Royo is supported by a Pre-doctoral Fellowship from Generalitat Valenciana (GVA)-European Social Fund (ASCII2016).
Additional information
Funding
References
- Nauta A, Amor K, Knol J, Garssen J, Van Der Beek E. Relevance of pre- and postnatal nutrition to development and interplay between the microbiota and metabolic and immune systems. Am J Clin Nutr. [Internet]. 2013;98:586S–593S. http://www.embase.com/search/results?subaction=viewrecord&from=export&id=L369512071%0Ahttp://ajcn.nutrition.org/content/98/2/586S.full.pdf+html%0Ahttp://dx.doi.org/10.3945/ajcn.112.039644.
- Lucas C, Charlton KE, Yeatman H. Nutrition advice during pregnancy: do women receive it and can health professionals provide it? Matern Child Health J. [Internet]. 2014;18:2465–2478. doi:10.1007/s10995-014-1485-0.
- Amarasekara R, Jayasekara RW, Senanayake H, Dissanayake VHW. Microbiome of the placenta in pre-eclampsia supports the role of bacteria in the multifactorial cause of pre-eclampsia. J Obstet Gynaecol Res. [Internet]. 2015 accessed 2019 Jun 3;41:662–669. doi:10.1111/jog.12619.
- Bhutta ZA, Lassi ZS. Preconception care and nutrition interventions in low- and middle-income countries. [Internet]. S. Karger AG; 2014. [ accessed 2018 May 30]. p. 15–26. https://www.karger.com/Article/FullText/360246.
- García-Mantrana I, Bertua B, Martínez-Costa C, Collado MC. Perinatal nutrition: how to take care of the gut microbiota? Clin Nutr Exp. [Internet]. 2016 accessed 2017 Aug 10;6:3–16. http://linkinghub.elsevier.com/retrieve/pii/S2352939316000063.
- Mokkala K, Röytiö H, Munukka E, Pietilä S, Ekblad U, Rönnemaa T, Eerola E, Laiho A, Laitinen K. Gut microbiota richness and composition and dietary intake of overweight pregnant women are related to serum zonulin concentration, a marker for intestinal permeability. J Nutr. [Internet]. 2016 accessed 2019 Oct 16;146:1694–1700. http://www.ncbi.nlm.nih.gov/pubmed/27466607.
- Mandal S, Godfrey KM, McDonald D, Treuren WV, Bjørnholt JV, Midtvedt T, Moen B, Rudi K, Knight R, Brantsæter AL, et al. Fat and vitamin intakes during pregnancy have stronger relations with a pro-inflammatory maternal microbiota than does carbohydrate intake. Microbiome. [Internet]. 2016 accessed 2019 Oct 16;4:55. http://microbiomejournal.biomedcentral.com/articles/10.1186/s40168-016-0200-3.
- Gomez-Arango LF, Barrett HL, Wilkinson SA, Callaway LK, McIntyre HD, Morrison M, Dekker Nitert M. Low dietary fiber intake increases Collinsella abundance in the gut microbiota of overweight and obese pregnant women. Gut Microbes. [Internet]. 2018 accessed 2019 Oct 16;9:189–201. https://www.tandfonline.com/doi/full/10.1080/19490976.2017.1406584.
- Ferrocino I, Ponzo V, Gambino R, Zarovska A, Leone F, Monzeglio C, Goitre I, Rosato R, Romano A, Grassi G, et al. Changes in the gut microbiota composition during pregnancy in patients with gestational diabetes mellitus (GDM). Sci Rep. [Internet]. 2018 accessed 2019 Oct 16;8:12216. http://www.ncbi.nlm.nih.gov/pubmed/30111822.
- Barrett H, Gomez-Arango L, Wilkinson S, McIntyre H, Callaway L, Morrison M, Dekker Nitert M. A vegetarian diet is a major determinant of gut microbiota composition in early pregnancy. Nutrients. [Internet]. 2018 accessed 2019 Oct 16;10:890. http://www.ncbi.nlm.nih.gov/pubmed/30002323.
- Savage JH, Lee-Sarwar KA, Sordillo JE, Lange NE, Zhou Y, O’Connor GT, Sandel M, Bacharier LB, Zeiger R, Sodergren E, et al. Diet during pregnancy and infancy and the infant intestinal microbiome. J Pediatr. [Internet]. 2018 accessed 2019 Oct 16;203:47–54.e4. http://www.ncbi.nlm.nih.gov/pubmed/30173873.
- Cox LM, Blaser MJ. Antibiotics in early life and obesity. Nat Rev Endocrinol.[Internet]. 2015 accessed 2019 Oct 16;11:182–190. http://www.ncbi.nlm.nih.gov/pubmed/25488483.
- Dominguez-Bello MG, Costello EK, Contreras M, Magris M, Hidalgo G, Fierer N, Knight R. Delivery mode shapes the acquisition and structure of the initial microbiota across multiple body habitats in newborns. Proc Natl Acad Sci. [Internet]. 2010 accessed 2017 Oct 2;107:11971–11975. http://www.ncbi.nlm.nih.gov/pubmed/20566857.
- Ajslev TA, Andersen CS, Gamborg M, Sørensen TIA, Jess T. Childhood overweight after establishment of the gut microbiota: the role of delivery mode, pre-pregnancy weight and early administration of antibiotics. Int J Obes. [Internet]. 2011 accessed 2019 Jul 11;35:522–529. http://www.nature.com/articles/ijo201127.
- Kalliomäki M, Carmen Collado M, Salminen S, Isolauri E. Early differences in fecal microbiota composition in children may predict overweight. Am J Clin Nutr. [Internet]. 2008 accessed 2019 Jul 11;87:534–538. https://academic.oup.com/ajcn/article/87/3/534/4633266.
- Collado MC, Isolauri E, Laitinen K, Salminen S. Effect of mother’s weight on infant’s microbiota acquisition, composition, and activity during early infancy: a prospective follow-up study initiated in early pregnancy. Am J Clin Nutr. [Internet]. 2010 accessed 2018 May 30;92:1023–1030. http://www.ncbi.nlm.nih.gov/pubmed/20844065.
- Garcia-Mantrana I, Collado MC. Obesity and overweight: impact on maternal and milk microbiome and their role for infant health and nutrition. Mol Nutr Food Res. [Internet]. 2016 accessed 2017 Aug 10;60:1865–1875. http://www.ncbi.nlm.nih.gov/pubmed/27159888.
- Singh SB, Madan J, Coker M, Hoen A, Baker ER, Karagas MR, Mueller NT. Does birth mode modify associations of maternal pre-pregnancy BMI and gestational weight gain with the infant gut microbiome? Int J Obes. [Internet]. 2019 accessed 2019 Oct 16. http://www.ncbi.nlm.nih.gov/pubmed/30765892.
- Kovatcheva-Datchary P, Nilsson A, Akrami R, Lee YS, De Vadder F, Arora T, Hallen A, Martens E, Björck I, Bäckhed F. Dietary fiber-induced improvement in glucose metabolism is associated with increased abundance of prevotella. Cell Metab. [Internet]. 2015 accessed 2019 Dec 16;22:971–982. https://linkinghub.elsevier.com/retrieve/pii/S1550413115005173.
- Pedersen HK, Gudmundsdottir V, Nielsen HB, Hyotylainen T, Nielsen T, Jensen BAH, Forslund K, Hildebrand F, Prifti E, Falony G, et al. Human gut microbes impact host serum metabolome and insulin sensitivity. Nature. [Internet]. 2016 accessed 2019 Dec 16;535:376–381. http://www.nature.com/articles/nature18646.
- David LA, Maurice CF, Carmody RN, Gootenberg DB, Button JE, Wolfe BE, Ling AV, Devlin AS, Varma Y, Fischbach MA, et al. Diet rapidly and reproducibly alters the human gut microbiome. Nature. Internet. 2014;505:559–563. https://www.ncbi.nlm.nih.gov/pubmed/24336217.
- Walker AW, Duncan SH, Harmsen HJM, Holtrop G, Welling GW, Flint HJ. The species composition of the human intestinal microbiota differs between particle-associated and liquid phase communities. Environ Microbiol. Internet. 2008;10:3275–3283. doi:10.1111/j.1462-2920.2008.01717.x.
- Miquel S, Martín R, Rossi O, Bermúdez-Humarán L, Chatel J, Sokol H, Thomas M, Wells J, Langella P. Faecalibacterium prausnitzii and human intestinal health. Curr Opin Microbiol. Internet. 2013 accessed 2019 Jun 6;16:255–261. https://www.sciencedirect.com/science/article/pii/S1369527413000775.
- Zhang M, Zhou L, Wang Y, Dorfman RG, Tang D, Xu L, Pan Y, Zhou Q, Li Y, Yin Y, et al. Faecalibacterium prausnitzii produces butyrate to decrease c-Myc-related metabolism and Th17 differentiation by inhibiting histone deacetylase 3. Int Immunol. Internet. 2019 accessed 2019 Jun 6;31:499–514. https://academic.oup.com/intimm/advance-article/doi/10.1093/intimm/dxz022/5365732.
- Rivière A, Selak M, Lantin D, Leroy F, De Vuyst L. Bifidobacteria and butyrate-producing colon bacteria: importance and strategies for their stimulation in the human gut. Front Microbiol. Internet. 2016 accessed 2017 Jul 21;7:979. http://www.ncbi.nlm.nih.gov/pubmed/27446020.
- Garcia-Mantrana I, Selma-Royo M, Alcantara C, Collado MC. Shifts on gut microbiota associated to mediterranean diet adherence and specific dietary intakes on general adult population. Front Microbiol. Internet. 2018 accessed 2019 Jun 5;9. http://journal.frontiersin.org/article/10.3389/fmicb.2018.00890/full.
- Maeda N, Okamoto M, Kondo K, Ishikawa H, Osada R, Tsurumoto A, Fujita H. Incidence of Prevotella intermedia and Prevotella nigrescens in periodontal health and disease. Microbiol Immunol. Internet. 1998 accessed 2019 Jun 3;42:583–589. doi:10.1111/j.1348-0421.1998.tb02328.x.
- Riggio MP, Lennon A. Identification of oral peptostreptococcus isolates by PCR-restriction fragment length polymorphism analysis of 16S rRNA genes. J Clin Microbiol. Internet. 2003 cited 2019 Jun 3;41:4475–4479. http://www.ncbi.nlm.nih.gov/pubmed/12958299.
- Szafrański SP, Deng Z-L, Tomasch J, Jarek M, Bhuju S, Meisinger C, Kühnisch J, Sztajer H, Wagner-Döbler I. Functional biomarkers for chronic periodontitis and insights into the roles of Prevotella nigrescens and Fusobacterium nucleatum; a metatranscriptome analysis. NPJ Biofilms Microbiomes. Internet. 2015 accessed 2019 Jun 3;1:15017. http://www.ncbi.nlm.nih.gov/pubmed/28721234.
- Hansen TH, Kern T, Bak EG, Kashani A, Allin KH, Nielsen T, Hansen T, Pedersen O. Impact of a vegan diet on the human salivary microbiota. Sci Rep. Internet. 2018;8:5847. https://www.ncbi.nlm.nih.gov/pubmed/29643500.
- Lourenςo TGB, Spencer SJ, Alm EJ, Colombo APV. Defining the gut microbiota in individuals with periodontal diseases: an exploratory study. J Oral Microbiol. Internet. 2018 cited 2019 Jun 3;10:1487741. http://www.ncbi.nlm.nih.gov/pubmed/29988721.
- Vonaesch P, Morien E, Andrianonimiadana L, Sanke H, Mbecko J-R, Huus KE, Naharimanananirina T, Gondje BP, Nigatoloum SN, Vondo SS, et al. Stunted childhood growth is associated with decompartmentalization of the gastrointestinal tract and overgrowth of oropharyngeal taxa. Proc Natl Acad Sci. Internet. 2018 accessed 2019 Jun 3;115:E8489–98. http://www.ncbi.nlm.nih.gov/pubmed/30126990.
- Olsen I, Yamazaki K. Can oral bacteria affect the microbiome of the gut? J Oral Microbiol. Internet. 2019 accessed 2019 Jun 3;11:1586422. http://www.ncbi.nlm.nih.gov/pubmed/30911359.
- Schmidt TS, Hayward MR, Coelho LP, Li SS, Costea PI, Voigt AY, Wirbel J, Maistrenko OM, Alves RJ, Bergsten E, et al. Extensive transmission of microbes along the gastrointestinal tract. Elife. Internet. 2019 accessed 2019 Jun 3;8. http://www.ncbi.nlm.nih.gov/pubmed/30747106.
- Borgo PV, Rodrigues VAA, Feitosa ACR, Xavier KCB, Avila-Campos MJ, BORGO PV, RODRIGUES VAA, FEITOSA ACR, XAVIER KCB, AVILA-CAMPOS MJ. Association between periodontal condition and subgingival microbiota in women during pregnancy: a longitudinal study. J Appl Oral Sci. Internet. 2014 accessed 2019 Jun 3;22:528–533. http://www.scielo.br/scielo.php?script=sci_arttext&pid=S1678-77572014000600528&lng=en&tlng=en.
- Merchant AT, Pitiphat W, Franz M, Joshipura KJ. Whole-grain and fiber intakes and periodontitis risk in men. Am J Clin Nutr. Internet. 2006;83:1395–1400. doi:10.1093/ajcn/83.6.1395.
- Nielsen SJ, Trak-Fellermeier MA, Joshipura K, Dye BA. Dietary fiber intake is inversely associated with periodontal disease among US adults. J Nutr. Internet. 2016;146:2530–2536. https://www.ncbi.nlm.nih.gov/pubmed/27798338.
- Rombaldi Bernardi J, de Souza Escobar R, Ferreira CF, Pelufo Silveira P. Fetal and neonatal levels of omega-3: effects on neurodevelopment, nutrition, and growth. Sci World J. Internet. 2012 accessed 2019 Oct 16;2012:202473. http://www.ncbi.nlm.nih.gov/pubmed/23125553.
- Coletta JM, Bell SJ, Roman AS. Omega-3 fatty acids and pregnancy. Rev Obstet Gynecol. Internet. 2010;3:163–171. https://www.ncbi.nlm.nih.gov/pubmed/21364848.
- Ciesielski TH, Bartlett J, Williams SM. Omega-3 polyunsaturated fatty acid intake norms and preterm birth rate: a cross-sectional analysis of 184 countries. BMJ Open. Internet. 2019;9:e027249. http://bmjopen.bmj.com/content/9/4/e027249.abstract.
- Tortosa-Caparrós E, Navas-Carrillo D, Marín F, Orenes-Piñero E. Anti-inflammatory effects of omega 3 and omega 6 polyunsaturated fatty acids in cardiovascular disease and metabolic syndrome. Crit Rev Food Sci Nutr. Internet. 2017 accessed 2019 Dec 17;57:3421–3429. http://www.ncbi.nlm.nih.gov/pubmed/26745681.
- Costantini L, Molinari R, Farinon B, Merendino N. Impact of omega-3 fatty acids on the gut microbiota. Int J Mol Sci. Internet. 2017;18:2645. https://www.ncbi.nlm.nih.gov/pubmed/29215589.
- Duda-Chodak A, Tarko T, Satora P, Sroka P. Interaction of dietary compounds, especially polyphenols, with the intestinal microbiota: a review. Eur J Nutr. Internet. 2015 accessed 2019 Jun 28;54:325–341. http://www.ncbi.nlm.nih.gov/pubmed/25672526.
- Ozdal T, Sela DA, Xiao J, Boyacioglu D, Chen F, Capanoglu E. The reciprocal interactions between polyphenols and gut microbiota and effects on bioaccessibility. Nutrients. Internet. 2016 accessed 2019 Jun 28;8:78. http://www.ncbi.nlm.nih.gov/pubmed/26861391.
- Goodrich JK, Waters JL, Poole AC, Sutter JL, Koren O, Blekhman R, Beaumont M, Van Treuren W, Knight R, Bell JT, et al. Human genetics shape the gut microbiome. Cell. Internet. 2014 accessed 2017 Jul 21;159:789–799. http://www.ncbi.nlm.nih.gov/pubmed/25417156.
- Chan YK, Brar MS, Kirjavainen PV, Chen Y, Peng J, Li D, Leung F-C-C, El-Nezami H. High fat diet induced atherosclerosis is accompanied with low colonic bacterial diversity and altered abundances that correlates with plaque size, plasma A-FABP and cholesterol: a pilot study of high fat diet and its intervention with Lactobacillus rhamno. BMC Microbiol. Internet. 2016;16:264. https://www.ncbi.nlm.nih.gov/pubmed/27821063.
- Louis P, Flint HJ. Formation of propionate and butyrate by the human colonic microbiota. Environ Microbiol. Internet. 2017 accessed 2019 Jun 6;19:29–41. http://www.ncbi.nlm.nih.gov/pubmed/27928878.
- Wyatt SB, Winters KP, Dubbert PM. Overweight and obesity: prevalence, consequences, and causes of a growing public health problem. Am J Med Sci. Internet. 2006 accessed 2019 Jun 28;331:166–174. https://www.sciencedirect.com/science/article/abs/pii/S0002962915328032.
- Hassink SG, Daniels SR, Abrams SA, Corkins MR, De Ferranti SD, Golden NH, Magge SN, Schwarzenberg SJ. The role of the pediatrician in primary prevention of obesity. Pediatrics. 2015;136:e275–92. doi:10.1542/peds.2015-1558.
- Roy SM, Spivack JG, Faith MS, Chesi A, Mitchell JA, Kelly A, Grant SFA, McCormack SE, Zemel BS. Infant BMI or weight-for-length and obesity risk in early childhood. Pediatrics. 2016;137:e20153492–e20153492. doi:10.1542/peds.2015-3492.
- Silverwood RJ, De Stavola BL, Cole TJ, Leon DA. BMI peak in infancy as a predictor for later BMI in the uppsala family study. Int J Obes. Internet. 2009 accessed 2019 Oct 16;33:929–937. http://www.ncbi.nlm.nih.gov/pubmed/19564879.
- Sovio U, Kaakinen M, Tzoulaki I, Das S, Ruokonen A, Pouta A, Hartikainen A-L, Molitor J, Järvelin M-R. How do changes in body mass index in infancy and childhood associate with cardiometabolic profile in adulthood? Findings from the Northern Finland Birth Cohort 1966 study. Int J Obes. Internet. 2014 accessed 2019 Oct 16;38:53–59. http://www.ncbi.nlm.nih.gov/pubmed/24080793.
- Roy SM, Fields DA, Mitchell JA, Hawkes CP, Kelly A, Wu GD, DeRusso PA, Elovitz MA, Ford E, Drigo D, Zemel BS, McCormack SE. Body Mass Index Is a Better Indicator of Body Composition than Weight-for-Length at Age 1 Month. J Pediatr. 2019; 204:77–83. doi:10.1016/j.jpeds.2018.08.007.
- de Onis M, Lobstein T. Defining obesity risk status in the general childhood population: which cut-offs should we use? Int J Pediatr Obes. Internet. 2010 accessed 2019 Oct 16;5:458–460. http://www.ncbi.nlm.nih.gov/pubmed/20233144.
- Stanislawski MA, Dabelea D, Wagner BD, Sontag MK, Lozupone CA, Eggesbø M. Pre-pregnancy weight, gestational weight gain, and the gut microbiota of mothers and their infants. Microbiome. Internet. 2017 accessed 2019 Dec 16;5:113. https://microbiomejournal.biomedcentral.com/articles/10.1186/s40168-017-0332-0.
- Koleva P, Bridgman S, Kozyrskyj A. the infant gut microbiome: evidence for obesity risk and dietary intervention. Nutrients. Internet. 2015 accessed 2017 Oct 27;7:2237–2260. http://www.ncbi.nlm.nih.gov/pubmed/25835047.
- Stanislawski MA, Dabelea D, Wagner BD, Iszatt N, Dahl C, Sontag MK, Knight R, Lozupone CA, Eggesbø M. Gut microbiota in the first 2 years of life and the association with body mass index at age 12 in a Norwegian Birth Cohort. MBio. 2018;9:1–14. doi:10.1128/mBio.01751-18.
- Bokulich NA, Chung J, Battaglia T, Henderson N, Jay M, Li H, Lieber AD, Wu F, Perez-Perez GI, Chen Y, et al. Antibiotics, birth mode, and diet shape microbiome maturation during early life. Sci Transl Med. Internet] 2016 accessed 2019 Oct 16;8:343ra82–343ra82. http://www.ncbi.nlm.nih.gov/pubmed/27306664.
- Azad MB, Moossavi S, Owora A, Sepehri S. Early-life antibiotic exposure, gut microbiota development, and predisposition to obesity. Internet. In: Nestle Nutrition Institute workshop series. 2017 [accessed 2019 Oct 16]. p. 67–79. http://www.ncbi.nlm.nih.gov/pubmed/28346924.
- Dutton H, Doyle M-A, Buchan CA, Mohammad S, Adamo KB, Shorr R, Fergusson DA. Antibiotic exposure and risk of weight gain and obesity: protocol for a systematic review. Syst Rev. Internet. 2017 accessed 2019 Oct 16;6:169. http://www.ncbi.nlm.nih.gov/pubmed/28837004.
- García-Mantrana I, Alcántara C, Selma-Royo M, Boix-Amorós A, Dzidic M, Gimeno-Alcañiz J, Úbeda-Sansano I, Sorribes-Monrabal I, Escuriet R, Gil-Raga F, et al. MAMI: a birth cohort focused on maternal-infant microbiota during early life. BMC Pediatr. 2019;19:140. doi:10.1186/s12887-019-1502-y.
- Fernández-Ballart JD, Piñol JL, Zazpe I, Corella D, Carrasco P, Toledo E, Perez-Bauer M, Ngel Martínez-González M, Salas-Salvadó J, Martín-Moreno JM. Relative validity of a semi-quantitative food-frequency questionnaire in an elderly Mediterranean population of Spain. Br J Nutr. Internet. 2010 accessed 2017 Nov 29;103:1808–1816. https://www.cambridge.org/core/services/aop-cambridge-core/content/view/AE602565052BA7B01EE799B4D9B3E8C4/S0007114509993837a.pdf/relative_validity_of_a_semiquantitative_foodfrequency_questionnaire_in_an_elderly_mediterranean_population_of_spain.pdf.
- Cervera P, Farran A, Zamora-Ros R. Tablas de composición de alimentos CESNID = Taules de composició d’aliments del CESNID. New York: McGraw-Hill, Universitat de Barcelona; 2004.
- Marlett J, Cheung T. Database and quick methods of assessing typical dietary fiber intakes using data for 228 commonly consumed foods. J Am Diet Assoc. Internet. 1997 accessed 2019 Jun 6;97:1139–1151. http://www.ncbi.nlm.nih.gov/pubmed/9336561.
- Neveu V, Perez-Jiménez J, Vos F, Crespy V, Du Chaffaut L, Mennen L, Knox C, Eisner R, Cruz J, Wishart D, et al. Phenol-Explorer: an online comprehensive database on polyphenol contents in foods. Database (Oxford). Internet. 2010 accessed 2019 Oct 16;2010:bap024. http://www.ncbi.nlm.nih.gov/pubmed/20428313.
- Martinez-Gonzalez MA, Corella D, Salas-Salvado J, Ros E, Covas MI, Fiol M, Warnberg J, Aros F, Ruiz-Gutierrez V, Lamuela-Raventos RM, et al. Cohort Profile: design and methods of the PREDIMED study. Int J Epidemiol. Internet. 2012 accessed 2017 Jul 21;41:377–385. http://www.ncbi.nlm.nih.gov/pubmed/21172932.
- Caporaso JG, Kuczynski J, Stombaugh J, Bittinger K, Bushman FD, Costello EK, Fierer N, Peña AG, Goodrich JK, Gordon JI, et al. QIIME allows analysis of high-throughput community sequencing data. Nat Methods. Internet. 2010 accessed 2017 Sep 29;7:335–336. http://www.ncbi.nlm.nih.gov/pubmed/20383131.
- Arumugam M, Raes J, Pelletier E, Le Paslier D, Yamada T, Mende DR, Fernandes GR, Tap J, Bruls T, Batto J-M, et al. Enterotypes of the human gut microbiome. Nature. Internet. 2011 accessed 2019 Jun 3;473:174–180. http://www.nature.com/articles/nature09944.
- McMurdie PJ, Holmes S. phyloseq: an r package for reproducible interactive analysis and graphics of microbiome census data. PLoS One. 2013;8(4):e61217. doi:10.1371/journal.pone.0061217.
- Maechler M, Rousseeuw P, Struyf A, Hubert M, Hornik K. cluster: cluster analysis basics and extensions. R package version 2.0.9; 2019.
- Venables WN, Ripley BD. Modern applied statistics with S. Fourth. New York: Springer; 2002. ISBN 0-387-95457-0.
- Walesiak M, Dudek A. clusterSim: searching for optimal clustering procedure for a data set.R package version 0.47-3. 2018. Available from: https://CRAN.R-project.org/package=clusterSim (accessed 2019 Feb 12).
- Bougeard S, Dray S. Supervised multiblock analysis in R with the ade4 package. J Stat Softw. 2018;86(1):1–17. doi:10.18637/jss.v086.i01.
- IBM Corp. IBM SPSS statistics for windows.
- R Studio Team. RStudio: integrated development for R. RStudio, Inc; Boston (MA); 2016.
- Warners GR, Bolker B, Bonebakker L, Gentleman W, Liaw HA, Lumley T, Maechler M, Magrusson A, Moeller S, Schwartz M, et al. gplots: various R programming tools for plotting data. 2019.