
ABSTRACT
Bile acids are potent antibacterial compounds and play an important role in shaping the microbial ecology of the gut. Here, we combined flow cytometry, growth rate measurements (OD600), and NMR- and mass spectrometry-based metabolomics to systematically profile the impact of bile acids on the microbiome using in vitro and in vivo models. This study confirmed that (1) unconjugated bile acids possess more potent antibacterial activity than conjugated bile acids; (2) Gram-positive bacteria are more sensitive to bile acids than Gram-negative bacteria; (3) some probiotic bacteria such as Lactobacillus and Bifidobacterium and 7α-dehydroxylating bacteria such as Clostridium scindens show bile acid resistance that is associated with activation of glycolysis. Moreover, we demonstrated that (4) as one of most hydrophobic bile acids, lithocholic acid (LCA) shows reduced toxicity to bacteria in the cecal microbiome in both in vivo and in vitro models; (5) bile acids directly and rapidly affect bacterial global metabolism including membrane damage, disrupted amino acid, nucleotide, and carbohydrate metabolism; and (6) in vivo, short-term exposure to bile acids significantly affected host metabolism via alterations of the bacterial community structure. This study systematically profiled interactions between bile acids and gut bacteria providing validation of previous observation and new insights into the interaction of bile acids with the microbiome and mechanisms related to bile acid tolerance.
Introduction
Bile acids are produced in the liver from the oxidation of cholesterol and metabolized in the intestine by the gut microbiota.Citation1 Bile acids and the gut microbiota have a complex and important relationship. First, gut microbiota play an important role in bile acid metabolism.Citation2–Citation4 Bile acid deconjugation is catalyzed by bacterial enzymes known as bile salt hydrolases (BSH), which are found in taxa common to the human gastrointestinal tract including Lactobacillus, Clostridium, Bifidobacterium, and Enterococcus.Citation2,Citation4-Citation6 Unlike BSH activity, only a small number of bacterial species mainly strains of Clostridium scindens, have 7α/β-dehydroxylation activity that are capable of converting primary bile acids to secondary bile acids.Citation2,Citation7 Bile acids also play a critical role in maintaining intestinal homeostasis by promoting the growth of bile acid-metabolizing bacteria and controlling the growth of bile acid-sensitive bacteria. Studies have shown that orally delivered conjugated bile acids reduced bacterial overgrowth and prevented bacterial translocation and endotoxemia in cirrhotic rats.Citation8 Bile acids also act as endogenous ligands for nuclear receptors such as the farnesoid X receptor (FXR), which can activate genes involved in enteric protection and inhibition of bacterial overgrowth and mucosal injury, such as proinflammatory cytokine IL18, inducible NO synthase (iNOS), and carbonic anhydrase 12 (CAR12).Citation9–Citation12
Bile acids inhibit bacterial growth.Citation1,Citation2 The inhibitory effect of bile acids on bacterial growth was observed with individual bacteria species including Bacteroides,Citation13 Clostridia,Citation13,Citation14 Lactobacillus,Citation13,Citation15 Bifidobacteria,Citation15 Escherichia coli,Citation16 Enterococcus fecalis,Citation16 and 7α-dehydroxylating bacteria such as Clostridium scindens,Citation17,Citation18 Clostridium hylemonae,Citation19 and Clostridium hiranonis.Citation19 The cytotoxic effect of bile acids is considered to be associated with their amphipathic nature.Citation20 The detergent activity of bile acids can disrupt bacterial cell membranes, damage DNA, alter the conformation of proteins, and chelate iron and calcium.Citation2 This means that bacteria colonizing the intestinal tract must have bile acid tolerance properties and mechanisms to repair bile acid-induced damage.Citation2,Citation21 Recent studies investigated the specific bile acid resistance mechanisms of some probiotic bacteria including Lactobacillus,Citation21 Bifidobacterium,Citation21 and Bacillus,Citation22 suggesting that bile acid-exposed bacteria overexpress a range of proteins devoted to the efflux of bile salts or protons and modify global metabolism to counteract the negative effects of bile acid exposure.Citation21 However, most studies of this type screened a subset of individual species in vitro, outside the normal niche of the microbial community and the host. The gut microbiota actively interacts with their host to maintain a suitable ecosystem for their survival. Hence, a systematic map of the interactions between bile acids and the cecal bacterial community using in vitro and in vivo models will be useful to further our understanding of the microbiome modulating the activity of bile acids.
In this study, we combine flow cytometry, growth rate measurements (OD600), and NMR- and mass spectrometry-based metabolomics to monitor the effects of bile acids on individual bacteria and cecal bacterial community using in vitro and in vivo models. Our results provide new insights into the microbiome modulating activity of bile acids and potential mechanisms of bile tolerance in bacteria.
Results
The microbiome modulating activity of bile acids on individual bacteria species in vitro
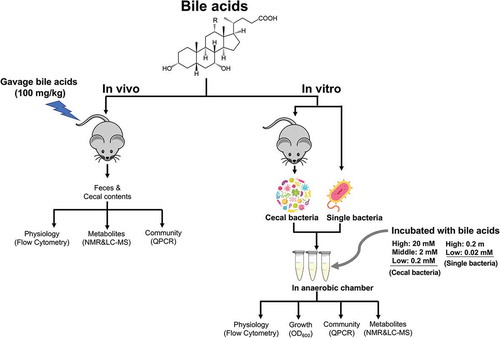
We combined growth rate measurements (OD600) and flow cytometry with UPLC-MS-based metabolomics to investigate the responses of several individual bacteria species exposed to four bile acids including lithocholic acid (LCA), deoxycholic acid (DCA), taurocholic acid (TCA), and tauroursodeoxycholic acid (TUDCA) (). In this study, Bacteriodes fragilis (Gram-negative) and Ruminococcus bromii (Gram-positive) were selected as they are found in the gut of healthy individuals and play a key role in host metabolism.Citation23,Citation24 Lactobacillus paracasei and Bifidobacterium longum were reported to adapt to the presence of bile acids.Citation21 Clostridium scindens is one of the major 7α/β-dehydroxylating bacteria that are capable of converting primary bile acids to secondary bile acids.Citation2,Citation7
Figure 1. Scheme for determining the antibacterial activity of bile acids in vivo and vitro.
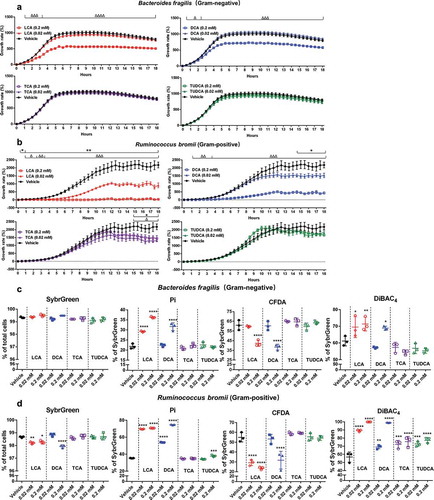
We measured the OD600 over 18 h to assess the impact of bile acids on the growth of bacteria (). The higher dose (0.2 mM) of LCA and DCA significantly reduced the growth of Bacteriodes fragilis and Ruminococcus bromii () after 0.5 ~ 1 h exposure. Ruminococcus bromii is more sensitive as it showed growth inhibition even at lower concentration (0.02 mM) of LCA and DCA exposure (). Two bacterial species showed a reduced response to TCA and TUDCA, with Bacteriodes fragilis being resistant and Ruminococcus bromii being sensitive after 15 h exposure (). We assessed the effects of these four bile acids on bacterial physiological status using four different dyes: total cells (SybrGreen), dead or damaged cells (propidium iodide, Pi), cellular enzymatic activity (carboxyfluorescein diacetate, CFDA), and cells with loss of membrane polarity (bis-(1,3-dibutylbarbituric acid) trimethine oxonol, DiBAC4) (). Consistent with our OD600 results, 4 h high dose exposure (0.2 mM) of LCA and DCA significantly increased the proportions of damaged cells (Pi and DiBAC4-stained cells) and decreased CFDA-stained bacteria (), suggesting rapid changes to bacterial physiology and metabolism. Short-term exposure of TCA and TUDCA did not result in dramatic changes in bacterial physiology but increased the proportion of DiBAC4-stained cells in Ruminococcus bromii after TCA and TUDCA exposure (0.02 mM and 0.2 mM) ().
Figure 2. The growth rate and physiological response of Bacteriodes fragilis and Ruminococcus bromii to bile acid exposure in vitro.
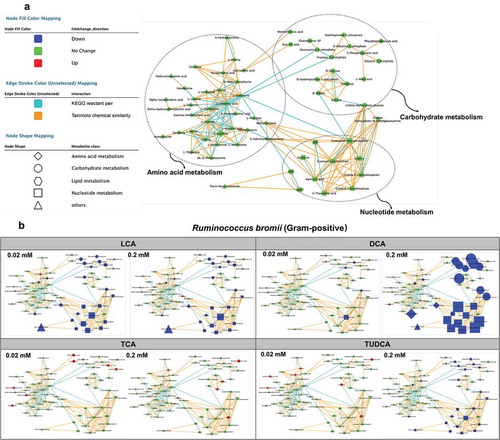
To further explore these trends, metabolic profiling of bile acid-exposed bacteria using UPLC-MS-based metabolomics was performed (, Fig. S1, and Table S1-2). Orbitrap LC-MS identified 57 metabolites involved in amino acid, nucleotide, and carbohydrate metabolism (). The marked decrease in amino acid, nucleotide, and carbohydrate metabolism was observed with high dose (0.2 mM) of LCA and DCA exposure to Bacteriodes fragilis and Ruminococcus bromii ( and Fig. S1A). No significant effects were observed following exposure to TCA in both strains of Bacteriodes fragilis and Ruminococcus bromii but the significant reduction in nucleotide and carbohydrate metabolism was observed with a higher dose (0.2 mM) of TUDCA exposure ( and Fig. S1).
Figure 3. UPLC-MS/MS-based metabolomics analysis of Ruminococcus bromii in response to bile acid exposure in vitro.
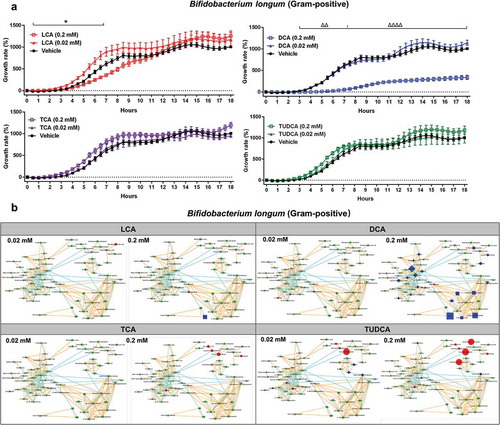
In order to investigate the bile resistant mechanism in probiotic microorganisms, we assessed the impact of bile acids on Lactobacillus paracasei and Bifidobacterium longum (, Fig. S2, and Table S3-4). The higher dose (0.2 mM) of LCA and DCA significantly reduced the growth of Lactobacillus paracasei (Fig. S2A). However, no significant metabolic changes were observed following short-term exposure to two doses (0.02 mM and 0.2 mM) of four bile acids in Lactobacillus paracasei (Fig. S2B). Notably, significant increases in the growth of Bifidobacterium longum were observed in the beginning (around 2–7 h) of a higher dose (0.2 mM) of TCA and TUDCA exposure (), which is associated with a significant increase in glycolysis metabolism (). Taken together, these data suggest that these two bacteria might have intrinsic resistance mechanisms to cope with bile acid exposures.
Figure 4. The growth rate and UPLC-MS/MS-based metabolomics analysis of Bifidobacterium longum in response to bile acid exposure in vitro.
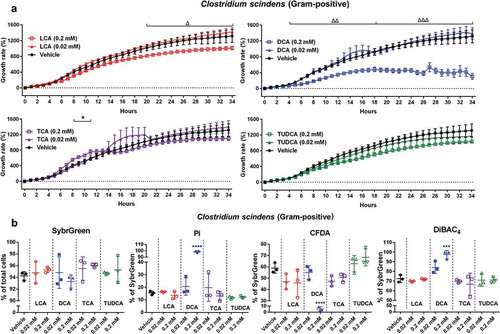
We also investigated the impact of bile acids using a well-characterized 7α-dehydroxylating bacteria Clostridium scindens (). The growth of Clostridium scindens was not impacted by TCA and TUDCA or lower dose (0.02 mM) of LCA and DCA (), which was in agreement with previous studies that reported Clostridium scindens is resistant to most primary and secondary bile acids in vitro.Citation17,Citation18 A higher dose (0.2 mM) of DCA significantly and rapidly reduced the growth of Clostridium scindens (), which was consistent with flow data showed significantly increased the proportions of damaged cells (Pi and DiBAC4-stained cells) and decreased CFDA-stained bacteria ().
Figure 5. The growth rate and physiological response of Clostridium scindens to bile acid exposure in vitro.
Bile acids rapidly influence cecal microbial community and physiology in vitro
Bacteria interact extensively with other microorganisms while responding to external stimuli from their environments. To understand the responses of bacterial communities to bile acid exposure, cecal bacteria from mice were isolated and incubated with three doses (0.2 mM, 2 mM, and 20 mM) of four bile acids for 4 h in an anaerobic chamber. Total quantitation of bacteria showed significant dose-dependent decreases after 4 h incubation of three doses of DCA, TCA, and TUDCA (). A significant decrease in the total bacterial population was observed with 20 mM of LCA exposure ().
Figure 6. The bacterial community and physiological response of isolated cecal bacteria to bile acid exposure in vitro.
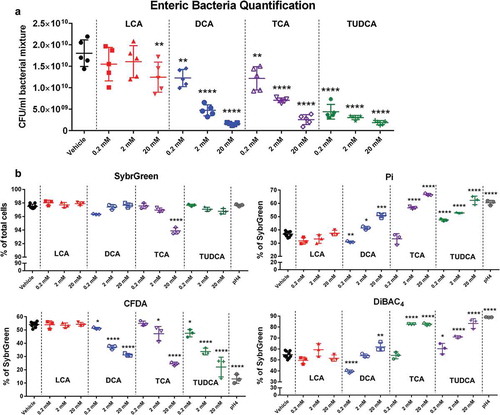
Short-term incubation of bile acids including DCA, TCA, and TUDCA significantly increased the proportions of damaged bacteria in a dose-dependent manner (increase from 36.9 ± 2.1% [vehicle] to 50.8 ± 1.6% [DCA 20 mM], 66.7 ± 0.8% [TCA 20 mM], and 62.3 ± 0.8% [TUDCA 20 mM]) (). DiBAC4 stained bacteria significantly increased from 54.8 ± 3.2% [vehicle] to 62.0 ± 3.9% [DCA 20 mM], 82.5 ± 1.1% [TCA 20 mM], and 83.2 ± 4.4% [TUDCA 20 mM] with bile acid exposure (). Furthermore, the significant dose-dependent decreases in CFDA-stained bacteria were observed with bile acid treatment (decrease from 54.1 ± 1.9% [vehicle] to 31.3 ± 1.1% [DCA 20 mM], 24.5 ± 1.2% [TCA 20 mM], and 22.1 ± 7.4% [TUDCA 20 mM]) (). The proportions of high nucleic acid (HNA) cells were also significantly decreased by DCA, TCA, and TUDCA treatment (Fig. S3). Interestingly, no significant changes in SybrGreen, Pi, CFDA, and DiBAC4 stained cells were observed with three doses of LCA treatment ( and Fig. S3).
Bile acids rapidly alter cecal microbial metabolism in vitro
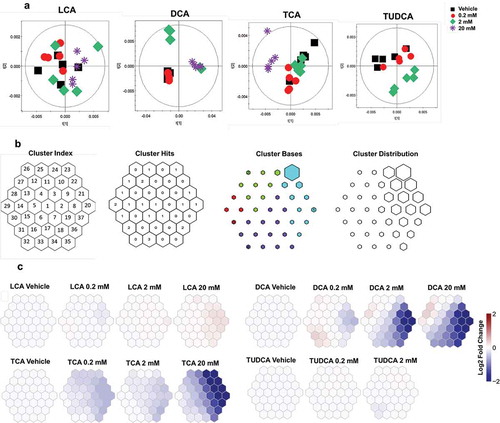
To further investigate the influence of bile acids on the cecal microbiota, 1H NMR and UPLC-MS-based metabolomics were used to monitor metabolic changes in cecal microbiota following 4 h bile acid exposure. Principal component analysis (PCA) score plots showed separation of the 1H NMR spectra obtained from cecal bacteria treated with different doses of DCA, TCA, and TUDCA compared to the vehicle (). However, no clear separations were observed in cecal metabolites with three doses of LCA exposure (). To visualize the patterns of metabolic perturbation associated with each bile acid, the log2 fold change values of target metabolites obtained from 1H NMR (Table S5) were assembled using self-organizing maps (SOM) and projected onto suprahexagonal landscapes (). This organizational pattern places the most influential metabolite nodes on the outer edge of the suprahexagon while preserving the input data information such as the dimensionality, distribution, distance, cluster, and identity of metabolites (). The SOMs clearly highlight the differential modes of actions for four bile acids (). DCA and TCA treatment showed similarities in their metabolic effects as revealed by the SOM clustering (). This metabolic effect was dominated by a dose-dependent reduction in several purine/pyrimidine metabolites and amino acids following DCA and TCA exposure (Table S5). Subtle changes in amino acid metabolism were observed with 2 mM of TUDCA exposure ( and Table S5). Consistent with our qPCR and flow cytometry data, LCA exposure showed no significant effect on these metabolic pathways, even at concentrations up to 20 mM ().
Figure 7. 1H NMR-based metabolomics analysis of isolated cecal bacteria in response to bile acid exposure in vitro.
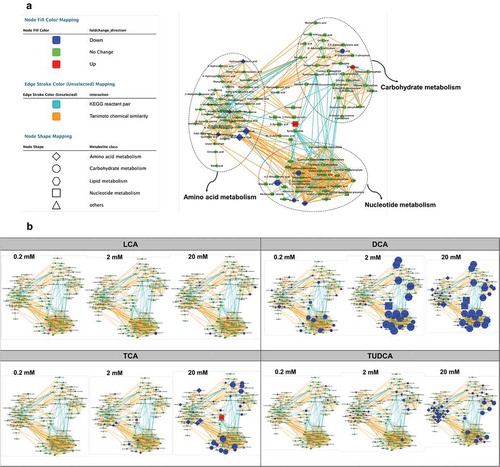
UPLC-MS analysis was also performed for orthogonal views of altered microbial metabolic pathways with bile acid exposure. Consistent with NMR data, the dose-dependent decreases in amino acid, nucleotide, and sugar metabolism folllowing DCA, TCA, and TUDCA-exposure were visualized using MetaMapp networks ( and Table S6). Furthermore, all three doses of DCA exposure resulted in marked decrease in amino acid, nucleotide, and sugar metabolism, suggesting that DCA impacts the cecal microbial metabolism even at 0.2 mM exposure (). Subtle decreases in amino acid levels were observed in bacteria with 20 mM of LCA exposure, whereas no significant effects were observed following exposure to LCA at 0.2 mM and 2 mM concentrations ().
Figure 8. UPLC-MS/MS-based metabolomics analysis of isolated cecal bacteria in response to bile acid exposure in vitro.
The effect of bile acids on cecal bacteria in vivo
Having investigated that bile acids inhibit gut microbiota in vitro, we evaluated if these effects were similarly exhibited in vivo. Here, we used an in vivo exposure model by gavaging one single dose of bile acids (LCA, DCA, or TCA; 100 mg/kg) to mice and further assessed the influence of 24 h exposure to these bile acids on the gut bacterial communities in vivo. Previous evidence demonstrated that bile acids are known as most potent endogenous ligands for nuclear receptors such as farnesoid X receptor (FXR), pregnane X receptor (PXR), and G protein-coupled receptor 5 (GPR5).Citation4,Citation12,Citation25,Citation26 mRNA expression of intestinal PXR target genes was significantly higher after LCA treatment but remained unchanged in the liver (Fig. S4). The significant decreased level of proglucagon mRNA expression was observed in liver after TCA treatment (Fig. S4), which was associated with TCA as a FXR activator.Citation27
The significantly changed bacterial physiological status characterized by increased Pi-stained cells and decreased CFDA-stained bacteria was observed in vivo with DCA and TCA exposure (). Consistent with the flow data, analysis of the microbial community after exposure to DCA and TCA revealed significant decreases in total bacterial population but no significant changes in major phyla and two Clostridium clusters ( and Fig. S5). To obtain the metabolic effect of bile acids on the bacteria in vivo, we quantified the levels of common bacterial metabolites in urine, cecal content, and feces samples ( and Fig. S6). Short-term DCA and TCA exposure resulted in significantly decreased levels of some microbial metabolites including urinary hippurate and cecal butyrate (). Our recent studies showed that reducing bile salt hydrolase (BSH)-expressing bacteria resulted in the accumulation of taurine-conjugated bile acids.Citation4 Analysis of bile acid composition showed significantly increased taurine-conjugated bile acid levels in liver and feces after 24 h exposure of DCA and TCA ( and Fig. S7), which was associated with the decreased fecal BSH activity (). No significant changes in taurine-conjugated bile acids were observed in feces after 1 h or 4 h of bile acid exposure (Fig. S7). Moreover, significantly higher levels of LCA were observed in feces after 4 h and 24 h after LCA gavage ( and S7B), which suggested that most LCA was excreted into feces after 4 h LCA gavage.Citation28 Significantly higher level of α muricholic acid in liver after 24 h of LCA gavage was also observed (), which indicated that small amounts of LCA were circulated to the liver and converted to primary bile acids such as muricholic acid.Citation28 Furthermore, we observed significantly higher levels of cholic acid (CA) in feces after 24 h of DCA gavage (), which suggested that most DCA was re-absorbed in the intestine and converted to primary bile acids such as CA.Citation28 Notably, LCA exposure failed to show any significant changes in bacterial community structure, physiology, or host metabolism in vivo ( and Fig. S5-7). Together, these results indicated that short-term exposure to DCA and TCA in vivo significantly affected bacterial physiology, structure, and host metabolism.
Figure 9. The response of cecal bacteria to bile acid exposure in vivo.
Discussion
We report a systematic approach to probe the interactions between bile acids and gut bacteria. We chose four bile acids that represent the major unconjugated and conjugated bile acids in mouse gut and used concentrations within the ranges of what is estimated to be found in the gut.Citation4 Further, we quantitatively profiled individual bacterial species, isolated cecal bacteria, and evaluated the cecal bacterial community in vivo in order to characterize the direct or indirect microbiome modulating activities of bile acids. Lastly, we combined at least three complementary techniques to describe the effects of bile acids on bacteria including measurements of bacterial growth rate, physiology, structure, and metabolism.
It is generally accepted that bile acid cytotoxicity including hepatotoxicity and antibacterial activity is directly proportional to their detergent effect, which is related to the hydrophobicity of the molecules.Citation2,Citation16,Citation29 LCA is a secondary monohydroxylated bile acid generally considered one of the most toxic bile acids.Citation29 Our findings support this point by showing the significant reduced growth of most individual bacterial species in vitro by LCA exposure. However, accumulating evidence showed that feeding DCA results in more hepatotoxicity in rats than feeding the same dose of LCA.Citation30,Citation31 Consistent with these observations,Citation30,Citation31 our data also showed that LCA exposure was less toxic to the bacterial community using in vivo and vitro models. This observation was revealed by less cellular damage, higher metabolic activity, and less reduction in bacterial metabolism with LCA compared to other bile acids in the cecal bacterial community. This could be partially explained by efficient detoxification of LCA by liver or intestinal bacteria (i.e. hydroxylationCitation32,Citation33) thus reducing its antibacterial activity. More work is needed to identify the factors responsible for reduced antibacterial activity of LCA in the cecal bacterial community.
Conjugated bile acids possess less potent antibacterial activity than unconjugated bile acids.Citation34 Both TCA and TUDCA were ineffective in inhibiting five individual bacterial species including Ruminococcus bromii, Bacteriodes fragilis, Lactobacillus paracasei, Bifidobacterium longum, and Clostridium scindens in this study. The reason for the weaker antimicrobial effect of conjugated bile acids might be partially attributed to the different structures between conjugated and unconjugated bile acids in that unconjugated bile acids passively cross membranes causing intracellular toxicity. Alternatively, conjugated bile acids remain in the outer hemi-leaflet of the membrane since they are fully ionized at physiological pH and cause toxicity only when a transporter is present in the cell membrane that permits conjugated bile acids to enter the cell.Citation2,Citation35
Gram-positive bacteria are reported to be more sensitive to the deleterious effects of bile acids than Gram-negative bacteria.Citation36,Citation37 Consistently, our data demonstrated that Ruminococcus bromii (Gram-positive) is more sensitive than Bacteriodes fragilis (Gram-negative) to bile acids as it showed lower bacterial growth rate, more cellular damage, lower metabolic activity, and more reduction in bacterial metabolism following bile acid exposure. Notably, the significant increased proportion of DiBAC4-stained cells in Ruminococcus bromii was observed after two doses of TCA and TUDCA exposure without any changes in growth rate, which indicated rapid and increased bacterial membrane disruption with bile acid exposure. A similar observation has been reported in antibiotic studies that shows more antibiotic resistance by Gram-negative bacteria.Citation38 These might be associated with differences in the cell wall structure between Gram-positive and Gram-negative bacteria in that Gram-negative bacteria have an outer membrane that could exclude antibiotics and other antibacterial compounds.Citation38
Bile acid tolerance is an important property for gut bacteria colonization. Probiotic bacteria must cope with the deleterious action of bile acids and survive the gastrointestinal tract. As two of the most extensively used probiotic bacteria for humans, strains of Lactobacillus and Bifidobacterium were selected and showed less sensitivity to bile acids in this study. Notably, the activation of bacterial glycolysis with a higher growth rate was observed in Bifidobacterium longum with short-term (around 4–5 h) conjugated bile acid exposure. This finding prompted the hypothesis that reorganization in global metabolism, notably an activation of central glycolysis, can activate responses against the detrimental action of bile acids, such as protein misfolding, fatty acid biosynthesis, and changes in the cell wall architecture.Citation21,Citation39 It is interesting to note that Lactobacillus paracasei and Bifidobacterium longum (also Gram-positive bacteria) showed more bile resistance than Gram-postive bacteria Ruminococcus bromii, which in previous studies, Ruminococcus bromii was more sensitive to drugs than the other two Gram-positive bacteria.Citation40 More work is needed to investigate the bile resistance mechanisms in these Gram-positivie probiotic bacteria.
The direct and extensive metabolic and physiologic responses of gut bacteria to bile acids exposure were explored in vitro and in vivo using MS- and NMR-based metabolomics combined with physiologic status analysis. In vitro, bacterial membrane disruption with significantly higher impaired membrane polarity (DiBAC-stained), compromised membrane integrity (Pi-stained), and disrupted lipid metabolism (glycerolipid metabolism and synthesis and degradation of ketone bodies) was observed in response to bile acid exposure, which is in agreement with detergent action of bile acids on lipid components.Citation20 Moreover, the rapid bacterial metabolic changes with amino acid biosynthesis and metabolism, citrate cycle, glycolysis, and pyrimidine metabolism were also observed in a dose-dependent manner with bile acid exposure in vitro, which is in agreement with the observation of reduced bacterial metabolic activity. In vivo, the antibacterial effect with increased damaged bacterial (Pi-stained) and decreased bacterial metabolic activity (CFDA-stained) was also observed with DCA and TCA exposure. Moreover, DCA and TCA exposure resulted in reduced levels of cecal butyrate and urine hippurate, two metabolites of microbial origin which are produced by Clostridium spp in vivo.Citation4,Citation41 Furthermore, the increased levels of taurine-conjugated bile acids were observed after 24 h DCA and TCA exposure, which is associated with a reduction in BSH-expressing bacteria and their BSH activity.Citation4,Citation5 Notably, consistent with the in vitro finding, no significant changes were observed in bacterial physiology, structure, or host metabolism with LCA exposure, suggesting inactivation effect of LCA by gut bacteria or liver. Collectively, these data suggest that bile acids directly and rapidly affected host metabolism through altering bacterial community structure in vitro and in vivo.
Materials and methods
Chemicals
Bile acid standards and deuterated internal standards were purchased from Sigma-Aldrich and Cayman Chemical. Bile acids including lithocholic acid (LCA), deoxycholic acid (DCA), taurocholic acid (TCA), and tauroursodeoxycholic acid (TUDCA) were suspended in 0.5% sodium carboxymethylcellulose (Sigma-Aldrich) for the in vivo study and brain heart infusion (Sigma-Aldrich) broth for the in vitro study. Four fluorescent dyes including SybrGreen, propidium iodide (Pi), bis-(1,3-dibutylbarbituric acid) trimethine oxonol (DiBAC4), and carboxyfluorescein diacetate (CFDA) were obtained from Sigma-Aldrich and Invitrogen.
In vitro bacterial culture and incubation
In vitro cecal microbiota isolation and incubation were adapted and modified from previous protocols.Citation42–Citation44 We screened the microbiome modulating activity of four bile acids including LCA, DCA, TCA, and TUDCA that represent some of the major unconjugated and taurine-conjugated bile acids in mouse gut.Citation4 Briefly, cecal content from C57BL/6 J male wild type mice was collected and diluted in brain heart infusion broth (1 g in 10 ml). The cecal suspensions were treated with three doses of LCA, DCA, TCA, and TUDCA including 0.2 mM, 2 mM, and 20 mM, which are within the range of what are estimated to be found in the mouse gut.Citation4 After 4 h incubation at 37°C, bacterial samples were stained for flow cytometry analysis or kept at −80°C for other analysis (). The positive control group was treated with HCl to achieve a final pH 4. All experiments were performed in a monitored anaerobic chamber and repeated at least twice.
Bacteriodes fragilis (638 R), Ruminococcus bromii (ATCC®27255TM), Lactobacillus paracasei (ATCC®25303TM), Bifidobacterium longum (ATCC®15707TM), and Clostridium scindens (ATCC®35704TM) were cultured and treated with two doses (0.02 mM and 0.2 mM) of LCA, DCA, TCA, and TUDCA (for more detailed methods about bacteria culture, see Supplemental Material). The optical density (OD600) was measured with a Multiskan Sky Microplate spectrophotometer (Thermo Fisher Scientific). The OD600 value of bacteria was diluted to 0.03 for initial OD600 based on the media. The growth rate of bacteria was calculated in the form of (Cn – C0)/C0, where C0 is the initial OD600 value and Cn is the OD600 value of n hours of bile acid exposure. Flow cytometry and metabolite analysis were performed after 4 h of bile acid incubation ().
Animals
All animal studies were performed using approved protocols by the Pennsylvania State University Institutional Animal Care and Use Committee. Male C57BL/6 J wild type mice were ordered from Jackson Laboratories. Twenty-four 7-week-old mice were randomly divided into four groups (n = 6). All mice were fasted 4 h and then administered LCA, DCA, and TCA by oral gavage (a final dose of 100 mg/kg). Feces were collected at different time points after bile acid treatment (1 h, 4 h, and 24 h). After 24 h, all mice were sacrificed and intestinal content and tissue samples were collected and kept at −80°C ().
Bile acid quantitation by UPLC-MS/MS
Targeted analysis of bile acids in feces and liver was performed using an Acquity UPLC system coupled with a Waters Xevo TQS mass spectrometer with an Acquity C8 BEH UPLC column (2.1 × 100 mm, 1.7 µm) (Waters). Liver (50 mg) and fecal samples (25 mg) were extracted with 1 ml methanol containing 0.5 µM deuterated internal standards followed by homogenization. Bile acids were quantified by multiple reaction monitoring and calculated using standard curves.Citation45
Bile salt hydrolase activity
Fecal bile salt hydrolase (BSH) activity was measured as described.Citation4 In brief, extracted fecal proteins were quantitated using Pierce BCA Protein Assay (Thermo Fisher Scientific) and incubated with CA-d4 and TCA-d4 at 37°C for 30 min. An equal volume of methanol was added into the reaction mixture and analyzed by a Waters Xevo TQS mass spectrometer.
Tissue RNA extraction and qPCR
RNA was extracted from liver and ileum tissues using TRIzol reagent (Invitrogen). A total of 1 µg RNA was used for cDNA synthesis using qScript cDNA SuperMix (Quanta Biosciences). qPCR reactions were performed using SYBR Green qPCR Master Mix on an ABI Prism 7900HT Fast Real-Time PCR sequence detection system (Applied Biosystems). Primers can be found in Table S7.
Flow cytometry analysis
After centrifugation of bacterial mixtures and species, the pellets were washed and resuspended with 1X reduced PBS containing 1 mg/ml L-cysteine. Bacterial samples were stained by four distinct dyes: SybrGreen I that stains all nucleic acids with different relative nucleic acid content (high nucleic acid: HNA; low nucleic acid: LNA), Pi that stains only dead or damaged cells, CFDA that stains for biochemical activity, DiBAC4 that stains for loss of membrane polarity.Citation42,Citation46 Stained samples were analyzed using a BD Accuri™ C6 flow cytometer (BD Biosciences) and results were analyzed with FlowJo V10 software (FlowJo, LLC).
1H NMR-based metabolomics experiments
Urine, cecal content, and bacteria suspension sample preparation for NMR were performed as previously described.Citation4,Citation47 1H NMR spectra of all samples were acquired at 298 K on a Bruker AVANCE NEO 600 MHz spectrometer equipped with a Bruker inverse cryogenic probe (Bruker Biospin). A typical 1D NMR spectrum named NOESYPR1D was acquired for each sample. A set of 2D NMR spectra were also acquired for NMR signal assignments. 1H NMR spectra processing and multivariate data analyses were performed as previously described.Citation48 Briefly, all 1H NMR spectra were manually adjusted for phase and baseline and calibrated using TopSpin 3.6 (Bruker Biospin). The spectra from δ 0.5 to 10.0 were bucketed into equal bins of 0.004 ppm using the AMIX 3.8 (Bruker Biospin) to discard the residual water region.
Multivariate data analysis was performed using the SIMCA 13.0.3 (Umetrics). Principal component analysis (PCA) was carried out to show intergroup differences. The metabolite levels from NMR data were used to determine the log2 fold changes relative to each bile acid compared to the vehicle group. The resulting log2 data were analyzed in R using the Suprahex package.Citation49,Citation50 This package trains a self-organizing map (SOM) and projects the data onto a two-dimensional suprahexagon. These suprahexagons arrange related metabolites within nodes, or small hexagons, that are further arranged based on meta-clustering within the larger hexagonal map. The map preserves the input information and provides the underlying cluster details. Additional esthetic changes were made in Adobe Illustrator (Adobe Inc.).
LC-MS-based metabolomics experiments
Bacteria sample preparation for LC-MS and data analysis was performed as previously described.Citation43 In brief, bacteria samples were extracted twice with 1 ml cold 50% methanol containing 1 µM chlorpropamide. After homogenization, the samples were freeze-thawed three times, followed by a centrifugation (22,000 rpm, 4°C for 10 min). The combined supernatants were dried in a vacuum and reconstituted in 60 μl of 3% methanol. After a centrifugation, 50 μl of supernatants was transferred to autosampler vials for LC-MS analysis.
Data were acquired using a Dionex Ultimate 3000 quaternary HPLC system (Thermo Fisher Scientific) coupled to ExactiveTM Plus Orbitrap mass spectrometer (Thermo Fisher Scientific) with a Hydro-RP C18 column (2.1 × 100 mm × 2.5 µm particle size; Phenomenex). LC-MS data were analyzed by MS-DIAL.Citation51 MetaMapp network analysis was used to visualize and integrate biochemical pathways and chemical similarities.Citation52,Citation53 Input of MetaMapp consists of PubChem ID, KEGG ID, SMILES, compound name, p-value, and fold change for each compound. If PubChem ID, KEGG ID and SMILES information of an identified metabolite is unknown, then names of compounds can be converted into those database identifiers and chemical structural information using the chemical translation service at Fiehn lab (https://cts.fiehnlab.ucdavis.edu) and PubChem Identifier Exchange Service (https://pubchem.ncbi.nlm.nih.gov/idexchange). Cytoscape is used for visualization of the network information from the MetaMapp package.Citation54 Here, class of metabolites is represented by different shapes of nodes and clustered in the network. The colors of each node such as red, green, and blue represent enriched, no change, or depleted compared to the control group, respectively. The size of the node is calculated from fold-change. Edge of the network is determined by either KEGG reaction pathway or Tanimoto chemical similarity.
Gut microbiota analysis
Bacteria DNA from bacteria mixture and cecal content was extracted using E.Z.N.A.® stool DNA kit (Omega Bio-Tek Inc.). Targeted qPCR analysis was performed using primers (Table S8) with an ABI Prism 7900HT Fast Real-Time PCR sequence detection system (Quanta Biosciences). Total bacteria quantification was calculated using a standard curve.Citation43 For relative specific bacterial quantification, results were normalized to 16 S ribosomal DNA sequences.
For individual bacterial culture identification, bacterial DNA was normalized to 10 ng/μl with a NanoDrop UV–Vis Spectrophotometer Lite (Thermo Fisher Scientific). The V4 region of the 16 S Ribosomal RNA gene of the normalized bacterial DNA was then amplified with 515 (forward) and 806 (Reverse) primers on a T100 Thermal Cycler (Bio-Rad Laboratories). The PCR conditions were as followed 1 cycle at 98°C [2 min]; 25 cycles of 98°C [10 secs], 56.6°C [20 secs], 72°C [15 secs]; and 1 cycle at 72°C [5 min]. After amplification, 20 μl of the product was run on a 1x agarose gel and a UV light box was used to identify the 350 BP amplified region. This 350 BP region was excised and the QIAquick Gel Extraction kit (QIAGEN) was used to extract the cleaned, amplified bacterial DNA from the gel. The concentration of the cleaned bacterial DNA amplicons was checked on the NanoDrop UV–Vis Spectrophotometer Lite (Thermo Fisher Scientific). Concentrations were ~20 ng/μl for each bacterial culture. Cleaned bacterial amplicons were sent to the Pennsylvania State University Genomics Core Facility for Sanger sequencing. The resulting Sanger sequences for each bacterial culture were then analyzed with BLAST for bacterial culture identification (Table S9).
Statistics
Values are expressed by mean ± standard deviation (SD) or median and interquartile ranges. Graphical illustrations and statistical analyses were carried out using GraphPad Prism 6.0 (GraphPad). One-way analysis of variance (ANOVA) followed by Dunnett’s multiple comparisons was used.
Disclosure of Potential Conflicts of Interest
No potential conflicts of interest were disclosed.
Supplemental Material
Download MS Word (1.8 MB)Supplementary Material
Supplemental data for this article can be accessed on the publisher’s website.
Additional information
Funding
References
- Wahlstrom A, Sayin SI, Marschall HU, Backhed F. Intestinal crosstalk between bile acids and microbiota and its impact on host metabolism. Cell Metab. 2016;24:41–50. doi:10.1016/j.cmet.2016.05.005.
- Urdaneta V, Casadesus J. Interactions between bacteria and bile salts in the gastrointestinal and hepatobiliary tracts. Front Med. 2017;4:163.
- Ma C, Han MJ, Heinrich B, Fu Q, Zhang QF, Sandhu M, Agdashian D, Terabe M, Berzofsky JA, Fako V, et al. Gut microbiome-mediated bile acid metabolism regulates liver cancer via NKT cells. Science. 2018;360:eaan5931.
- Tian Y, Cai J, Gui W, Nichols RG, Koo I, Zhang J, Anitha M, Patterson AD. Berberine directly affects the gut microbiota to promote intestinal farnesoid X receptor activation. Drug Metab Dispos. 2019;47:86–93. doi:10.1124/dmd.118.083691.
- Begley M, Hill C, Gahan CGM. Bile salt hydrolase activity in probiotics. App Environ Microb. 2006;72:1729–1738. doi:10.1128/AEM.72.3.1729-1738.2006.
- Li F, Jiang CT, Krausz KW, Li YF, Albert I, Hao HP, Fabre KM, Mitchell JB, Patterson AD, Gonzalez FJ. Microbiome remodelling leads to inhibition of intestinal farnesoid X receptor signalling and decreased obesity. Nat Commun. 2013;4:1–10.
- Ridlon JM, Harris SC, Bhowmik S, Kang DJ, Hylemon PB. Consequences of bile salt biotransformations by intestinal bacteria. Gut Microbes. 2016;7:22–39. doi:10.1080/19490976.2015.1127483.
- Lorenzo-Zuniga V, Bartoli R, Planas R, Hofmann AF, Vinado B, Hagey LR, Hernández JM, Mañé J, Alvarez MA, Ausina V, et al. Oral bile acids reduce bacterial overgrowth, bacterial translocation, and endotoxemia in cirrhotic rats. Hepatology. 2003;37:551–557. doi:10.1053/jhep.2003.50116.
- Inagaki T, Moschetta A, Lee YK, Peng L, Zhao GX, Downes M, Yu RT, Shelton JM, Richardson JA, Repa JJ, et al. Regulation of antibacterial defense in the small intestine by the nuclear bile acid receptor. P Natl Acad Sci USA. 2006;103:3920–3925. doi:10.1073/pnas.0509592103.
- Makishima M, Okamoto AY, Repa JJ, Tu H, Learned RM, Luk A, Hull MV, Lustig KD, Mangelsdorf DJ, Shan B. Identification of a nuclear receptor for bile acids. Science. 1999;284:1362–1365. doi:10.1126/science.284.5418.1362.
- Parks DJ, Blanchard SG, Bledsoe RK, Chandra G, Consler TG, Kliewer SA, Stimmel JB, Willson TM, Zavacki AM, Moore DD, et al. Bile acids: natural ligands for an orphan nuclear receptor. Science. 1999;284:1365–1368. doi:10.1126/science.284.5418.1365.
- Wang HB, Chen J, Hollister K, Sowers LC, Forman BM. Endogenous bile acids are ligands for the nuclear receptor FXR BAR. Mol Cell. 1999;3:543–553. doi:10.1016/S1097-2765(00)80348-2.
- Binder HJ, Filburn B, Floch M. Bile-acid inhibition of intestinal anaerobic organisms. Am J Clin Nutr. 1975;28:119–125. doi:10.1093/ajcn/28.2.119.
- Kishinaka M, Umeda A, Kuroki S. High-concentrations of conjugated bile-acids inhibit bacterial growth of Clostridium perferingens and induce its extracellular cholyglycine hydrolase. Steroids. 1994;59:485–489. doi:10.1016/0039-128X(94)90062-0.
- Kurdi P, Kawanishi K, Mizutani K, Yokota A. Mechanism of growth inhibition by free bile acids in Lactobacilli and Bifidobacteria. J Bacteriol. 2006;188:1979–1986. doi:10.1128/JB.188.5.1979-1986.2006.
- Sung JY, Shaffer EA, Costerton JW. Antibacterial activity of bile salts against common biliary pathogens-effects of hydrophobicity of the molecule and in the presence of phospholipids. Digest Dis Sci. 1993;38:2104–2112. doi:10.1007/BF01297092.
- Marion S, Studer N, Desharnais L, Menin L, Escrig S, Meibom A, Hapfelmeier S, Bernier-Latmani R. In vitro and in vivo characterization of Clostridium scindens bile acid transformations. Gut Microbes. 2019;10:481–503. doi:10.1080/19490976.2018.1549420.
- Kang JD, Myers CJ, Harris SC, Kakiyama G, Lee IK, Yun BS, Matsuzaki K, Furukawa M, Min HK, Bajaj JS, et al. Bile acid 7 alpha-dehydroxylating gut bacteria secrete antibiotics that inhibit clostridium difficile: role of secondary bile acids. Cell Chem Biol. 2019;26:27–34. doi:10.1016/j.chembiol.2018.10.003.
- Ridlon JM, Devendran S, Alves JM, Doden H, Wolf PG, Pereira GV, Ly L, Volland A, Takei H, Nittono H, et al. The ‘in vivo lifestyle’ of bile acid 7α-dehydroxylating bacteria: comparative genomics, metatranscriptomic, and bile acid metabolomics analysis of a defined microbial community in gnotobiotic mice. Gut Microbes. 2019;9:1–24. doi:10.1080/19490976.2019.1618173.
- Perez MJ, Briz O. Bile-acid-induced cell injury and protection. World J Gastroentero. 2009;15:1677–1689. doi:10.3748/wjg.15.1677.
- Ruiz L, Margolles A, Sanchez B. Bile resistance mechanisms in Lactobacillus and Bifidobacterium. Front Microbiol. 2013;4:396.
- Hyronimus B, Le Marrec C, Sassi AH, Deschamps A. Acid and bile tolerance of spore-forming lactic acid bacteria. Int J Food Microbiol. 2000;61:193–197. doi:10.1016/S0168-1605(00)00366-4.
- Sun LL, Xie C, Wang G, Wu Y, Wu Q, Wang XM, Liu J, Deng Y, Xia J, Chen B, et al. Gut microbiota and intestinal FXR mediate the clinical benefits of metformin. Nat Med. 2018;24:1919–1929. doi:10.1038/s41591-018-0222-4.
- Ze XL, Duncan SH, Louis P, Flint HJ. Ruminococcus bromii is a keystone species for the degradation of resistant starch in the human colon. Isme J. 2012;6:1535–1543. doi:10.1038/ismej.2012.4.
- Staudinger JL, Goodwin B, Jones SA, Hawkins-Brown D, MacKenzie KI, Latour A, Liu Y, Klaassen CD, Brown KK, Reinhard J, et al. The nuclear receptor PXR is a lithocholic acid sensor that protects against liver toxicity. P Natl Acad Sci USA. 2001;98:3369–3374. doi:10.1073/pnas.051551698.
- Ridlon JM, Bajaj JS. The human gut sterolbiome: bile acid-microbiome endocrine aspects and therapeutics. Acta Pharm Sin B. 2015;5:99–105. doi:10.1016/j.apsb.2015.01.006.
- Trabelsi MS, Daoudi M, Prawitt J, Ducastel S, Touche V, Sayin SI, Perino A, Brighton CA, Sebti Y, Kluza J, Briand O, et al. Farnesoid X receptor inhibits glucagon-like peptide-1 production by enteroendocrine L cells. Nat Commun. 2015;6:7629.
- Chiang JYL. Bile acid metabolism and signaling. Compr Physiol. 2013;3:1191–1212.
- Attili AF, Angelico M, Cantafora A, Alvaro D, Capocaccia L. Bile acid-induced liver toxicity-relation to the hydrophobichydrophilic balance of bile acids. Med Hypotheses. 1986;19:57–69. doi:10.1016/0306-9877(86)90137-4.
- Delzenne NM, Calderon PB, Taper HS, Roberfroid MB. Comparative hepatotoxicity of cholic acid, deoxycholic acid and lithocholic acid in the rat-in vivo and in vitro studies. Toxicol Lett. 1992;61:291–304. doi:10.1016/0378-4274(92)90156-E.
- Tsuda H, Masui T, Imaida K, Fukushima S, Ito N. Promotive effect of primary and secondary bile acids on the induction of Gamma-glutamyl-transferase transpeptidase-positive liver-cell foci as a possible endogenous factor for hepatocarcinogensis in rats. Gann. 1984;75:871–875.
- Hofmann AF. Detoxification of lithocholic acid, a toxic bile acid: relevance to drug hepatotoxicity. Drug Metab Rev. 2004;36:703–722. doi:10.1081/DMR-200033475.
- Carey JB, Williams G. Metabolism of lithocholic acid in bile fistula patients. J Clin Invest. 1963;42:450-&. doi:10.1172/JCI104733.
- Sannasiddappa TH, Lund PA, Clarke SR. In Vitro antibacterial activity of unconjugated and conjugated bile salts on staphylococcus aureus. Front Microbiol. 2017;8:1581.
- Hofmann AF. The continuing importance of bile acids in liver and intestinal disease. Arch Intern Med. 1999;159:2647–2658. doi:10.1001/archinte.159.22.2647.
- Bustos AY, de Valdez GF, Fadda S, Taranto MP. New insights into bacterial bile resistance mechanisms: the role of bile salt hydrolase and its impact on human health. Food Res Int. 2018;112:250–262. doi:10.1016/j.foodres.2018.06.035.
- Begley M, Gahan CGM, Hill C. The interaction between bacteria and bile. FEMS Microbiol Rev. 2005;29:625–651. doi:10.1016/j.femsre.2004.09.003.
- Miller SI. Antibiotic resistance and regulation of the gram-negative bacterial outer membrane barrier by host innate immune molecules. Mbio. 2016;7:e01541–16.
- Sanchez B, Champomier-Verges MC, Stuer-Lauridsen B, Ruas-Madiedo P, Anglade P, Baraige F, de Los Reyes-gavilan CG, Johansen E, Zagorec M, Margolles A, et al. Adaptation and response of Bifidobacterium animalis subsp lactis to bile: a proteomic and physiological approach. Appl Environ Microbiol. 2007;73:6757–6767. doi:10.1128/AEM.00637-07.
- Maier L, Pruteanu M, Kuhn M, Zeller G, Telzerow A, Anderson EE, Brochado AR, Fernandez KC, Dose H, Mori H, et al. Extensive impact of non-antibiotic drugs on human gut bacteria. Nature. 2018;555:623-+. doi:10.1038/nature25979.
- Tian Y, Nichols RG, Cai JW, Patterson AD, Cantorna MT. Vitamin A deficiency in mice alters host and gut microbial metabolism leading to altered energy homeostasis. J Nutr Biochem. 2018;54:28–34. doi:10.1016/j.jnutbio.2017.10.011.
- Maurice CF, Turnbaugh PJ. Quantifying and identifying the active and damaged subsets of indigenous microbial communities. In: DeLong EF, editor. Microbial metagenomics, metatranscriptomics, and metaproteomics. Methods in Enzymology. 2013. p. 91–107.
- Cai JW, Nichols RG, Koo I, Kalikow ZA, Zhang LM, Tian Y, Zhang J, Smith PB, Patterson AD. multiplatform physiologic and metabolic phenotyping reveals microbial toxicity. Msystems. 2018;3:e00123–18.
- Maurice CF, Haiser HJ, Turnbaugh PJ. Xenobiotics shape the physiology and gene expression of the active human gut microbiome. Cell. 2013;152:39–50. doi:10.1016/j.cell.2012.10.052.
- Sarafian MH, Lewis MR, Pechlivanis A, Ralphs S, McPhail MJW, Patel VC, Dumas M-E, Holmes E, Nicholson JK. Bile acid profiling and quantification in biofluids using ultra-performance liquid chromatography tandem mass spectrometry. Anal Chem. 2015;87:9662–9670. doi:10.1021/acs.analchem.5b01556.
- Kolek J, Branska B, Drahokoupil M, Patakova P, Melzoch K. Evaluation of viability, metabolic activity and spore quantity in clostridial cultures during ABE fermentation. FEMS Microbiol Rev. 2016;363: 1–7.
- Shi XH, Xiao CN, Wang YL, Tang HR. Gallic acid intake induces alterations to systems metabolism in rats. J Proteome Re. 2013;12:991–1006. doi:10.1021/pr301041k.
- Tian Y, Zhang LM, Wang YL, Tang HR. Age-related topographical metabolic signatures for the rat gastrointestinal contents. J Proteome Res. 2012;11:1397–1411. doi:10.1021/pr2011507.
- Fang H, Gough J. supraHex: an R/Bioconductor package for tabular omics data analysis using a supra-hexagonal map. Biochem Bioph Res Comm. 2014;443:285–289. doi:10.1016/j.bbrc.2013.11.103.
- Allman EL, Painter HJ, Samra J, Carrasquilla M, Llinas M. metabolomic profiling of the malaria box reveals antimalarial target pathways. Antimicrob Agents Chemother. 2016;60:6635–6649. doi:10.1128/AAC.01224-16.
- Tsugawa H, Cajka T, Kind T, Ma Y, Higgins B, Ikeda K, Kanazawa M, VanderGheynst J, Fiehn O, Arita M, et al. MS-DIAL: data-independent MS/MS deconvolution for comprehensive metabolome analysis. Nat Methods. 2015;12:523-+. doi:10.1038/nmeth.3393.
- Barupal DK, Haldiya PK, Wohlgemuth G, Kind T, Kothari SL, Pinkerton KE, Fiehn O. MetaMapp: mapping and visualizing metabolomic data by integrating information from biochemical pathways and chemical and mass spectral similarity. BMC Bioinf. 2012;13:99.
- Hartman AL, Lough DM, Barupal DK, Fiehn O, Fishbein T, Zasloff M, Eisen JA. Human gut microbiome adopts an alternative state following small bowel transplantation. P Natl Acad Sci USA. 2009;106:17187–17192. doi:10.1073/pnas.0904847106.
- Shannon P, Markiel A, Ozier O, Baliga NS, Wang JT, Ramage D, Amin N, Schwikowski B, Ideker T. Cytoscape: A software environment for integrated models of biomolecular interaction networks. Genome Res. 2003;13:2498–2504. doi:10.1101/gr.1239303.