
ABSTRACT
There is a gap in measured microbial diversity when comparing genomic sequencing techniques versus cultivation from environmental samples in a laboratory setting. Standardized methods in artificial environments may not recapitulate the environmental conditions that native microbes require for optimal growth. For example, the intestinal tract houses microbes at various pH values as well as minimal oxygen and light environments. These microbes are also exposed to an atypical source of carbon: dietary fiber compacted in fecal matter. To investigate how the addition of insoluble fiber to isolation media could affect the cultivation of microbes from zebrafish intestines, an isolate library was built and analyzed using the bioinformatics pipeline IDBac. While all isolation media encouraged the growth of species from several phyla, the extent of growth was greater with the addition of fiber allowing for easier isolation. Furthermore, fiber addition altered the metabolism of the cultivated gut-derived microbes and induced the production of unique metabolites that were not produced when microbes were otherwise grown on standard isolation media. Addition of this inexpensive carbon source to the media supported the cultivation of a diverse community whose secondary metabolite production may more closely replicate their metabolite production in vivo.
Introduction
Dubbed in 1932 as “the great plate count anomaly,” Razumov et al. noted that there was a large discrepancy between the viable plate count of aquatic bacteria on Petri dishes compared to direct microscopic counts from the same environmental habitat.Citation1 As more researchers reiterated the lack of a diverse community in vitro, confirming the phenomenon, a need for modifications in the cultivation process was imperative to improve isolation. Over the past 40 years, scientists searched for alternative strategies to increase the diversity of microbes isolated from environmental samples in a laboratory setting.
Accompanying this anomaly, one of the biggest challenges the field of natural products faces is the frequent rediscovery of known small molecules from environmental samples.Citation2 Since the discovery of penicillin over 75 years ago, workflows which include cultivation of select genera mainly based on morphological features or 16S rRNA followed by bioassay-guided fractionation have been used to continue searching for new drug candidates and/or scaffolds.Citation3 This workflow has been historically successful in elucidating novel secondary metabolites produced in high titer by environmental microbes. However, advances in technologies such as bioinformatics, mass spectrometry, proteomics, and synthetic biology have improved our ability to identify bioactive metabolites that are produced in low titers. A distinct limitation of these methods, however, is their inability to detect or predict novel metabolites while also assessing taxonomic diversity.Citation3 Therefore, it is important to consider how changes in cultivation techniques, such as altering carbon sources, can influence both the isolation of specific microbes and the abundance and variety of metabolites produced. There are numerous variables that can be altered such as pH, salinity, temperature, oxygen levels, incubation time, and carbon and nitrogen substrates to create an in vitro environment that better represents the in vivo environment.Citation4 Microbes have evolved to live in niche environments and their survival is dependent on the available simple or complex carbon and nitrogen substrates. Therefore, if a laboratory medium is lacking the main organic substrates that a microbe has evolved to use, this may help contribute to the plate count anomaly as the microbe may fail to grow in vitro. One of the earliest examples in altering the carbon substrate in a medium is the addition of the water-insoluble fraction of Alfalfa hay to Petri dishes. This addition leads to an increase in colony counts of the microbes that colonize the rumen of cattle.Citation5 Others contain substrates such as glass or cotton-fibers as an alternative for agar to evade fluctuating seaweed prices.Citation6,Citation7 Altering carbon sources gained further attention in the mid-2000s with reports that modifying the organic carbon substrate in media recipes altered microbe growth and sporulation of environmental isolates.Citation8,Citation9 This catalyzed a variety of studies that altered media to increase bacterial production of pharmaceutically relevant molecular classes, escalate potential biodiesel sources, as well as encourage the growth of specific bacterial species from animal microbiomes.Citation10-Citation12 This research solidified the foundation for what is now common practice to utilize several media when attempting to cultivate microbes from environmental samples (Figure S1). Recent studies have revealed that utilizing different organic carbon substrates can alter bacterial metabolism, leading to the discovery of novel compounds and potential biofilm inhibitors.Citation13,Citation14
Taking these developments into consideration, we were interested in cultivating the zebrafish gut microbiome to build a library of bacteria for a natural products discovery workflow. When considering the native environment of vertebrate intestines, the main components of the system include the dietary nutrients entering the system for digestion and the indigestible nutrients that represent the fecal matter. Therefore, for microbes living in the intestinal tract, dietary fiber may serve as a large resource of nutrients and carbon. We found that the addition of organic insoluble fiber to the nutrient-limited medium led to an increase in the number of colonies observed on isolation plates as well as an increase in the diversity of colony morphologies.
Using the high-throughput bioinformatics pipeline IDBac, we isolated and analyzed 118 individual colonies from the zebrafish gut microbiomeCitation15. IDBac analysis showed that our cultivation technique generated a taxonomically diverse library. In this study, we show that the addition of insoluble fiber to low nutrient agar can increase the number of microbes isolated from vertebrate intestines and also alters the secondary metabolite production of bacterial isolates which may be more reflective of in vivo production in an in vitro environment.
Results
Addition of insoluble fiber to low nutrient agar plates increases bacterial growth
To cultivate gut-derived microbes from zebrafish intestines, four types of agar media were used to target both fast and slow growing bacteria. Plates varied in nutrient density with humic acid-vitamin freshwater (HVF), Gause modified freshwater (GMF), simple nutrient freshwater (SNF) + fiber, and SNF, decreasing in nutrient density, respectively ().Citation9,Citation16 Over 100 individual colonies were isolated over 3 months of growth to construct a zebrafish gut microbiome library. Addition of fiber to the nutrient-limited medium (SNF) led to a 1.7-fold increase in bacterial colony growth, surpassing the highest nutrient medium (HVF). Dissection of two healthy zebrafish intestines and two plating techniques in triplicate led to the isolation of 23, 38, 36, and 21 individual colonies from the HVF, GMF, SNF + fiber, and SNF plates, respectively.
IDBac analysis reveals that the addition of insoluble fiber supports an equally diverse cultivation of gut microbes as traditionally nutrient-rich media
Library isolates were prepared for bioinformatics analysis using IDBac, a matrix-assisted laser desorption/ionization time-of-flight (MALDI-TOF) mass spectrometry pipeline that allows for rapid analysis of microbial proteins and secondary metabolites.Citation15,Citation17 The standard IDBac workflow uses a 70% aqueous formic acid solution to lyse cells but we found that this procedure was not efficient at lysing the more mucoid bacterial colonies isolated.Citation17 A trifluoroacetic acid (TFA) extraction prior to plating samples for analysis was the most effective method to consistently collect viable MS fingerprint profiles for IDBac analysis.Citation18 Measuring proteins in the 3,000 to 15,000 Da range, IDBac organized the microbial isolates into a pseudo-phylogeny dendrogram based on MS fingerprint protein similarity.Citation15 highlights 82 of the 118 bacterial isolates from our library. 16S rRNA sequencing was performed on a subset of isolates. In tandem, these analyses confirmed the generated library is diverse containing a minimum of 15 identified species within three phyla: Actinobacteria, Proteobacteria, and Firmicutes.
Metabolite association network highlights changes in metabolite production with different carbon sources
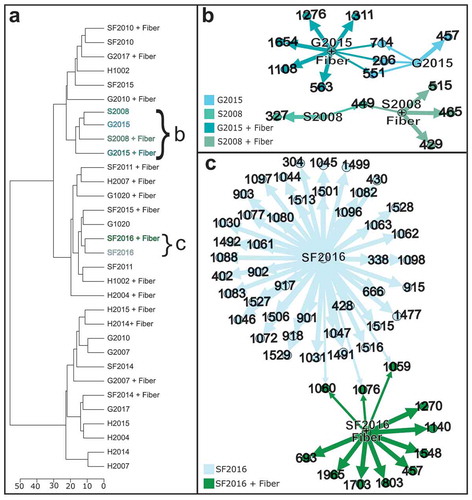
The IDBac pipeline also generates metabolite association networks for rapid visualization of metabolite production and allows for a simple comparison between bacterial isolates grown in different conditions.Citation17 ) shows a dendrogram highlighting 16 isolates that were grown on ISP2 agar, commonly used for lab cultivation, or SNF + fiber agar plates.Citation20 In a metabolite association network, nodes correspond to ions detected in a sample and the relationships between production across strains or conditions are visualized as arrows connecting nodes. The metabolite association networks of two isolates (); G2015 and S2008) imply that both have unique secondary metabolite production potential and when grown on agar supplemented with fiber, there is an increase in the unique secondary metabolites detected. The metabolite association network for isolate SF2016 ()), which was cultivated from an SNF + Fiber plate, is a robust producer of secondary metabolites. Interestingly, when comparing the two conditions, there is a larger number of nodes detected when grown without fiber.
Figure 1. Diversity plates of isolated gut microbes. Using four types of agar, we observed a significant increase in bacterial growth in plates supplemented with insoluble fiber. The amount of growth observed in fiber-supplemented plates (SNF + Fiber) was equivalent to that documented in Gause modified freshwater plates (GMF).
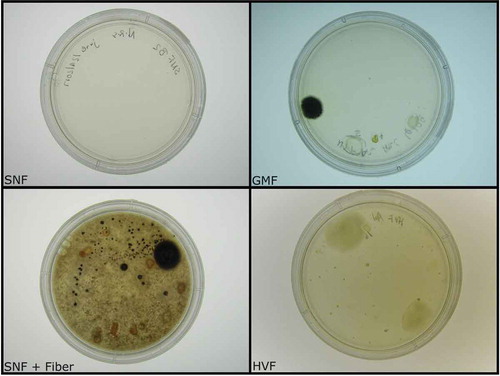
Figure 2. IDBac constructed dendrogram of cultivated bacterial isolates from the zebrafish gut. Our library is composed of over 80 isolates covering three phyla. To generate the IDBac dendrogram the following analysis settings were used: percent presence: 70, Signal-to-noise ratio: 4, Lower mass cutoff: 3,000, Upper mass cutoff: 15,0000, ppm tolerance: 1000. Distance algorithm: euclidean, Clustering algorithm: ward.D2, used presence/absence setting for dendrogram grouping.
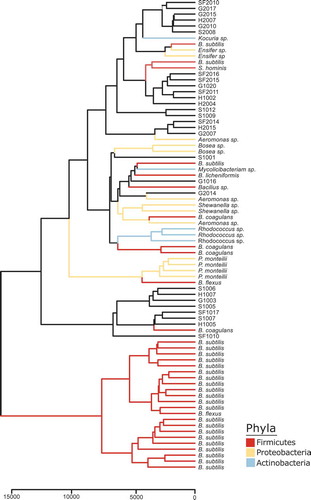
Figure 3. Comparison of metabolite production with and without fiber. (a) IDBac dendrogram of 16 isolates grown with or without fiber. (b) Metabolite association network of isolates S2008 and G2015 grown with and without fiber. (c) Metabolite association network of isolate SF2016 comparing the metabolites produced when grown with or without fiber. Any m/z nodes corresponding to matrix or agar controls were subtracted prior to analysis. To generate the metabolite association networks the analysis settings used were as follows: percent presence: 70, Signal to noise: 4, Lower mass cutoff: 200, Upper mass cutoff: 20000, ppm tolerance: 1000. Rather than displaying the metabolite association network for the entire dendrogram, specific samples were highlighted and the corresponding metabolite association network was downloaded to visualize in open graph platform Gephi (version 0.9.2) using the Yifan Hu layout.Citation19
Growth of gut microbes with insoluble fiber significantly increases the number of unique metabolites produced
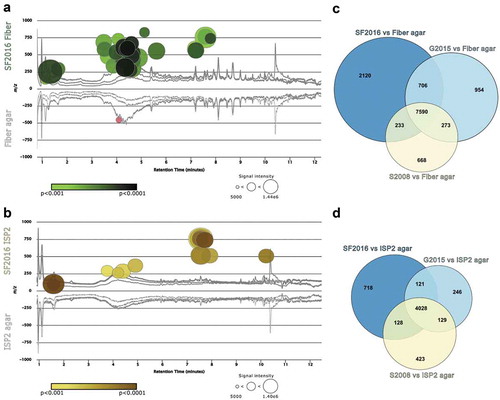
High-resolution liquid chromatography mass spectrometry (HR-LC-MS) of bacterial extracts from library isolates, SF2016, G2105, and S2008, grown on fiber or ISP2 agar was analyzed using XCMS, a metabolomic platform for statistical analyses of HR-LC-MS data. Through pairwise comparisons, XCMS determines features (ion and retention time pair) that are significantly upregulated in one chromatogram versus another and visualizes these differences via a cloud plot (p < 0.001, ). Features that are upregulated (compared to agar control) are denoted by a circle whose diameter corresponds to the intensity (relative abundance) of the signal. Signals with an intensity lower than 5,000 were excluded to ensure data analysis only included signals that were above the signal-to-noise ratio (6:1). The shading of each circle corresponds to the p-value associated with the signal. In , signals with p < 0.001 or lower were reported to represent significant metabolites produced by these gut-derived microbes. The shading of a circle denotes varying p values such that the lighter shade represents signals with a p < 0.001 and the darker shade represents signals with a p < 0.0001. The cloud plot in ) highlights 49 features that are significantly upregulated by SF2016 when grown on fiber agar versus the 15 features observed when grown on ISP2 (p < 0.001; )). If the significance threshold is relaxed to a p < 0.01, the number of significant features between these two conditions is 174 and 49, respectively (Figure S3). Regardless of the threshold set for significance, SF2016 consistently yields threefold or more features when grown on medium supplemented with insoluble fiber.
The same trend holds with isolate G2015 with an increase in unique metabolite production when grown on fiber agar (p < 0.001; Figure S4). Interestingly, though S2008 does show unique metabolite production when grown on fiber agar, the cloud plot does not support that the addition of fiber led to an increase in the number of metabolites produced, as observed in previous strains (p < 0.001; Figure S5). Using XCMS meta-analysis, the number of significant features produced by the three isolates is organized into a Venn diagram to visualize the number of features unique to a specific isolate or shared between two or more ()). When comparing the number of features produced by SF2016, G2015, and S2008 on fiber agar versus ISP2, the isolates had a 3.2, 3.3, and 1.5 fold change in features from growth with insoluble fiber.
Discussion
Microbial libraries for high-throughput drug discovery screening are typically generated using two to six isolation media, varying in nutrient density, which select for fast or slow growing bacteria from an environmental sample.Citation21-Citation24 To generate a diverse library of gut-derived cultivable microbes from the zebrafish intestine as well as capture the unique metabolite production of this community, it is important to consider the carbon source(s) in the media. With dietary fiber being a highly abundant substrate for microbes colonizing the intestines, a fourth type of medium was utilized that incorporated the addition of insoluble fiber into SNF (nutrient-limited medium). Using four types of media varying from high nutrient density to low, HVF, GMF, SNF + Fiber, and SNF, respectively, 118 bacterial colonies were isolated to constitute a zebrafish gut microbiome library (). The addition of wet-autoclaved insoluble fiber (20 g/L) led to an increase in the growth of individual bacterial colonies (Table S1). The highest yield of bacterial isolates was collected from the average nutrient medium (GMF) however, the addition of fiber to the SNF medium lead to nearly an identical isolate yield (Table S1). Of note, the addition of fiber is a minimal and inexpensive addition compared to media typically used in environmental isolations (Table S2).
The potential taxonomic and secondary metabolite diversity of the cultivated isolates were assessed to confirm whether the isolates matched previous metagenomic sampling studies.Citation25,Citation26 To investigate the newly generated library, a bioinformatics platform known as IDBac was used to characterize the isolates. The IDBac workflow and software were designed to rapidly collect protein and secondary metabolite profiles of microbial libraries produced from environmental samples utilizing a MALDI-TOF mass spectrometer.Citation15,Citation17 Of the 118 isolates, 82 were examined using the IDBac workflow to organize the microbial library (). The remaining 36 isolates were not analyzed due to either poor data quality collection during MALDI-TOF MS analysis or failure to recultivate from the initial glycerol stock (Table S1). Based on the MS protein fingerprints of the isolates, the newly constructed library represents three phyla. However, a number of isolates did not group into distinct branches nor with the IDBac in-house library that is built primarily from freshwater sponge-isolates,Citation15 cheese microbes,Citation27 and wild fish gut-derived microbes.Citation22 Therefore, 16S rRNA sequencing on a subset of isolates in this library was performed to confirm the identity of the isolates and provide insight toward whether the cultivation efforts did support the growth of a diverse, gut microbe library (Table S3). Addition of taxonomic information gathered from 16S rRNA sequencing analysis to supports the groupings formed from IDBac analysis.
Metagenomic studies of zebrafish intestines have shown that adults are colonized by a multitude of bacteria with γ-Proteobacteria, Firmicutes, and Fusobacteria as the most abundant members.Citation25,Citation26 16S rRNA sequence analysis confirmed our cultivation strategy produced a library that accurately represents the major components of the zebrafish gut microbiome with representatives from the Firmicutes, Actinobacteria, and Proteobacteria phyla (). Bacteria from the three phyla have been linked to the gut and overall organism health. Firmicutes typically colonize the large intestines, primarily the colon, and are one of the most prevalent phyla represented in the gut microbiome.Citation28 They have documented roles in the fermentation of carbohydrates as well as lipid droplet formation for energy storage.Citation29,Citation30 In our dendrogram, we observe the same trend with a considerable number of our isolates grouped into the Firmicutes phylum (). Of the Firmicutes isolated, B. subtilis was the most abundant isolate in this phylum. During its lifecycle in the gut, B. subtilis is known to form spores in half the time it takes compared to a laboratory isolate.Citation31 Thus, it is possible the increase in isolation of B. subtilis in our library is due to the isolation of the more prolific, endogenous B. subtilis isolates from zebrafish intestines. B. subtilis has also been shown to protect fish from the aquatic pathogen Aeromonas hydrophila, which causes inflammation and steep mortality rates.Citation32 With A. hydrophila infections being a persisting problem in zebrafish research facilities, the protective bioactivity of B. subtilis could contribute to the large representation of this species in our isolation efforts.Citation33 Microbes responsible for maintaining homeostasis in the gut microbiome system fall under the Actinobacteria phylum.Citation34 These maintenance microbes, which also reside in the colon, make up only a small portion of the gut microbiome community even though they hold a pivotal role in overall gut flora health.Citation28,Citation34 Once again, our dendrogram highlights the successful isolation and profiling of at least three genera of Actinobacteria such as Rhodococcus, Kocuria, and Mycolicibacterium ().
Lastly, we observe Gram-negative Proteobacteria generally found in the small intestine. This population is minor with respect to the rest of the gut microbiome because many Proteobacteria are opportunistic and over colonization of these microbes has been strongly correlated with several human diseases.Citation35,Citation36 More specifically, we isolated and profiled microbes such as Pseudomonas montelli, Aeromonas, and Shewanella that have been previously isolated from feces and from aquatic environments respectively.Citation37 No representatives from the Fusobacteria phylum were isolated because the cultivation methods used did not support the specific conditions needed to grow anaerobic bacteria. However, we hypothesize that due to the observed increase in the cultivation of aerobic bacterial growth in this study, the same trend would hold if repeated with anaerobic conditions and would support the growth of Fusobacteria.
Following grouping by MS protein fingerprints with IDBac, secondary metabolite diversity was investigated using a metabolite association network that corresponds to the IDBac generated dendrogram. Using IDBac, a dendrogram was created grouping 16 isolates grown on ISP2 or SNF + Fiber agar ()). The isolates highlighted in this dendrogram were chosen to ensure our comparison between growth with or without fiber included an array of library isolates originally cultivated from all four media types. Selecting isolates G2015 and S2008 on the dendrogram generated two metabolite association networks that correspond to each of the isolates ()). The metabolite association networks show signals found in both conditions (shared nodes) and unique signals (single nodes) that were detected when an isolate was grown with or without fiber. The metabolite association networks highlight that after removing nodes associated with matrix and the two types of mediums (controls), both isolates produce more unique secondary metabolites on SNF + Fiber than ISP2 ()). Even though neither of these strains were originally isolated from SNF + Fiber plates but rather GMF and SNF media, respectively, the metabolite association network infers that metabolite production is increased by exposure to insoluble fiber during cultivation. Isolate SF2016 seems to be a prolific producer of unique chemistry based on the generated metabolite association network ()). Interestingly, the metabolite association network suggests that SF2016 produces more unique secondary metabolites when grown on ISP2 medium rather than fiber medium. In the case of SF2016, this is an example of how cultivation through the addition of insoluble fiber allowed for the isolation of a prolific metabolite producer from the gut microbiome.
Having used IDBac as a prioritization tool, we aimed to further investigate and quantify the differences in metabolite production when gut microbes are grown on medium with insoluble fiber. XCMS meta-analysis, which was designed to prioritize interesting metabolite features from large metabolomic datasets, organized significant signals from each of the three isolates into a Venn diagram.Citation38 Though SF2016 seems to be the most prolific of the three isolates when grown with fiber ()), it is clear that the same trend holds in G2015 and S2008 with all three isolates showing an increase in metabolite production when grown on a medium with insoluble fiber compared to ISP2 (,d), respectively). Our HR-LC-MS results support that the addition of insoluble fiber to medium leads to an increase in secondary metabolite production in a natural product laboratory workflow.
Figure 4. Gut microbe growth on fiber agar increases secondary metabolite production. HR-LC-MS data collected from metabolite extracts of library isolates SF2016, G2015, and S2008 were analyzed using XCMS pairwise and meta-analysis. (a) Cloud plot comparison of SF2016 grown on fiber agar (top) and fiber agar control (bottom) highlighting significant metabolites (circles) produced by SF2016 when grown on fiber agar. The intensity of color in a circle correlates to the increased significance of the upregulated signal. (b) Cloud plot comparison of SF2016 grown on ISP2 agar (top) and ISP2 agar control (bottom). The Venn diagrams on the right represent the number of signals that are unique to each library isolate when grown on (c) fiber agar or (d) ISP2 medium.
It is worth noting that there are differences in the number of observed secondary metabolites between the IDBac metabolite association networks and the XCMS chromatograms. The differences in ions observed can arise for a variety of reasons. Importantly, these are two different ionization sources (MALDI vs electrospray ionization – ESI) and the exact mechanism by which ions are produced is fundamentally different. Various functional groups on the secondary metabolites themselves may favor one ionization method over the other and neither method is capable of comprehensively ionizing every metabolite in a given extract. Secondly, the samples subjected to the analyses are also fundamentally different. MALDI is incredibly fast (milliseconds per sample) and utilizes a small amount of a microbial colony, this direct detection typically favors singularly charged ions with little in-source fragmentation. Whereas ESI-LC-MS allows for the analysis of the colony and surrounding agar, which likely captures a better sampling of secondary metabolite production. Additionally, LC-MS analyses are time consuming with each run taking at least 12 min/colony extraction. This allows for the separation of different isomers which are not possible to distinguish in MALDI-TOF MS. However, ESI is known to give rise to in-source fragments which may increase the perceived number of secondary metabolites in a given sample. While the overall numbers of secondary metabolites are different, the trends hold across these orthogonal methods: the most prolific producer observed via the IDBac generated metabolite association network yields the highest number of features in the ESI-LC-MS analysis.
With the goal of constructing a taxonomically and chemically diverse zebrafish gut microbe library, insoluble fiber was added to isolation medium as a carbon source. By providing this solid substrate during in vitro growth, we observed an increase in bacterial growth when isolating microbes from environmental samples. Harnessing the speed, accuracy, and sensitivity of the IDBac workflow, protein, and metabolite profiles of the generated library supported that the increase in cultivation observed from the addition of fiber encouraged growth of the gut microbial community and suggested that providing insoluble fiber as a carbon source alters metabolite production of these isolates. Metabolomic statistical analysis of three bacterial isolates, SF2016, G2015, and S2008, confirmed that regardless of whether an isolate was originally cultivated from an SNF + Fiber plate, addition of insoluble fiber to growth medium lead to an increase in metabolite production. Our work shows that providing gut-derived microbes with a complex carbon source of insoluble fiber induces a significant increase in metabolite production; however, additional experiments are needed to distinguish if this phenomenon is due to the increased availability of a complex carbon source or whether this metabolite production is unique to fiber as a carbon source as opposed to a simple carbon source such as glucose. Further analysis is required to determine if the increase in metabolite production observed represents novel metabolites that have not been previously cultivated in vitro or if this cultivation technique allows for metabolite isolation that has traditionally only been observed in vivo. Work is ongoing to perform biological assays and identify constituents from the cultivable zebrafish gut microbes with antimicrobial and biofilm inhibition activity.
Materials and methods
Agar plate preparation
Agar plates were prepared by following the medium recipes detailed in Table S2. Mediums were autoclaved for 45 min and cooled to 55°C prior to the addition of 25 mg/L of 0.22 micron sterile filtered nalidixic acid and cycloheximide (Sigma).
Dissection of zebrafish intestines
Animals were treated and cared for in accordance with the National Institutes of Health Guide for the Care and Use of Laboratory animals. All experiments were approved by the University of Illinois at Chicago Institutional Animal Care and Use Committee (IACUC). Two adult casper zebrafish (lacking pigmentation)Citation39 were sacrificed at >90 days post fertilization with 0.1% tricaine solution for 10 min and bathed in 70% EtOH prior to dissection. To dissect intestines, a ventral incision was made from the front fin to the back fin. If the fish was female, eggs were separated and removed to expose the intestines. Both ends of the intestinal tract were cut and the intact intestinal tract was removed.
Intestinal sample plating
The intestines were transferred to a 1x PBS solution with three sterilized glass beads. This solution was vortexed for several minutes to break up the intestinal tissues. A 10-fold dilution of the intestinal solution was made before proceeding. Intestinal solution was plated in triplicate using two plating techniques (1) spreading or (2) serial spotting. For (1) spreading, 100 µL of the intestinal sample was pipetted to the agar and spread for even distribution of the sample. For serial spotting (2), a sterilized cotton swab was dipped into the intestinal solution and spotted throughout the plate. The entire plating procedure was then repeated with the 10-fold dilution. Plates were left to grow for up to 3 months at room temperature (~25°C).
Gut microbe isolation
Diversity plates were frequently monitored for new growth. New colonies were transferred to ISP2 to purify to single colonies. Once the purity of the culture was confirmed, a single colony was transferred to a liquid culture of ISP2 media. This liquid culture was left to shake at 225 RPM at 25°C until the liquid culture was turbid. Once turbid, the liquid culture was used to plate the isolate on ISP2 agar and frozen stocked.
IDBac sample preparation
From the pure isolates grown on ISP2 or SNF + fiber media, a sterilized toothpick was used to transfer a portion of a bacterial colony to a sterilized microcentrifuge tube containing 5 µL of HPLC grade TFA. Samples remained in TFA for 30 min to facilitate cell lysis and protein extraction. Following this incubation time, DI water (20 µL) and acetonitrile (30 µL) were added to each sample, briefly vortexed, and centrifuged at 10,000 rpm for 2 min. The supernatant (1.5 µL) was mixed with 1.5 µL of ɑ-cyano-4-hydroxycinnamic acid (CHCA) matrix for a 1:1 ratio of sample to matrix. The 1:1 sample:matrix mixture was then plated on a MALDI target plate in technical triplicate for IDBac analysis (1 µL). Measurements were performed in positive linear and reflectron modes on an Autoflex Speed LRF mass spectrometer (Bruker Daltonics) equipped with a smartbeam-II laser (355 nm).
16S sequencing molecular analysis
Total genomic DNA was extracted using a commercially available DNeasy Ultraclean Microbial Kit (Qiagen) following the manufacturer’s recommendations. Primer pair 27F (5'-CAGAGTTTGATCCTGGCT-3') and 1492R (5'-AGGAGGTGATCCAGCCGCA-3') were used to amplify the partial 16S ribosomal RNA (rRNA) gene sequence.Citation40 PCR conditions in a BioRad thermocycler were as follows: initial denaturation at 95°C for 5 min, followed by 35 cycles of denaturation at 95°C for 15 s, annealing at 60°C for 15 s, and extension at 72°C for 30 s, and a final extension step at 72°C for 2 min. Each amplified product was purified using QIAquick PCR Purification kit from Qiagen, followed by Sanger sequencing. Data analyzed by Geneious V11.1.4 software.
IDBac protein analysis
To generate dendrograms, MALDI-TOF MS protein data were uploaded to IDBac. The following settings were used to generate reported dendrogram: percent presence: 70, signal-to-noise ratio: 4, lower mass cutoff: 3,000, upper mass cutoff: 15,000, ppm tolerance: 1000, distance algorithm: euclidean, clustering algorithm: ward.D2, used peak presence/absence as grouping criteria.
IDBac metabolite association networks
A new dendrogram was constructed in IDBac using MALDI-TOF MS data collected on the 16 isolates that were grown on both fiber and ISP2 medium using the same settings as previously. For metabolite association networks, isolates SF2016, G2015, and S2008 were selected and the following settings were applied; percent presence: 70, signal-to-noise ratio: 4, lower mass cutoff: 200, upper mass cutoff: 2,000, ppm tolerance: 1,000, sample subtraction: Matrix. The network data were downloaded as a .csv file from IDBac and imported into Gephi version 0.9.2. This was repeated with sample subtraction being changed to fiber and ISP2 agar controls. In Gephi, metabolite association networks for the same isolate were compared and nodes corresponding to matrix or agar controls were manually removed to generate reported figures.
Metabolite extraction from bacterial isolates
Isolates SF2016, N2105, and S2008 were plated on thin (3 mL of agar in 60 mm Petri dish) SNF + Fiber or ISP2 media in duplicate. Samples and control plates were grown for 3 days at 25°C. Entire contents of Petri dish were extracted with 3 mL of MeOH and sonicated for 30 min. Crude extracts were used for HR-LC-MS analysis and stored at −20°C. All extractions were performed in biological replicates (N = 3).
HR-LC-MS data collection and XCMS analysis
Biological extracts were pooled (1 mg/mL) and run on a Bruker Impact II qTOF with a C18 UPLC (Phenomenex) in two technical replicates. The method for MSCitation1 data collection was as follows: solvent A (H20 with 0.1% formic acid) and solvent B (ACN with 0.1% formic acid). Ten percent isocratic solvent B for 2 min, 10%–100% gradient of solvent B for 8 min, 2-min wash of 100% solvent B and 2-min equilibration. Data were converted to .mzXML from Bruker software Data Analysis and uploaded to the online metabolomics platform XCMS. Pairwise comparisons of SF2016 Fiber vs Fiber agar, SF2016 ISP2 vs ISP2 agar, and SF2016 Fiber vs SF2016 ISP2 were run using Parameter ID: UPLC/Bruker Q-TOF pos. The same analysis was run for isolates G2015 and S2008. Cloud plots were generated with the following settings; p-value: 0–0.001, fold change: ≥1.5, retention time: 1–12, intensity: ≥5,000. For XCMS meta-analysis, pairwise jobs of each of the three isolates versus the fiber control were selected and run with the following settings; fold change ≥ 1.5, max p-value ≤ 0.001, max intensity ≥5,000, m/z tolerance 0.01, RT tolerance 60 s. The same workflow was repeated for meta-analysis of each isolate with ISP2 control.
Disclosure of potential conflicts of interest
No potential conflicts of interest were disclosed.
Supplemental Material
Download PDF (2.1 MB)Supplementary material
Supplemental data for this article can be accessed on the publisher’s website.
Additional information
Funding
References
- Staley JT, Konopka A. Measurement of in situ activities of nonphotosynthetic microorganisms in aquatic and terrestrial habitats. Annu Rev Microbiol. 1985;39(1):321–346. doi:10.1146/annurev.mi.39.100185.001541.
- Pye CR, Bertin MJ, Lokey RS, Gerwick WH, Linington RG. Retrospective analysis of natural products provides insights for future discovery trends. Proc Natl Acad Sci U S A. 2017;114(22):5601–5606. doi:10.1073/pnas.1614680114.
- Katz L, Baltz RH. Natural product discovery: past, present, and future. J Ind Microbiol Biotechnol. 2016;43:155–176. doi:10.1007/s10295-015-1723-5.
- Lagier J-C, Edouard S, Pagnier I, Mediannikov O, Drancourt M, Raoult D. Current and past strategies for bacterial culture in clinical microbiology. Clin Microbiol Rev. 2015;28:208–236.
- Chung KT, Hungate RE. Effect of alfalfa fiber substrate on culture counts of rumen bacteria. Appl Environ Microbiol. 1976;32(4):649–652. doi:10.1128/AEM.32.4.649-652.1976.
- Moraes-Cerdeira RM, Krans JV, McChesney JD, Pereira AMS, Franca SC. Cotton fiber as a substitute for agar support in tissue culture. HortScience. 1995;30(5):1082–1083. doi:10.21273/HORTSCI.30.5.1082.
- Ferris MJ, Hirsch CF. Method for isolation and purification of cyanobacteria. Appl Environ Microbiol. 1991;57(5):1448–1452. doi:10.1128/AEM.57.5.1448-1452.1991.
- Zhao S, Shamoun SF. The effects of culture media, solid substrates, and relative humidity on growth, sporulation and conidial discharge of Valdensinia heterodoxa. Mycol Res. 2006;110(11):1340–1346. doi:10.1016/j.mycres.2006.08.001.
- Jensen PR, Gontang E, Mafnas C, Mincer TJ, Fenical W. Culturable marine actinomycete diversity from tropical Pacific Ocean sediments. Environ Microbiol. 2005;7:1039–1048. doi:10.1111/j.1462-2920.2005.00785.x.
- Tran H, Stephenson S, Pollock E. Evaluation of Physarum polycephalum plasmodial growth and lipid production using rice bran as a carbon source. BMC Biotechnol. 2015;15(1):67. doi:10.1186/s12896-015-0188-y.
- Varghese LM, Agrawal S, Sharma D, Mandhan RP, Mahajan R. Cost-effective screening and isolation of xylano-cellulolytic positive microbes from termite gut and termitarium. 3 Biotech. 2017;7(2):108. doi:10.1007/s13205-017-0733-6.
- Bisht D, Yadav SK, Gautam P, Darmwal NS. Simultaneous production of alkaline lipase and protease by antibiotic and heavy metal tolerant Pseudomonas aeruginosa. J Basic Microbiol. 2013;53(9):715–722. doi:10.1002/jobm.201200157.
- Wang B, You J, King JB, Cai S, Park E, Powell DR, Cichewicz RH. Polyketide glycosides from Bionectria ochroleuca inhibit Candida albicans biofilm formation. J Nat Prod. 2014;77:2273–2279. doi:10.1021/np500531j.
- Timmermans ML, Picott KJ, Ucciferri L, Ross AC. Culturing marine bacteria from the genus Pseudoalteromonas on a cotton scaffold alters secondary metabolite production. Microbiologyopen. 2018;8(5):e00724.
- Clark CM, Costa MS, Sanchez LM, Murphy BT. Coupling MALDI-TOF mass spectrometry protein and specialized metabolite analyses to rapidly discriminate bacterial function. Proc Natl Acad Sci U S A. 2018;115(19):4981–4986. doi:10.1073/pnas.1801247115.
- Hong K, Gao A-H, Xie Q-Y, Gao H, Zhuang L, Lin H-P, Yu H-P, Li J, Yao X-S, Goodfellow M, et al. Actinomycetes for marine drug discovery isolated from mangrove soils and plants in China. Mar Drugs. 2009;7(1):24–44. doi:10.3390/md7010024.
- Clark CM, Costa MS, E C, Li E, Sanchez LM, Murphy BT. Using the open-source MALDI TOF-MS IDBac pipeline for analysis of microbial protein and specialized metabolite data. J Vis Exp. [Internet] 2019;(147). doi:10.3791/59219.
- Freiwald A, Sauer S. Phylogenetic classification and identification of bacteria by mass spectrometry. Nat Protoc. 2009;4(5):732–742. doi:10.1038/nprot.2009.37.
- Hu Y. Efficient, high-quality force-directed graph drawing. Math J. 2005;10:37–71.
- Mohseni M, Norouzi H, Hamedi J, Roohi A. Screening of antibacterial producing actinomycetes from sediments of the caspian sea. Int J Mol Cell Med. 2013;2:64–71.
- Ochoa JL, Sanchez LM, Koo B-M, Doherty JS, Rajendram M, Huang KC, Gross CA, Linington RG. Marine mammal microbiota yields novel antibiotic with potent activity against clostridium difficile. ACS Infect Dis. 2018;4(1):59–67. doi:10.1021/acsinfecdis.7b00105.
- Sanchez LM, Wong WR, Riener RM, Schulze CJ, Linington RG. Examining the fish microbiome: vertebrate-derived bacteria as an environmental niche for the discovery of unique marine natural products. PLoS One. 2012;7:e35398. doi:10.1371/journal.pone.0035398.
- Mincer TJ, Jensen PR, Kauffman CA, Fenical W. Widespread and persistent populations of a major new marine actinomycete taxon in ocean sediments. Appl Environ Microbiol. 2002;68(10):5005–5011. doi:10.1128/AEM.68.10.5005-5011.2002.
- Elfeki M, Alanjary M, Green SJ, Ziemert N, Murphy BT. Assessing the efficiency of cultivation techniques to recover natural product biosynthetic gene populations from sediment. ACS Chem Biol. 2018;13(8):2074–2081. doi:10.1021/acschembio.8b00254.
- Stephens WZ, Burns AR, Stagaman K, Wong S, Rawls JF, Guillemin K, Bohannan BJM. The composition of the zebrafish intestinal microbial community varies across development. Isme J. 2016;10(3):644–654. doi:10.1038/ismej.2015.140.
- Roeselers G, Mittge EK, Stephens WZ, Parichy DM, Cavanaugh CM, Guillemin K, Rawls JF. Evidence for a core gut microbiota in the zebrafish. Isme J. 2011;5(10):1595–1608. doi:10.1038/ismej.2011.38.
- Wolfe BE, Button JE, Santarelli M, Dutton RJ. Cheese rind communities provide tractable systems for in situ and in vitro studies of microbial diversity. Cell. 2014;158(2):422–433. doi:10.1016/j.cell.2014.05.041.
- Jandhyala SM, Talukdar R, Subramanyam C, Vuyyuru H. Role of the normal gut microbiota. World J Gastroenterol. 2015;21(29):8787–8803. doi:10.3748/wjg.v21.i29.8787.
- Huang Y, Shi X, Li Z, Shen Y, Shi X, Wang L, Li G, Yuan Y, Wang J, Zhang Y, et al. Possible association of Firmicutes in the gut microbiota of patients with major depressive disorder. Neuropsychiatr Dis Treat. 2018;14:3329–3337. doi:10.2147/NDT.
- Duncan SH, Louis P, Flint HJ. Cultivable bacterial diversity from the human colon. Lett Appl Microbiol. 2007;44:343–350. doi:10.1111/j.1472-765X.2007.02129.x.
- Tam NKM, Uyen NQ, Hong HA, Duc LH, Hoa TT, Serra CR, Henriques AO, Cutting SM. The intestinal life cycle of Bacillus subtilis and close relatives. J Bacteriol. 2006;188:2692–2700. doi:10.1128/JB.188.7.2692-2700.2006.
- Kong W, Huang C, Tang Y, Zhang D, Wu Z, Chen X. Effect of Bacillus subtilis on Aeromonas hydrophila-induced intestinal mucosal barrier function damage and inflammation in grass carp (Ctenopharyngodon idella). Sci Rep. 2017;7(1):1588. doi:10.1038/s41598-017-01336-9.
- Mocho J-P, Martin DJ, Millington ME, Saavedra Torres Y. Environmental screening of Aeromonas hydrophila, Mycobacterium spp., and Pseudocapillaria tomentosa in Zebrafish systems. J Vis Exp. [Internet] 2017; doi:10.3791/55306.
- Binda C, Lopetuso LR, Rizzatti G, Gibiino G, Cennamo V, Actinobacteria: GA. A relevant minority for the maintenance of gut homeostasis. Dig Liver Dis. 2018;50(5):421–428. doi:10.1016/j.dld.2018.02.012.
- Sharma KK, Kalawat U. Emerging infections: shewanella - a series of five cases. J Lab Physicians. 2010;2:61–65. doi:10.4103/0974-2727.72150.
- de Abreu PM, Farias PG, Paiva GS, Almeida AM, Morais PV. Persistence of microbial communities including Pseudomonas aeruginosa in a hospital environment: a potential health hazard. BMC Microbiol. 2014;14(1):118. doi:10.1186/1471-2180-14-118.
- Dailey FE, McGraw JE, Jensen BJ, Bishop SS, Lokken JP, Dorff KJ, Ripley MP, Munro JB. The microbiota of freshwater fish and freshwater niches contain omega-3 fatty acid-producing shewanella species. Appl Environ Microbiol. 2016;82(1):218–231. doi:10.1128/AEM.02266-15.
- Patti GJ, Tautenhahn R, Siuzdak G. Meta-analysis of untargeted metabolomic data from multiple profiling experiments. Nat Protoc. 2012;7(3):508–516. doi:10.1038/nprot.2011.454.
- White RM, Sessa A, Burke C, Bowman T, LeBlanc J, Ceol C, Bourque C, Dovey M, Goessling W, Burns CE, et al. Transparent adult zebrafish as a tool for in vivo transplantation analysis. Cell Stem Cell. 2008;2(2):183–189. doi:10.1016/j.stem.2007.11.002.
- Lane DJ. 16S/23S rRNA sequencing. (eds. Stackebrandt E. Goodfellow M) nucleic acid tech. Bact. Syst. 1991;65(9):115–175.