
 ?Mathematical formulae have been encoded as MathML and are displayed in this HTML version using MathJax in order to improve their display. Uncheck the box to turn MathJax off. This feature requires Javascript. Click on a formula to zoom.
ABSTRACT
Many patients with alcohol use disorder (AUD) consume alcohol chronically and in large amounts that alter intestinal microbiota, damage the gastrointestinal tract, and thereby injure other organs via malabsorption and intestinal inflammation. We hypothesized that alcohol consumption and subsequent abstinence would change the gut microbiome in adults admitted to a treatment program. Stool and oral specimens, diet data, gastrointestinal assessment scores, anxiety, depression measures and drinking amounts were collected longitudinally for up to 4 weeks in 22 newly abstinent inpatients with AUD who were dichotomized as less heavy drinkers (LHD, <10 drinks/d) and very heavy drinkers (VHD, 10 or more drinks/d). Next-generation 16 S rRNA gene sequencing was performed to measure the gut and oral microbiome at up to ten time points/subject and LHD and VHD were compared for change in principal components, Shannon diversity index and specific genera. The first three principal components explained 46.7% of the variance in gut microbiome diversity across time and all study subjects, indicating the change in gut microbiome following abstinence. The first time point was an outlier in three-dimensional principal component space versus all other time points. The gut microbiota in LHD and VHD were significantly dissimilar in change from day 1 to day 5 (p = .03) and from day 1 to week 3 (p = .02). The VHD drinking group displayed greater change from baseline. The Shannon diversity index of the gut microbiome changed significantly during abstinence in five participants. In both groups, the Shannon diversity was lower in the oral microbiome than gut. Ten total genera were shared between oral and stool in the AUD participants. These data were compared with healthy controls from the Human Microbiome Project to investigate the concept of a core microbiome. Rapid changes in gut microbiome following abstinence from alcohol suggest resilience of the gut microbiome in AUD and reflects the benefits of refraining from the highest levels of alcohol and potential benefits of abstinence.
Introduction
Alcohol use disorder (AUD) and heavy drinking are pervasive worldwide.1,Citation2 In a current national epidemiological survey comparing drinking prevalence in the United States between 2001–2002 and 2012–2013, 12 -month high-risk drinking increased significantly from 9.7% to 12.6% (a change of 29.9%).Citation3 Among Americans 12 y of age and older, 140.6 million people use alcohol, and almost half (47.4%) engage in binge drinking.Citation4 Research on the gut-brain axis– the bidirectional communication between gut and brain – is expanding the mechanistic understanding of the relationship between AUD and heavy drinking that damages diverse organs.Citation5-Citation8 The ecosystem of the gut microbiome extends far beyond the gastrointestinal tract and the composition and activity of living organisms in the gut microbes can affect brain functioning, mood and behavior via mechanisms yet to be fully explained.Citation7-Citation13 However, the microbiome may be uniquely involved in the pathogenesis of AUD,Citation14 with alcohol use disturbing the gut microbiome and contributing to alcoholic liver disease.Citation15
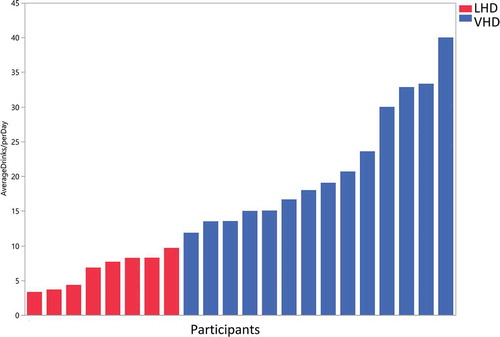
Figure 1. Drinks per day in less heavy drinkers (LHD) and very heavy drinkers (VHD). Blue bars (VHD cohort, N = 14) and red bars (LHD cohort, N = 8) depict drinks/d over the 90-d alcohol Timeline Followback (TLFB). Patients were classified as LHD if they consumed <10 drinks/d and VHD group if they consumed 10 or more drinks/d. One patient did not complete the Alcohol TLFB and was placed in the VHD group based on information obtained from the history and physical.
Heavy alcohol intake has been linked to liver disease,Citation16 neuroinflammation,Citation17 malnutrition,Citation18 elevated cancer risk,Citation19 immune system dysfunction,Citation20 heart failure,Citation21 and many other significant health problems.Citation22 Some of these consequences of alcohol use have been attributed to alcohol-induced gut dysbiosis – an imbalance in the community of gut microbes.Citation5,Citation7,Citation23,Citation24
Increased intestinal permeability is a key clinical side effect of AUD as well as a crucial element affecting the alcohol-gut-brain relationship.Citation5,Citation7,Citation25 Leclercq et al. provide evidence that increased gut permeability leads to increased anxiety, depression and craving in patients with AUD.Citation7 Increased alcohol intake promotes the opening of tight junctions between intestinal epithelial cells, enabling bacteria and metabolites to enter the bloodstream.Citation5,Citation25,Citation26 Bacterial peptidoglycans and lipopolysaccharides bind to Toll-like receptors, alerting the immune system to the presence of endotoxins and stimulating the production of proinflammatory cytokines.Citation11,Citation24,Citation27 Activation of the inflammasome affects the brain, which has been associated with multiple psychiatric disorders, including depression,Citation13,Citation25 schizophrenia,Citation28 bipolar disorderCitation29 and even with craving during alcohol withdrawal.Citation30
In addition to gut permeability and inflammation, the gut microbiome may affect the brain in other ways after chronic alcohol use.Citation6 Microbiota and their metabolites interact with the brain via the vagus nerve and hypothalamic-pituitary-adrenal axis, as well as exert direct effects on brain cells such as microglia.Citation7,Citation9,Citation31 A microbial metabolite of particular interest is tryptophan, a precursor to serotonin that is both a key central transmitter and noted to play an integral role in the development of psychiatric conditions.Citation5,Citation7,Citation11,Citation32 Other bacterial metabolites, particularly short-chain fatty acids (SCFAs)Citation26,Citation33,Citation34 and bile acids, impact the nervous system as well.Citation32,Citation35,Citation36 SCFAs (notably butyrate) modulate neuronal activity and immune functions,Citation8 and can further perturb gut–brain interactions by promoting colonic motility and lowering luminal pH.Citation34 Alcohol is a positive allosteric modulator of GABA (gamma-Aminobutyric acid) receptors and the gut microbiome has been reported to influence GABA and GABAergic transmission in the brainCitation37. Speculatively, alcohol consumption could self-medicate GABA deficits induced by alcohol itself.Citation38
However, chronic alcohol use does not always lead to gut dysbiosis, signaling the importance of the complexities of exposure, model or time point at which the microbiome is assessed.Citation5,Citation7,Citation24 While knowledge of the link between the microbiome and mental health is growing, the impact of ethanol consumption on gut microorganisms remains understudied.
At the beginning of the gastrointestinal tract, the oral cavity has a complex microbiome composed of many different, unique niches from the non-shedding surface of the teeth, subgingival pockets and mucous membranes of the palate and cheek to the dorsal surface of the tongue.Citation39-Citation41 In patients with AUD, there is increasing evidence that the oral microbiome is affected by heavy alcohol useCitation42 so as a preliminary investigation into the oral microbiome of individuals with AUD, we looked for dose-dependent differences in the oral microbiota.
We used whole stool homogenization and oral tongue brushings as well as a microbiome sequencing kit that allowed us to examine six of the nine hypervariable regions of the 16 S gene. We believe this methodology provides a comprehensive picture of the oral and gut microbiomes in patients with severe AUD.
A previous study has shown that gut dysbiosis produced by chronic alcohol use may persist after more than 2 weeksCitation7 of sobriety; however, the analysis was limited to only two-time points. We hypothesized that alcohol would change the microbiomes of individuals with AUD. To understand the relationship between AUD, heavy drinking and abstinence to gut microbiome, we assessed gut microbiome longitudinally following abstinence over weeks in 22 patients with AUD. We also conducted a preliminary study of parallel changes in the oral microbiome assessed in the same patients.
Results
Demographics and clinical measures
Data from the Timeline Followback (TLFB) for Alcohol were used to dichotomize the sample into those consuming on average less than 10 drinks/d – less heavy drinkers (LHD, N = 8) and on average 10 or more drinks/d – very heavy drinkers (VHD, N = 14) (). There were no significant differences in demographics and clinical measures between LHD and VHD except for drinking quantity and anxiety (). The results of the TLFB for alcohol use consumed across the three time points (30–60–90 d) were remarkably consistent indicative of stable drinking patterns (Supplementary Figure S1).Citation45 All participants met the criteria for alcohol use disorder (AUD) with high scores (= 21.1 ± 6.07) on the Alcohol Dependence Scale (ADS) (). A score >9 is highly correlated with alcohol dependence.Citation44 Participants differed considerably in the intensity and history of alcohol intake (). Mean years of heavy drinking were 19.66 y (±12.16) with a minimum of 1 y and a maximum of 39.8 y. The age of first drink was lower in the VHD group (
= 12.69 ± 4.89) but years of heavy drinking were higher in the LHD group (
= 21.66, ± 13.92).
Table 1. Demographics and clinical measures.
Fourteen participants completed the Structured Clinical Interview (SCID) for DSM – IV while eight completed the SCID-5Citation2 and all participants met the criteria for DSM-5. AUD and this term will be used instead of alcohol dependence.
Approximately, 73% (16/22) of participants smoked cigarettes and 8/22 (36%) participants endorsed illicit substance use and 10 (10/22) tested positive for urine cannabinoids on admission. Seven participants were in the VHD group and three in the LHD group for marijuana use. One participant in the VHD group tested positive for cocaine. The number of patients who smoked in the VHD group (85.7%) was higher than those in the LHD group (50%). Oral health was poor, on average with 86% of participants diagnosed with periodontal disease by clinical examination. Unsurprisingly, 15 of the 19 participants with periodontal disease also smoked and likewise all but one of the smokers had periodontal disease. There were four nonsmokers with periodontal disease. There was no difference in other oral assessment measures (Decayed, Missing and Filled Teeth – DMFT) scores and initial Beck’s Modified Oral Assessment Score between the LHD and VHD (). The DMFT total mean score for the population (10.09 ± 5.94) sample was within the range of national scores for healthy population (9.3 SE 0.09).Citation51
None of the participants had cirrhosis or liver failure. However, 45% (n =10) of participants had elevated transaminases (aspartate aminotransferase-AST or alanine aminotransferase – ALT) and 68% (n =15) had elevated gamma-glutamyl transferases (GGT). There were no significant differences between the LHD versus VHD groups in any of the variables listed in . However, variables that measured liver function (AST, alkaline phosphatase – ALP, ALT and GGT) were higher in the VHD group. The synthetic liver function variables (prothrombin time, platelet count and albumin) were not different between the two groups (). Thirty-six percent (n = 8) had elevated serum iron and ferritin levels. Three patients had decreased serum iron levels. Two patients had abdominal ultrasounds and their livers were within normal limits.
Table 2. Liver function.
During inpatient treatment, 18/22 participants required benzodiazepines, primarily oxazepam, to assist with withdrawal. For those who used benzodiazepines, the mean number of days was 4.17 (± 3.37) and use extended from 1 d to a maximum of 11 d. Seven received topical steroids for skin conditions. Seven participants were taking acamprosate or naltrexone for AUD. Two were on systemic antibiotics to treat underlying infections, while one participant received ophthalmic antibiotic drops for prophylaxis after an eye procedure performed before inpatient admission. Three participants were given proton-pump inhibitors, one was taking an H2 blocker, ranitidine and two received antacids (prescribed as needed) for heartburn symptoms during study participation. Nine participants were placed on smoking cessation therapies (varenicline, nicotine patch/gum, or bupropion). Ten participants were taking psychotropic drugs. Fourteen participants were taking analgesics as needed for pain. Last, but not least, every study participant was taking multivitamin tablets, and thiamine for nutritional support which is standard clinical management for AUD. For a list of administered medications, see Supplemental Material (Table S1).
Few of our participants complained of gastrointestinal disturbances. Bristol Stool Scale (BSS),Citation52 abdominal pain numeric rating scaleCitation53 and Gastrointestinal Patient-Reported Outcome Measure Information System® (GI PROMIS)Citation54 measures were mostly within normal values (Supplementary file Table S2 GI PROMIS & Figure S2 BSS). The PROMIS® GI scores were elevated in the first week in comparison to the general population but these differences disappeared by the last week. The BSS as a measure of transit time did not differ by group, LHD versus VHD or by antibiotic use. A total of 167 assessments of stool were recorded. In the first week, the BSS was scored as abnormal 50.4% (54 abnormal/107 total) but this was reduced to 33.3% (20 abnormal/60 total) in the last 3 weeks.
Anxiety, depression and other psychosocial measures
Measures of depression (Montgomery–Asberg Depression Rating Scale – MADRS), anxiety (Brief Scale for Anxiety – BSA)Citation48, alcohol withdrawal (Clinical Institute Withdrawal Assessment – CIWA)Citation47 and craving (Penn-Alcohol Craving Index – PACS)Citation50 improved over the course of the study in both drinking groups ().
Upon closer examination of BSA score, the LHD group had a lower anxiety range over 23 d than the VHD group ()). These differences were not significant between the two groups. In addition, a global look at the BSA scores across the four time collection points (day 02, day 09, day 16, day 23), indicated that the VHD group’s average anxiety scores were higher than the LHD group ()). The average BSA significantly differs between LHD and VHD on day 16 (p =.02). Interestingly, but not surprisingly, the anxiety scores for all participants generally trended downward across the 23 d. Unlike the BSA, there was no significant difference between drinking groups in depression as measured by the MADRS.
Figure 2. Longitudinal change in state anxiety and gut microbiome Shannon Diversity Index (SDI). State anxiety was measured over 23 d with the Brief Scale for Anxiety (BSA). (a) Mean anxiety and maximum/minimums of within-subject range of state anxiety in LHD (red) and VHD (blue). (b) Longitudinal change in anxiety in LHD (red) and VHD (blue) patients, over 4 weeks, showing decline in state anxiety after week 1, and subsequent stability. BSA anxiety differed significantly between VHD and LHD only at day 16 (*p = .02) without multiple comparison correction. (c) Weeks 1-4 correlation bivariate plot between BSA (x-axis) and SDI (y-axis). A significant negative correlation (* p = .04) at week 3 in LHD is shown (without multiple comparison correction).
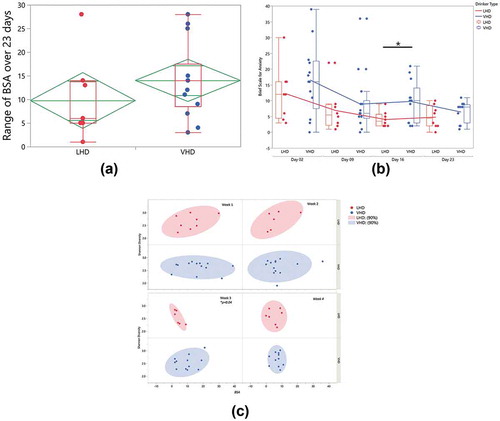
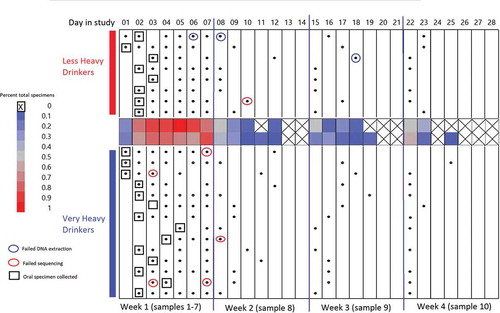
Figure 3. Gut and oral specimen sampling chart over 28 d of inpatient treatment. X-axis along the top of the chart indicates the day in the study (Day 1–Day 28) segmented by 4 -week intervals. Black dots: gut specimens. Open boxes: oral specimens. Blue circles: specimens failing DNA extraction. Red circles: specimens failing sequencing. Center heat map: average total specimens for that day.
Gut alpha diversity was correlated with anxiety for both LHD and VHD groups when average weekly SDI and BSA were compared. A significant negative correlation at week 3 was found when comparing BSA to the Shannon Diversity Index (SDI) (p =.04) in the LHD group. During week 3 for these individuals, anxiety scores increased, and SDI decreased significantly ()).
Bacterial 16 S rRNA sequencing results in VHD and LHD AUD patients
Gut microbiome
Throughout the study course, 171 stool specimens were collected. Four of the 171 were discarded because of contamination with urine. Three failed DNA extraction and six failed sequencing, leaving 158 sequenced samples from 22 subjects. The total number of reads by region were as follows: v2: 6,682,363; v3: 13,990,581; v4: 15,340,072; v67: 19,038,710; v8: 11, 594,017. Average relative abundance for all participants by drinking group for each time point showed some within-group-specific genera (). Erysipelotrichaceae and Lachnospiraceae differed significantly at the start of the treatment program (time point 1) between LHD and VHD groups (). As can be seen in this figure, Erysipelotrichaceae and Lachnospiraceae were both significantly more abundant in the LHD group at the first time point (first sample) than they were at that same time point in the VHD group with their average abundance being 13% for the LHD and between 0.01% and 0.05% for VHD. This finding could be indicative of a dose-dependent effect of alcohol. Thirty-nine genera are represented in the figure legend at >5% average abundance that were at least 5% abundant in any sample at any given time point. A global change was observed across time and between the two groups, LHD and VHD (), although variation was greater across participants than within participants for most taxa (). Individual relative abundance plots show patient-specific genera over the course of the study.
Figure 4. Longitudinal change in average relative abundances of between VHD and LHD over 3 weeks following abstinence. Depicted are 39 genera with relative abundance. The legend shows only those genera that were at least 5% abundant in any sample at any given time point. The number of specimens used to calculate relative abundances is shown at the top, and the sampling time point is at the bottom. Two genera (orange boxes) were initially significantly different between LHD and VHD: Erysipelotrichaceae and Lachnospiraceae.
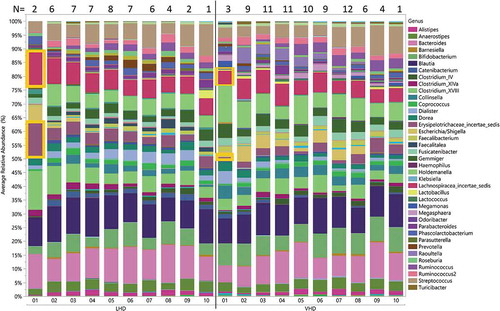
Figure 5. Individual specific longitudinal change in gut microbiome relative abundance and SDI for LHD (N = 8) (Figure 5(a)) and VHD (N = 14) (Figure 5(b)). Clinical administration of antibiotics (AB) is indicated with labels and blue arrows. Black star indicates significant linear trend in SDI.
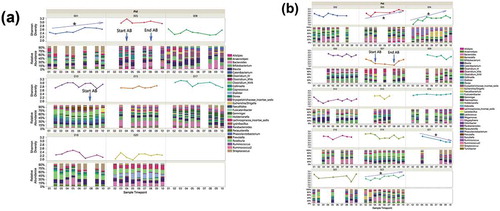
SDI was investigated between the two drinking groups to evaluate whether drinking amount affects gut microbial diversity. Comparison of mean SDIs did not reveal significant differences at any time point; however, five out of 22 participants (1/8 LHD and 4/14 VHD) showed a significant linear diversity change over time and in 4/5 diversity increased over time (,)). One patient in the LHD group showed a significantly increased SDI over the ten time points ()).
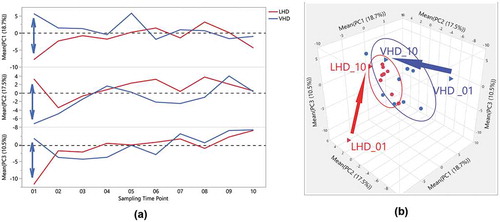
Remarkably, the first three principal components (PCs) explained 46.7% of the variability in gut microbiome across the entire data set of participants and time points. Three-dimensional scatterplots of the first three PCs for both LHD ()) and the VHD ()), density ellipses are drawn around 50% of each participant’s samples (up to a set of ten) depicting the range of the PCs for that individual. For LHD ()), three participants have larger ellipses representing larger variability, than the other five in the LHD patients. Wider intra-patient variability was observed among participants in VHD patients as shown by the wider ellipses. When averaging over patients by group and time, and comparing PC averages at each time point, VHD and LHD are most divergent for all three PCs at the initial time point closest to the withdrawal from alcohol. The first time point for PC1, PC2 and PC3 shows the largest divergence between the two groups, and this time point for both groups still appears to be an outlier when comparing them to all other time points ()). Over time, VHD and LHD patients converged as also shown in the 3D plot of PCs 1–3 ()). ) demonstrates this divergence of time point one by group.
Figure 6. Three-Dimensional Scatterplot for the first three Principal Components of gut microbiome of AUD patients longitudinally followed after abstinence. LHD samples are shown (Figure 6(a)) and VHD are shown (Figure 6(b)). Each ellipse bounds samples from an individual patient, smaller ellipses (as in several LHD patients )) representing less temporal variation for that patient.
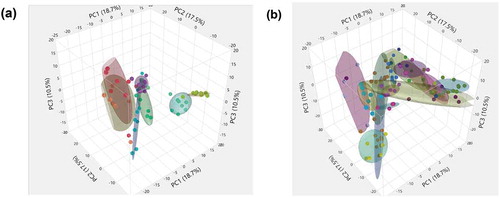
Figure 7. Distinctiveness and overlap of LHD and VHD groups, across time, following abstinence, for the first three Principal Components of the gut microbiome. (a) One-way overlay plot of the average over participants for the first three Principal Components (y-axis) versus the ten sampling time points (x-axis). The average PC over all patients in each group for each time point was calculated to determine centroids. The double-headed arrow indicates differences between centroids of first time points between each drinking group. (b) Three-Dimensional Scatter Plot of the averages of the first three Principal Components for LHD (red) and VHD (blue) groups. The first and last time point, i.e. VHD_01, LHD_01, VHD_010, LHD_010, are shown as triangles. A vector is drawn from the first time point to the last time point within each group showing the direction. As shown in this view, the first time points for each group appear to be outliers when compared to the rest illustrating extensive change in gut microbiome following abstinence.
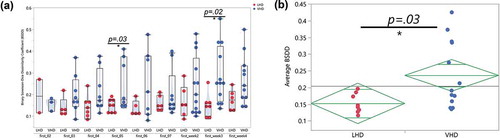
The Binary Sorenson–Dice Dissimilarity (BSDD) coefficient assesses the dissimilarity between a pair of samples by investigating the overlap of genera between two samples.Citation55 A BSDD value of zero indicates 100% overlap. The BSDD was calculated between each patient’s first samples and their remaining samples in order to quantify the change of gut microbiota following abstinence. The LHD and VHD groups showed a significantly different average BSDD (p =.03, )). Also, interesting to note, the VHD group had a 0.10 higher average BSDD than the LHD group, again illustrating more gut microbial changes during abstinence in the VHD group. ) shows the large range of BSDD values for the VHD group (blue) when compared to the LHD group (red). Three main points are observable in this figure. First, the LHD group possessed a much smaller dynamic range of BSDD values for each comparison, indicating that the microbiome of these patients changed to a smaller extent than the VHD group. Second, when investigating the average BSDDs across the two drinking groups, pairwise comparisons between day 1 and day five (p =.030) and day 1 and week 3 (p =.02) differed significantly between the two groups. Finally, the BSDD values for the VHD group had a much larger dynamic range than compared to that of the LHD group, consistent with diversity increasing more dramatically after abstinence in the VHD. This fact suggests that the VHD participants have a more diverse rate of change than the LHD group.
Figure 8. Binary Sorenson-Dice Dissimilarity Index between VHD and LHD. (a) Binary Sorenson–Dice Dissimilarity (BSDD) index (y-axis) between drinking type gut microbiota violin plots showing BSDD for individual LHD (red) and VHD (blue) subjects with AUD longitudinally followed after abstinence. BSDD values were significantly different between LHD and VHD at the first and 5 day comparisons (t-test, p < .03) and also at the first and week 3 comparisons (t-test, p < .02). (b) Average BSDDs for each participant (y-axis) for LHD and VHD. Average BSDD for LHD tightly clustered between 0.1 and 0.2. Average BSDD for VHD showed a larger range from 0.13 to 0.43.
Antibiotic use
Three of the 22 participants received antibiotics (AB) during the course of the study. As shown in , oral ciprofloxacin may have reduced Shannon diversity index within and following the window of AB exposure (p =.03). One received amoxicillin/clavulanate potassium 875 mg/125 mg day 4 through week 2 (See ; Supplemental Table S1). The second received ciprofloxacin 500 mg day 4 through week 2. The third received ophthalmic antibiotic ofloxacin 0.3% eye drops at week 2 to 3. No genera were found to be significantly more or less abundant in patients that received antibiotics during the AB timeframe. Time points at weeks two and three were used for comparison because this was the time frame that most of the AB patients were treated with antibiotics. Transit time (measured by the BSS) was not affected by antibiotic treatment (Supplementary Figure S2).
AUD and the Human Microbiome Project (HMP): an investigative look at the gut “core microbiota”
For the HMP data,Citation56 28 unique genera were cataloged in at least 10% fecal samples analyzed from regions v1-3 and v3-5 (Supplementary Figure S3) versus 76 unique genera in at least 10% of the participants in our study examining v2, v3, v4, v67, v8. We identified 23/28 HMP genera were shared between the HMP and AUD gut microbiota. The most prevalent genera found in common between HMP and AUD included Alistipes, Bacteroides, Blautia, Coprococcus, Faecalibacterium, Parabacteroides, Roseburia, Ruminococcus and Subdoligranulum. Here, the term “prevalence” indicates genera present in almost all samples and should not be confused with abundance, which is related to average percent composition.
Oral microbiome
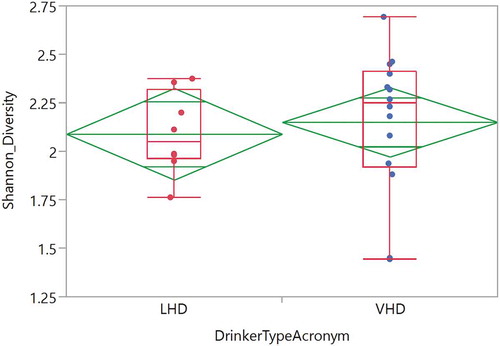
Twenty-two tongue brushings were matched with the earliest stool samples. These samples revealed 25 genera with at least 1% abundance (labeled in the legend) (). The total number of reads was 697,599 reads with average read total across 22 samples of 354,004 (SD ± 145,445). A median read total was 340,633. The relative abundance of these oral samples was plotted for each participant by group (). The most highly abundant genera were Streptococcus, Prevotella and Veillonella. The average SDI between LHD and VHD groups did not differ significantly and unsurprisingly, the SDI in the oral was lower than that in the gut in both drinking groups ().
Figure 9. Relative Abundance of Oral Genera in LHD and VHD. Each vertical bar represents the relative abundance of the oral sample matching the initial stool sample for that participant. Legend lists only those genera having at least 1% or more abundance.
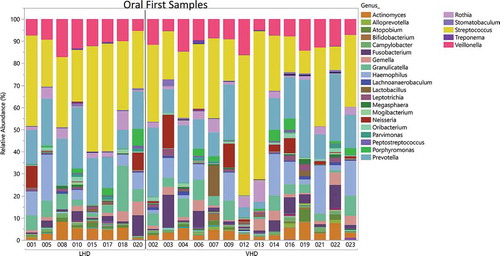
Figure 10. Shannon Diversity of oral genera in the LHD and VHD groups. Diversity LHD (red) and VHD (blue) did not differ significantly.
Smoking status did not affect initial oral or gut microbial diversity as measured by the SDI when comparing smokers versus nonsmokers in both drinking groups. When examining periodontal disease [no periodontal disease (n =3), mild/moderate (n =16) or severe disease (n =3)] there was no significant difference in the SDI (data not shown).
Comparison of overlap oral/stool microbiome in AUD to HMP
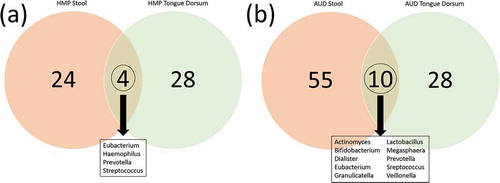
We hypothesized that there might be more oral to gut transmission in the AUD than in healthy individuals. In order to investigate this, we compared taxa that were present in both stool and oral samples from the HMP data. In AUD, 10/93 genera were common between oral and gut microbiomes (). Alternatively, only 4/56 genera were found present in common between oral and gut microbiomes in the HMP. There was one genus in the HMP oral/gut overlap that was not found in the AUD oral/gut overlap (Haemophilus). Interestingly, there were 7 AUD oral/gut overlap bacteria that were not found in the HMP gut overlap (Actinomyces, Bifidobacterium, Dialister, Granulicatella, Lactobacillus, Megasphaera, and Veillonella).
Figure 11. (a) Overlap of genera represented in the oral (green) and in the gut (red) microbiomes of the healthy HMP cohort (https://www.hmpdacc.org/hmp/HMQCP/) (Figure 11(a)) and in AUD patients in the present study (Figure 11(b)). Ten genera were found to be in common between oral/gut in the AUD participants.
Effects of diet on the microbiome of AUD patients
None of our study participants was vegetarian. Among the 21 participants who completed the Dietary Health Questionnaire II (DHQ II) survey,Citation57 average energy intake was 6,683 ± 3511 (mean ± SD) kcal/d in the year prior to admission. Forty-six percent of calories were from alcohol, 32% from carbohydrate, 16% from fat and 8% from protein. Post-admission diet changed dramatically. Average dietary intake (calculated from food tickets) was 2659.5 ± 987.0 kcal per day with 25.7 ± 11.3 g per day of fiber, 46% of calories from carbohydrates, 35% from fat (reflecting 12% from saturated fat, 12% from monounsaturated fat and 9% from polyunsaturated fat) and 19% from protein. Total sugar ingested was a mean of 156.45 ± 73.0 g/d. There was no difference in caloric and fiber intake, total fat and the Healthy Eating Index (HEI) between the two groups at week 1 and 4.Citation58 However, prior to admission, the VHD derived a higher percentage of calories from alcohol (inferred by higher consumption rate). The total mean HEI for the sample (week 1, 63.19 ± 10.2; week 4, 57.60 ± 12.03) was well within normal values for a healthy sampleCitation59 (Supplementary Table S3).
Discussion
AUD can cause severe gut dysbiosis, however only some individuals with AUD experience this dysbiosis.Citation7,Citation24,Citation60 Drinking amount could be a key factor in predicting dysbiosis. In our study, the gut microbiome of VHD patients changed more during abstinence than LHD, pointing to the effect of drinking quantity and of an unhealthy diet. The main effect of very heavy drinking was to reduce gut microbiome diversity and this effect was reversible by abstinence and a healthy diet. This data prompts the question of what would be the effect of abstinence on the SDI if that abstinence was investigated over a longer time point such as 60 or 90 d.
We used a number of metrics to investigate differences between LHD and VHD. Longitudinally, VHD patients tended to have, on average, higher dissimilarity indexes ()), higher anxiety ()) and exhibited greater diversity changes in their gut microbiome (). VHD patients are most different than LHD at the time abstinence is initiated ()).
The space defined by the first three PCs encompassed nearly half (46.7%) of the total variance in microbiome representation. The first three PCs representing such large variability of the entire data matrix are likely to be driven in parts, by the severe exposure AUD patients received and changes subsequent to abstinence. Individuals who drank more heavily showed larger longitudinal shifts as evidenced by the size of ellipses in PC space. Irrespective of drinking amount, varying the ellipsis sizes around PC indicate individual-specific gut microbiota. Differences in directionality of vectors underscore the impact of individual variation ()). Within subjects, both LHD and VHD patients are most divergent immediately following abstinence and as time goes on their microbiomes tend to stabilize.
Specific genera could ultimately predict overall pathology in AUD, however, detecting these effects may require a large cross-sectional study. In our study with a small sample size of 22, we implicated two bacterial taxa, to be significantly altered in AUD by drinking group, Erysipelotrichaceae and Lachnospiraceae. Erysipelotrichaceae has been previously associated with inflammation and increased immune stimulation.Citation61 Another study showed that Lachnospiraceae was depleted in patients with depressive symptoms and associated with gastrointestinal sensorimotor function in participants with irritable bowel syndrome.Citation62
Next, we addressed the idea of an oral to gut transmission by comparing bacterial presence across oral and gut samples in both AUD and in the healthy HMP cohort. We looked at the intersection of bacteria presence between oral and stool in the AUD samples and the HMP samples. There were ten bacteria that intersected in the AUD sample versus four in the HMP data.
Alcoholic patients often smoke and have periodontal disease, as did the majority of the participants in our study.Citation63 All but one of the smokers in our study had periodontal disease. In future studies, it will be important to better clarify the relationships between alcohol, smoking and periodontal disease in shaping the gut and oral microbiomes.
Although we did not identify a definitive link between the gut microbiome and any psychosocial measure such as anxiety or depression, we did identify that during the third week there was a significant correlation between the BSA and the SDI in the LHD group (p =.04) (). In this group, the higher the SDI, the lower the anxiety as measured by this scale. Increasingly, attention has been drawn to the gut – brain axis whereby gut microbiome can perturb behavior.Citation64 Our study was not designed to study this important aspect, but even in our small sample, we found that changes in microbiome diversity correlated with decreasing emotionality.
Our patients consumed regular diets selected from the standard menu of the NIH Clinical Center. Type and quantity of food were measured, but not manipulated, representing a naturalistic exploration of benefits of abstinence from alcohol in a hospital setting. Estimates from the DHQ II showed that 46% of calories consumed in the past year was from alcohol. This is not unusual for alcoholic patients in that the prevalence of malnutrition and “undernutrition” in this population is often underestimated.Citation65 Targeted manipulation of diet in AUD is an area for future exploration.
This study obtained a more accurate and complete analysis of the gut microbiome in two ways. First, we interrogated six regions of the 16 S rRNA gene, presumably eliminating or minimizing any V region bias.Citation66 The Ion 16 S Metagenomics Kit (ThermoFisher Scientific, Waltham, MA) was used to interrogate six of the nine hypervariable regions. Other researchers only sequence one or two hypervariable regions possibly missing some genera specific to a particular V region. Also, we were able to combine OTU tables across the six hypervariable regions by calculating the root mean square (RMS) or quadratic mean at the genus level over all regions. RMS is a common statistical method used in multiple disciplines to compute a weighted mean or square root of means of a group of numbers. As far as we know, this procedure has not been applied previously to microbiome data in the same way that we have used it. A paper by Li, et al. used root mean square distance to fit rarefaction curves in order to detect taxonomic unitsCitation67 Second, we used whole stool homogenization in an effort to best capture the entire gut microbial community, rather than a subset. Often, gut microbiome studies determine the microbial community of the intestines by taking aliquots of stool samples. However, this practice assumes a uniform distribution of microorganisms through the feces and may not accurately represent the whole microbiome of the individual.Citation68 To rectify this issue, other researchers have been homogenizing the whole stool sample and taking aliquots after this homogenization.Citation69-Citation71
While we thoroughly evaluated microbiome change across AUD patients, we also wanted to investigate whether a core microbiota exists regardless of disease status. To address this, we compared AUD gut microbiomes to HMP gut microbiomes, finding 23 of the genera in common. The concept of a core microbiome does not require that every person has the same taxa in similar abundance, but draws attention to the shared gut bacteria in humans.Citation72-Citation74 We found five genera unique to the HMP healthy cohort and 53 genera in our AUD cohort. We also observed genera only present in >10% in our AUD cohort. The differences may be due to a range of technical issues as well as because we sequenced six hypervariable regions or biologic because of the common dietary history of our AUD cohort.
Some of the limitations of this work include small sample size and the fact that changes in the microbiome in one or two participants could affect overall results. It would be interesting to follow individuals for longer periods of time, after discharge from the hospital and after relapse, comparing the gut and oral microbiome. Small sample size, diversity of behaviors and microbiome complexity limited our ability to correlate gut microbiome changes to behavior even though our patients were deeply phenotyped. Our results connecting anxiety to gut microbiome indices need replication. However, this would be an important target for future studies because, on initiating abstinence AUD patients experience a variety of adverse behavioral responses including withdrawal, craving and negative emotionality. Negative emotionality is an important neurobiological symptom of the cycle of addiction and relapse.Citation75 There is increasing evidence that the gut microbiome might be the key to understand and perhaps could alter such behaviors. Many studies in animals and humans have found a correlation between the gut microbial communities and the host’s depression or depressive-like behaviors.Citation7,Citation10,Citation12,Citation26,Citation76,Citation77 One study found that depression correlates with decreased proportions of Prevotella and fecal transplants from depressed patients into mice elicited depression-like and anxiety-like behaviors.Citation12 A recent study, using large discovery and replication cohorts (n =1,054), found that three bacterial taxa correlated with quality of life and depression.Citation8 Additionally, modification of the microbiome by antibiotics increased depression and anxiety,Citation76 while the ingestion of a probiotic reduced these symptoms.Citation9,Citation77 Although knowledge of the gut–brain interactions is expanding, the field remains nascent as a result of complex gut microbiome and host-interactions as well as both inter- and intra-individual variation. AUD represents a particularly interesting, and potentially important context in which to investigate gut microbiome interactions because of the strong impact of heavy drinking on gut microbiota, changes that follow abstinence and changes in mood and behavior that may trigger lapse and relapse.
Conclusion and prospects
Gut dysbiosis is a dramatic consequence of heavy alcohol use. Furthermore, an inadequate diet usually coinciding with AUD may likely contribute to changes in the gut microbiome. Gut dysbiosis leads to both chronic and transient health issues and may be influenced by the amount of alcohol consumed. However, decoding the relationship between gut dysbiosis and health consequences among AUD patients is even more complex given the extreme intra-individual diversity and longitudinally evolving nature of the gut microbiome. While it is doubtful that there is a representative unique “AUD microbiome,” investigating bacterial taxa and abundance changes across individuals with varying consumption rates during recovery, may lead to a better understanding of how alcohol affects the gut microbiome.
Our study suggests that abstinence is a positive gut microbiome intervention in AUD. In many moderate and severe AUD patients, abstinence is also key in preventing further organ damage or relapse to binge drinking. However, the use of probiotics or microbiome reconstitution therapies could enhance the speed of recovery of the microbiome in AUD and potentially maintain sobriety. Alternatively, even for AUD individuals who continue to drink, some of these therapies could be applied to lessen alcohol consumption. Another important area for future research, potentially with broader health implications, is the consequences of light to moderate drinking. Future studies may shed light on specific bacterial genera and constellations of genera and their functionalities that relate to alcohol-associated pathology and behaviors. The interrelationships between the oral and gut microbiomes remain a future focus of our research.
Methods
Study overview and inclusion/exclusion criteria
This study was approved by intramural IRB of the NIH (NCT02911077) and conducted over approximately 1 y (September 2016–August 2017). Eligibility and clinical baselines were established via the NIH-approved natural history and research protocol (NCT02231840). Fifty-three participants were screened, 23 met eligibility criteria. Ten were excluded because of a body mass index of greater than 30 kg/m2. Five refused participation. Of the enrolled participants, one left the patient care unit less than 24 hours after admission and was excluded from analyses. Four other participants left before the study’s established completion criteria (two after the first week and two after week 3) but were included in the analyses. Two received clinically indicated oral antibiotics and one received antibiotic eye drops during their inpatient stay. All three were included in the analyses.
Inclusion criteria included greater than or equal to 18 y of age and admitted to the inpatient treatment unit. Participants were excluded if they were currently using or had used any of the following drugs within the last month: antibiotics, corticosteroids: inhaled, oral, intravenous or intramuscular, and immunosuppressive or cytotoxic agents. In addition, they were excluded if they took large doses of probiotics such as supplemental probiotics, ordinary dietary components such as beverages/milk or yogurt did not exclude the participant. Participants were also excluded if they had major surgery of the gastrointestinal tract, excluding cholecystectomy and appendectomy in the past 5 y, any bowel resection at any time or a history of active, uncontrolled gastrointestinal disorders and/or diseases including inflammatory bowel disease, ulcerative colitis, Crohn’s disease and/or active uncontrolled infectious gastroenteritis, colitis, or gastritis. Participants were excluded if they were enrolled in an investigational study that might affect the microbiome or taking an experimental drug, had a BMI greater than or equal to 30 kg/m2.
Clinical measures and specimens
The Clinical Institute Withdrawal Assessment – Alcohol revised (CIWA-Ar) and alcohol analysis breathalyzer were performed every 4 hours during acute withdrawal and as needed based on treatment progression (See Supplementary Figure S4).Citation47 The Alcohol Dependence Scale (ADS),Citation44 Alcohol Timeline Followback (TLFB)Citation45 (See Supplementary Figure S1) and Lifetime Drinking History (LDH)Citation46 were collected at baseline during the first week after admission. Average drinks per day were calculated over the 90 d prior to admission. Psychiatric diagnosis was made using the Structured Clinical Interview for DSM-IV (SCID-IV)Citation43 or DSM-5 (SCID-5).Citation2 Each participant completed the Brief Scale for Anxiety (BSA) and Montgomery Asberg Depression Rating Scale (MADRS) subscales of the Comprehensive Psychopathological Rating Scale (CPRS) questionnaire at 7-d intervals starting from the second day of admission.Citation48,Citation49 The Penn Alcohol Craving Scale was administered twice during inpatient admission.Citation50
Diet was measured using the NIH Clinical Center food tickets. These record the type of food as well as the percentage of serving consumed. Included also was any additional food and beverages that the patients consumed outside of room service orders. All dietary data were analyzed for nutrient content for the first week and in correlation with the stool collection day. When a stool sample was given, the dietary data for that day and the preceding day were analyzed. This timing was based on attempting to closely correlate the findings of the gut microbiome to food intake. Diet was coded using Nutrition Data System for Research software (versions 2016 and 2017, Nutrition Coordinating Center, University of Minnesota). In addition, each participant completed the Diet History Questionnaire II (DHQ II), past year food consumption with portion size, which is a 150-question food frequency questionnaire.Citation57 The DHQ II was administered electronically and completed within the first 2 weeks. Total caloric intake, fiber intake, total fat and Healthy Eating Index (HEI)Citation58 were calculated between week 1 and 4. The Bristol Stool ScaleCitation52 and the abdominal pain Numeric Rating Scale (NRS)Citation53 were administered with each stool specimen collection. The GI PROMIS®Citation54 measure was collected each week during inpatient admission.
Oral collection methods
The National Institute of Dental and Craniofacial Research dental team saw every participant, and periodontal probing, including Decayed, Missing and Filled Teeth Score (DMFT),Citation51 was done within the first week of admission. DMFT score ranges from 0 to 28. The Modified Beck’s Oral Assessment ScoreCitation78 was performed at each oral collection time point. This score ranges from 5 to 20 with higher scores reflecting poor oral health.Citation78The initial score performed at the first time point is included in .
The oral microbiome was measured by tongue brushing samples that match the baseline stool collection and was collected in most cases within 24 hours of the stool samples. Participants were asked to refrain from eating, drinking (except sips of water), and performing any oral care at least 2 hours before the oral specimen collection. Most of the oral specimens were collected around 6 am when the participants were awakened for assessments and vital signs. Tongue brushings were collected using sterile cytology brushes. Two specimens were obtained from each research participant at each collection time point. The tongue was brushed for 10–20 seconds from front to back. The brush was cut with sterile scissors and dropped into a sterile Eppendorf tube containing a buffer solution 1 ml sterile purified buffer solution (PBS) and refrigerated. The oral specimens were processed within 8 hours. The Eppendorf tube was vortexed then centrifuged at 13,000 rpm for 5 minutes and the brush was removed and re-centrifuged. The pellet was then stored at −80°C freezer for long-term storage before DNA extraction.
Stool collection
Stool samples were collected and processed for bacterial DNA and stored. A maximum of one sample per day during the first 7 d of admission and one per week in the 3 weeks following was obtained ().
Before a participant produced a stool sample, a trained nurse placed a collection container (Covidien, Dublin, Ireland) between the toilet seat and the bowl while wearing gloves. Following the patient’s defecation, the nurse donned new sterile gloves and transferred the entire stool specimen into a sterile bag (Whirl-Pak ®, Nasco, Fort Atkinson, WI) in a 1 L triangular-graduated cylinder with a sterile tongue depressor. The bag was sealed with a clip (Seward Ltd, West Sussex, UK) and transferred to a −20°C freezer within 15 minutes. The stool specimens could remain in the −20°C a maximum of 3 d before being processed for long-term storage. This procedure followed information that was suggested best practices for gut microbiome processing.Citation69
Stool storage conditions and homogenization procedures
Stool samples were thawed and diluted 1:2 with phosphate-buffered saline (1X PBS, pH =7.4). Samples were homogenized in a Stomacher 400 circulator blender (Seward Ltd, Worthing, West Sussex, UK) at 230 rpm for 2 minutes.Citation79,Citation80 To remove particular matter, homogenate was poured into a filter bag with 0.5 mm pores (Seward Ltd, Worthing, West Sussex, UK). Aliquots of filtered homogenate were pipetted into 2 mL microcentrifuge safe-lock tubes (Eppendorf, Fisher Scientific, Pittsburgh, PA) and placed in a −80°C freezer for long-term storage before DNA extraction.
Bacterial DNA extraction and sequencing
Before DNA extraction, an aliquot of approximately 2 mL of diluted stool was thawed. Oral samples were thawed and the pellet was examined and re-suspended in 200 µl of PBS. DNA extraction was completed using the PowerMag Microbiome RNA/DNA isolation kit (Qiagen Sciences, LLC, Germantown, MD), according to manufacturer’s instructions for both oral and stool samples. In order to break cell walls, bead beating was performed using a TissueLyser II 96-well plate shaking instrument (Qiagen Sciences, LLC, Germantown, MD) according to the PowerMag Microbiome RNA/DNA isolation protocol. Bacterial DNA extraction used a protocol optimized for the KingfisherTM Duo Prime Purification System (ThermoFisher Scientific, Waltham, MA). Amplification of the seven hypervariable regions of the 16 S rRNA gene was accomplished using the Ion 16 S Metagenomics Kit (ThermoFisher Scientific, Waltham, MA). Twenty nanograms of DNA was used for further amplification using the amplicon primer sets P1, which amplifies v2-4-8, and P2, which amplifies v3-67-9, for 25 cycles. Amplicon integrity was measured using the BioAnalyzer high sensitivity DNA kit (Agilent Technologies, Santa Clara, CA).
DNA from both primer sets was pooled and purified with Ampure XP beads (Beckman Coulter, Brea, CA), and libraries were prepared with the Ion Fragment Kit (ThermoFisher Scientific, Waltham, MA). One hundred ng of amplified DNA was end-repaired and barcoded via ligation. This was then purified with Ampure XP beads and further amplified in five cycles, following manufacturer’s instructions. Following a final Ampure XP bead purification, library integrity was determined with the BioAnalyzer, and libraries were quantitated using the Qubit and diluted to 100 pM. Oil amplification was used to template libraries on beads, via the Ion PGM HiQ View One Touch 2 System using the OT2 520/530 Kit (ThermoFisher Scientific, Waltham, MA), as described by the manufacturer. Template-positive libraries were sequenced on the Ion Torrent S5 XL semiconductor sequencer S5 Ion Torrent using the Ion S5 sequencing reagents on an Ion 530 chip. Samples that did not meet the threshold (450,000 reads for stool and 150,000 reads for oral samples) were re-sequenced. Fastq files from like samples were merged resulting in a total of 158 fastq files to be submitted for OTU processing for gut microbiome. A total of 22 oral samples matched to baseline stool samples were processed. The majority of oral samples were collected within 24 hours of the stool collection.
Mock microbiome standard samples containing 20 different species of bacteria, even in concentration: ATCC® MSA-1002; and staggered in concentration: ATCC® MSA-1003 (American Type Culture Collection [ATCC], Manassas, Virginia) were sequenced with every chip as a method to validate both the sequencing procedure and statistical analysis pipeline.
Data and statistical analysis pipeline
Sequence file pre-processing
We used Ion Torrent Suite version 5.0.5 to map bacterial DNA sequences. Fastq files generated by the S5 were transferred to an external hard drive using the file exporter plug-in version 5.0.3.1 and deposited to a secure NIH server. Next, data were submitted for data processing per method previously published.Citation81 Reads were filtered using fastq_filter from usearch v11 (with arguments fastq_max 50 and fastq_trunclen 200).Citation82 Secondly, read labels were edited to contain the sample name so that files could be combined later in the workflow to mimic multiplexed data. Edited and filtered fasta files were combined into one large file. Data were then divided into 12 subsets based on their targeted hypervariable regions (v2 forward, v2 reverse, v3 forward, v3 reverse, v4 forward, v4 reverse, v67 forward, v67 reverse, v8 forward, v8 reverse, v9 forward, v9 reverse) using Thermo Fisher proprietary primer sequences. A Python script Split_On_Primers.py (https://github.com/Y-Lammers/Split_on_Primer) was used to split the reads by targeted region. Primer sequences were removed using fastx_truncate from the FASTX_Toolkit suite of tools (http://hannonlab.cshl.edu/fastx_toolkit/). Reverse reads were reverse complemented into the forward direction using fastx_reverse_complement from the FASTX_Toolkit. Reverse complemented reads were concatenated to the forward reads for additional processing.
OTU table generation and combined OTU tables
The OTU and denoising pipeline followed USEARCH v11 recommended procedures (https://www.drive5.com/usearch/manual/uparse_pipeline.html). In short, reads were dereplicated using fastx_uniques, chimeras were filtered and OTUs were clustered with 97% identity using cluster_otus, usearch_global was used for OTU table generation, reads were normalized to 5 k reads per sample using otutab_norm, taxonomy prediction was carried out using SINTAXCitation83 and RDP version 16 as the reference database. Shannon diversity index (SDI) was computed using alpha_div in USEARCHv11. OTU tables were imported into the JMP Discovery Software (SAS, Cary, NC) for data discovery, manipulation, conclusion drawing and interpretation. Each OTU table from regions v2, v3, v4, v67 and v8 was summarized at the genus level. The OTU table from region v9 was not included in this analysis based on findings already publishedCitation81. OTU counts mapped to the same genus were added together in order to obtain one summed count per genus. Once genus level summed counts were obtained for each region, all tables were merged by genus. All genera from any region were included in the resulting final table of counts. Finally, reconstructed counts were calculated by taking the root mean square (RMS) of each genus over all regions:
where n is the total number of non-missing or non-zero regions. Finally, the relative abundance for each sample was calculated on the reconstructed counts.
Binary Sorenson–Dice Dissimilarity (BSDD) index calculation
The Binary Sorenson–Dice Dissimilarity index was used to assess how an individual’s microbiota entering the inpatient treatment program changed during alcohol abstinenceCitation55. Pairwise comparisons were made between a patient’s first sample and each successive daily sample within the first week and weekly sample thereafter during the detoxification process. In order to achieve this, first, genus-level data were merged together across all V regions. The raw read count data were changed to binary [0 or 1] if a genus had a read count of five or greater for any of the five regions. This conversion was made for each sample so that a resulting binary data matrix was achieved. In order to calculate a BSDD for each patient, pairwise comparisons were made between a patient’s first sample and each successive sample thereafter (i.e. first sample to second sample; first sample to third sample; first sample to fourth sample … first sample to week 2; first sample to week 3; first sample to week 4). At the most, one patient could have 9 BSDD values even if they provided ten samples throughout the course of the study. The BSDD calculation can be explained as Dissimilarity = 1 – Similarity where the similarity is calculated by multiplying the number of genera in common in both sets by 2 and then by dividing that number by the sum of genera in both sets.
The JMP Statistical DiscoveryTM software tool, version 11 (Cary, NC) generated incidence plots, scatterplots, 3D scatterplots, one-way plots, box plots and relative abundance bar charts. Results are reported at the genus level, and OTUs assigned to the same genus were summed to give a total read count at the genus level.
Principal component analysis visualization
Genus level RMS values were submitted to Principal Component Analysis in the MSCL Analyst’s Toolbox written by JJB in the JMP Scripting language. The first three PCs were visualized in a 3D Scatterplot by drinking group in order to visualize how each sample PC related to one other. Density ellipses were drawn around 50% of each participant’s samples in order to visualize the spread of the data within an individual. Each individual’s samples were labeled by a unique color. Average PC across patients for each group and time point (denoted group_time) was calculated for each drinking group in order to see if a time point effect existed within the PCs. A one-way overlay plot by average PC (y-axis, PC1, PC2, PC3) versus time point (ten total time points) was plotted for both groups. Average group_time PCs were plotted in a 3D scatter plot. Each average PC value was labeled by VHD (blue) and LHD (Red). Triangle icon markers were used to identify the first time point and the last time point.
Data from the human microbiome project
Final OTU tables for gut and oral microbiome (tongue dorsum samples) from both the V13 and V35 targeted regions were obtained from the HMPdacc web portal (https://www.hmpdacc.org/hmp/HMQCP/). Genus level data were obtained by summing the total counts across OTUs from the same genera. For gut microbiome, a total of 175 primary sample numbers (PSN) were found for the V13 table and 309 PSNs were found for the V35 table. For tongue dorsum, a total of 178 unique PSNs for the V13 table and a total of 305 unique PSNs were found for the V35 table. For both sets of data (gut and oral), duplicate samples across the two tables were combined using the root mean square. The resulting combined table counts for gut are comprised of 465 unique genera and 323 unique fecal samples. The resulting combined table counts for tongue dorsum are comprised of 396 unique genera and 320 unique tongue dorsum samples. In order to calculate the presence or absence of a genus, a binary variable (0 for absent, 1 for present) was created if a genus had a count of five or more for a sample. This binary variable is deemed as “Genus Present.” The average genus present was calculated over the entire 323 fecal samples and 320 tongue samples. If a genus was present in 10% or more of the fecal samples, we called this genus part of the “core microbiota” derived from the healthy samples. In order to compare the HMP healthy control, fecal samples were joined with our AUD cohort of patients, by genus. In addition, “core microbiota” from the healthy control data from both the fecal and tongue brushings were joined by genus in order to investigate the overlap of genera present between an oral and fecal sample.
Establishing a core microbiota in AUD patients
A core microbiota was established in the AUD patients by the following protocol. A genus was deemed as present in the AUD patient cohort if it had a maximum root mean square (max_rms) count across all time points within that patient of 5 or greater. The average max_rms across all AUD patients was calculated. Just as with the HMP core microbiota calculation above, if a genus was found to be present in at least 10% of the AUD patients, then that genera was deemed as part of the “core microbiota” of the AUD patient cohort. This process was done for the fecal and oral samples.
Comparing the HMP and the AUD microbiomes
The concept of a gut core microbiome is still a topic of much controversy. In an effort to understand this better, we compared the highly prevalent genus level gut taxa from the human microbiome project to highly prevalent genus level gut taxa from our AUD participants. This was done in an effort to explore any overlapping taxa found in the gut from a healthy population and those from a population with high levels of alcohol consumption (Figure S3).
In another similar type of investigation, we wanted to determine the overlap between oral/gut taxa themselves within a healthy group versus that of an AUD group. Highly prevalent taxa found in both the stool and the tongue dorsum samples from a healthy population (HMP) was compared and the overlap between the two was determined ()). Highly prevalent taxa found in both the stool and oral samples from the AUD participants were also compared and the overlap investigated ()). In order to investigate the concept of a gut “core microbiota” in healthy controls versus AUD participants, genera found in the HMP fecal data were joined to the core genera found in the AUD fecal samples. The number of overlap in gut microbiota between these two groups (HMP and AUD) was determined and reported.
Antibiotic use analysis
Participants were excluded from the protocol if they were currently or in the recent past had been on antibiotics (AB). However, if the participants received AB during their inpatient treatment for a clinical reason, they remained on the protocol. In an attempt to see if antibiotic use affected stool consistency of these participants, each specimen’s Bristol Stool Scale was investigated 1 d after the start of antibiotics and through the course of their antibiotic regimen. In addition, since it is suggested that antibiotic use may affect the Shannon Diversity index (SDI) of a sample, the SDI values were analyzed within each patient’s ten samples in order to determine if a change was observed 1-d post AB use through the course of the regimen. Finally, global genus-level changes were investigated between patients taking AB and those not on AB.
Disclosure of potential conflicts of interest
The authors have declared no conflicts of interest.
Authors Contributions
Nancy Ames – principal investigator, designed the protocol, collected specimens, analyzed the data and wrote the manuscript. Co-first author.
Jennifer Barb – Assisted with the design of the protocol analyzed the microbiome specimens. Developed the pipeline and RMS processes. Wrote major sections of the manuscript. Co-first author.
Kornel Schuebel – assisted with study design and supervised/and or performed all laboratory procedures.
Sarah Mudra – assisted with study design; performed the majority of the lab work, analyzed specimens, edited the manuscript.
Brianna Meeks: analyzed data, assisted with sequencing, contributed to the writing and editing of the manuscript.
Kelly Ratteree and Shanna Bernstein – collected and analyzed dietary data, edited manuscript.
Gwenyth Wallen – collaborated on the conceptualization of the original research aims and study design, provided revisions to the manuscript.
Ralph Tuason – collected specimens analyzed data and provided revisions to the manuscript.
Nancy Diazgranados – assisted with the design of the protocol, provided expertise regarding AUD and consulted on the manuscript.
Narjis Kazmi – edited the manuscript and analyzed data.
Alyssa Brooks – assisted with the design of the study. Collected data and revised manuscript.
Michael Krumlauf – assisted with the design of the study and collected specimens.
David Goldman – assisted with the design of the original protocol. Provided critical analysis of the manuscript and editing.
Data Availability
The microbiome sequencing data are available at the Sequencing Read Archive (SRA) at https://www.ncbi.nlm.nih.gov/sra/docs/. The accession number for the data is PRJNA575744. The oral sequencing data is available URL: https://www.ncbi.nlm.nih.gov/sra/PRJNA634528. The ascension number is PRJNA634528.
Supplemental Material
Download Zip (1.9 MB)Acknowledgements
We would like to thank the nurses, physicians and other research staff who assisted with this study on the 1 Southeast Unit at the Clinical Center, NIH, and the staff of the National Institute of Dental and Craniofacial Research dental clinic. Additionally, we greatly appreciate all the patients who participated for their time and dedication in completing the study.
Supplementary material
Supplemental data for this article can be accessed on the publisher’s website.
Additional information
Funding
References
- Gilmore W, Chikritzhs T, Stockwell T, Jernigan D, Naimi T, Gilmore I. Alcohol: taking a population perspective. Nat Rev Gastroenterol Hepatol. 2016;13(7):426–434. doi:10.1038/nrgastro.2016.70.
- American Psychiatric Association. Diagnostic and Statistical Manual of Mental Disorders, 5th ed. Arlington (VA): American Psychiatric Publishing; 2013.
- Grant BF, Chou SP, Sha TD, Pickering RP, Kerridege BT, Ruan WJ, Huang B, Jung, J, Zhang H, Fan A, et al. Prevalence of 12-month alcohol use, high-risk drinking, and DSM-Iv alcohol use disorder in the United States, 2001-2002 to 2012-2013: results from the national epidemiologic survey on alcohol and related conditions. JAMA Psychiatry. 2017;74(9):911–923. doi:10.1001/jamapsychiatry.2017.2161.
- Substance Abuse and Mental Health Services Administration (SAMHSA) Key substance us and mental health indicators in the United States: results from the 2017 national survey on drug use and health. N.S.H.-. HHS Publicaiton No. SMA 18-5068, Editor. Rockville (MD): Center for Behavioral Health Statistics and Quality, Substance Abuse and Mental Health Services Administration; 2018.
- Hillemacher T, Bachmann O, Kahl KG, Frieling H. Alcohol, microbiome, and their effect on psychiatric disorders. Prog Neuropsychopharmacol Biol Psychiatry. 2018;85:105–115. doi:10.1016/j.pnpbp.2018.04.015.
- Leclercq S, Cani PD, Neyrinck AM, Stärkel P, Jamar F, Mikolajczak M, Delzenne NM, de Timary P. Role of intestinal permeability and inflammation in the biological and behavioral control of alcohol-dependent subjects. Brain Behav Immun. 2012;26(6):911–918. doi:10.1016/j.bbi.2012.04.001.
- Leclercq S, Matamoros S, Cani PD, Neyrinck AM, Jamar F, Stärkel P, Windey K, Tremaroli V, Bäckhed F, Verbeke K, et al. Intestinal permeability, gut-bacterial dysbiosis, and behavioral markers of alcohol-dependence severity. Proc Natl Acad Sci U S A. 2014;111(42):E4485–93. doi:10.1073/pnas.1415174111.
- Valles-Colomer M, Falony G, Darzi Y, Tigchelaar EF, Wang J, Tito RY, Schiweck C, Kurilshikov A, Joossens M, Wijmenga C, et al. The neuroactive potential of the human gut microbiota in quality of life and depression. Nat Microbiol. 2019;4(4):623–632. doi:10.1038/s41564-018-0337-x.
- Bravo JA, Forsythe P, Chew MV, Escaravage E, Savignac HM, Dinan TG, Bienenstock J, Cryan JF. Ingestion of Lactobacillus strain regulates emotional behavior and central GABA receptor expression in a mouse via the vagus nerve. Proc Natl Acad Sci U S A. 2011;108(38):16050–16055. doi:10.1073/pnas.1102999108.
- Jiang H, Ling Z, Zhang Y, Mao H, Ma Z, Yin Y, Wang W, Tang W, Tan Z, Shi J, et al. Altered fecal microbiota composition in patients with major depressive disorder. Brain Behav Immun. 2015;48:186–194. doi:10.1016/j.bbi.2015.03.016.
- Kelly JR, Borre Y, O’ Brien C, Patterson E, El Aidy S, Deane J, Kennedy PJ, Beers S, Scott K, Moloney G, et al. Transferring the blues: depression-associated gut microbiota induces neurobehavioural changes in the rat. J Psychiatr Res. 2016;82:109–118. doi:10.1016/j.jpsychires.2016.07.019.
- Zheng P, Zeng B, Zhou C, Liu M, Fang Z, Xu X, Zeng L, Chen J, Fan S, Du X, et al. Gut microbiome remodeling induces depressive-like behaviors through a pathway mediated by the host’s metabolism. Mol Psychiatry. 2016;21(6):786–796. doi:10.1038/mp.2016.44.
- Wong M-L, Inserra A, Lewis MD, Mastronardi CA, Leong L, Choo J, Kentish S, Xie P, Morrison M, Wesselingh SL, et al. Inflammasome signaling affects anxiety- and depressive-like behavior and gut microbiome composition. Mol Psychiatry. 2016;21(6):797–805. doi:10.1038/mp.2016.46.
- Patel S, Behara R, Swanson G, Forsyth C, Voigt R, Keshavarzian A. Alcohol and the Intestine. Biomolecules. 2015;5(4):2573–2588. doi:10.3390/biom5042573.
- Capurso G, Lahner E. The interaction between smoking, alcohol and the gut microbiome. Best Pract Res Clin Gastroenterol. 2017;31(5):579–588. doi:10.1016/j.bpg.2017.10.006.
- Vassallo G, Mirijello A, Ferrulli A, Antonelli M, Landolfi R, Gasbarrini A, Addolorato G. Review article: alcohol and gut microbiota – the possible role of gut microbiota modulation in the treatment of alcoholic liver disease. Aliment Pharmacol Ther. 2015;41(10):917–927. doi:10.1111/apt.13164.
- Flores-Bastias O, Karahanian E. Neuroinflammation produced by heavy alcohol intake is due to loops of interactions between Toll-like 4 and TNF receptors, peroxisome proliferator-activated receptors and the central melanocortin system: A novel hypothesis and new therapeutic avenues. Neuropharmacology. 2018;128:401–407. doi:10.1016/j.neuropharm.2017.11.003.
- Jeynes KD, Gibson EL. The importance of nutrition in aiding recovery from substance use disorders: A review. Drug Alcohol Depend. 2017;179:229–239. doi:10.1016/j.drugalcdep.2017.07.006.
- Shi G, Zhong S. Alcohol-associated cancer and deregulation of Pol III genes. Gene. 2017;612:25–28. doi:10.1016/j.gene.2016.09.046.
- Barr T, Helms C, Grant K, Messaoudi I. Opposing effects of alcohol on the immune system. Prog Neuropsychopharmacol Biol Psychiatry. 2016;65:242–251. doi:10.1016/j.pnpbp.2015.09.001.
- Rodrigues P, Santos-Ribeiro S, Teodoro T, Gomes FV, Leal I, Reis JP, Goff DC, Gonçalves A, Lima JAC. Association between alcohol intake and cardiac remodeling. J Am Coll Cardiol. 2018;72(13):1452–1462. doi:10.1016/j.jacc.2018.07.050.
- Rehm J, Imtiaz S. A narrative review of alcohol consumption as a risk factor for global burden of disease. Subst Abuse Treat Prev Policy. 2016;11(1):37. doi:10.1186/s13011-016-0081-2.
- Dubinkina VB, Tyakht AV, Odintsova VY, Yarygin KS, Kovarsky BA, Pavlenko AV, Ischenko DS, Popenko AS, Alexeev DG, Taraskina AY, et al. Links of gut microbiota composition with alcohol dependence syndrome and alcoholic liver disease. Microbiome. 2017;5(1). doi:10.1186/s40168-017-0359-2.
- Mutlu EA, Gillevet PM, Rangwala H, Sikaroodi M, Naqvi A, Engen PA, Kwasny M, Lau CK, Keshavarzian A. Colonic microbiome is altered in alcoholism. Am J Physiol Gastrointestinal Liver Physiol. 2012;302(9):G966–G978. doi:10.1152/ajpgi.00380.2011.
- Maes M, Kubera M, Leunis J-C, Berk M, Geffard M, Bosmans E. In depression, bacterial translocation may drive inflammatory responses, oxidative and nitrosative stress (O&NS), and autoimmune responses directed against O&NS-damaged neoepitopes. Acta Psychiatr Scand. 2013;127(5):344–354. doi:10.1111/j.1600-0447.2012.01908.x.
- Bull-Otterson L, Feng W, Kirpich I, Wang Y, Qin X, Liu Y, Gobejishvili L, Joshi-Barve S, Ayvaz T, Petrosino J, et al. Metagenomic analyses of alcohol induced pathogenic alterations in the intestinal microbiome and the effect of Lactobacillus rhamnosus GG treatment. PLoS One. 2013;8(1):e53028. doi:10.1371/journal.pone.0053028.
- Kirpich IA, Petrosino J, Ajami N, Feng W, Wang Y, Liu Y, Beier JI, Barve SS, Yin X, Wei X, et al. Saturated and unsaturated dietary fats differentially modulate ethanol-induced changes in gut microbiome and metabolome in a mouse model of alcoholic liver disease. Am J Pathol. 2016;186(4):765–776. doi:10.1016/j.ajpath.2015.11.017.
- Severance EG, Gressitt KL, Stallings CR, Origoni AE, Khushalani S, Leweke FM, Dickerson FB, Yolken RH. Discordant patterns of bacterial translocation markers and implications for innate immune imbalances in schizophrenia. Schizophr Res. 2013;148(1–3):130–137. doi:10.1016/j.schres.2013.05.018.
- Gondalia S, Parkinson L, Stough C, Scholey A. Gut microbiota and bipolar disorder: a review of mechanisms and potential targets for adjunctive therapy. Psychopharmacology (Berl). 2019;236(5):1433–1443. doi:10.1007/s00213-019-05248-6.
- Sliedrecht W, de Waart R, Witkiewitz K, Roozen HG. Alcohol use disorder relapse factors: A systematic review. Psychiatry Res. 2019;278:97–115. doi:10.1016/j.psychres.2019.05.038.
- Erny D, Hrabě de Angelis AL, Jaitin D, Wieghofer P, Staszewski O, David E, Keren-Shaul H, Mahlakoiv T, Jakobshagen K, Buch T, et al. Host microbiota constantly control maturation and function of microglia in the CNS. Nat Neurosci. 2015;18(7):965-+. doi:10.1038/nn.4030.
- Yano JM, Yu K, Donaldson G, Shastri G, Ann P, Ma L, Nagler C, Ismagilov R, Mazmanian S, Hsiao E, et al. Indigenous bacteria from the gut microbiota regulate host serotonin biosynthesis. Cell. 2015;161(2):264–276. doi:10.1016/j.cell.2015.02.047.
- Morrison DJ, Preston T. Formation of short chain fatty acids by the gut microbiota and their impact on human metabolism. Gut Microbes. 2016;7(3):189–200. doi:10.1080/19490976.2015.1134082.
- Rios-Covian D, Ruas-Madiedo P, Margolles A, Gueimonde M, de Los Reyes-gavilán CG, Salazar N. Intestinal short chain fatty acids and their link with diet and human health. Front Microbiol. 2016;7:185. doi:10.3389/fmicb.2016.00185.
- Kakiyama G, Hylemon PB, Zhou H, Pandak WM, Heuman DM, Kang DJ, Takei H, Nittono H, Ridlon JM, Fuchs M, et al. Colonic inflammation and secondary bile acids in alcoholic cirrhosis. Am J Physiol Gastrointestinal Liver Physiol. 2014;306(11):G929–G937. doi:10.1152/ajpgi.00315.2013.
- Xie G, Zhong W, Li H, Li Q, Qiu Y, Zheng X, Chen H, Zhao X, Zhang S, Zhou Z, et al. Alteration of bile acid metabolism in the rat induced by chronic ethanol consumption. Faseb J. 2013;27(9):3583–3593. doi:10.1096/fj.13-231860.
- Koob GF, Colrain IM. Alcohol use disorder and sleep disturbances: a feed-forward allostatic framework. Neuropsychopharmacology. 2020;45(1):141–165.
- Wolfe SA, Workman ER, Heaney CF, Niere F, Namjoshi S, Cacheaux LP, Farris SP, Drew MR, Zemelman BV, Harris RA, et al. FMRP regulates an ethanol-dependent shift in GABABR function and expression with rapid antidepressant properties. Nat Commun. 2016;7(1):12867. doi:10.1038/ncomms12867.
- Lamont RJ, Koo H, Hajishengallis G. The oral microbiota: dynamic communities and host interactions. Nat Rev Microbiol. 2018;16(12):745–759. doi:10.1038/s41579-018-0089-x.
- Fan X, Peters BA, Jacobs EJ, Gapstur SM, Purdue MP, Freedman ND, Alekseyenko AV, Wu J, Yang L, Pei Z, et al. Drinking alcohol is associated with variation in the human oral microbiome in a large study of American adults. Microbiome. 2018;6(1):59. doi:10.1186/s40168-018-0448-x.
- Segata N, Haake S, Mannon P, Lemon KP, Waldron L, Gevers D, Huttenhower C, Izard J. Composition of the adult digestive tract bacterial microbiome based on seven mouth surfaces, tonsils, throat and stool samples. Genome Biol. 2012;13(6):R42. doi:10.1186/gb-2012-13-6-r42.
- Gao L, Xu T, Huang G, Jiang S, Gu Y, Chen F. Oral microbiomes: more and more importance in oral cavity and whole body. Protein Cell. 2018;9(5):488–500. doi:10.1007/s13238-018-0548-1.
- American Psychiatric Association Diagnostic and Statistical Manual of Mental Disorders, 4th ed., Text Revisison.Arlington (VA): American Psychiatric Associaton; 2000.
- Skinner HA, Allen BA. Alcohol dependence syndrome: measurement and validation. J Abnorm Psychol. 1982;91(3):199–209. doi:10.1037/0021-843X.91.3.199.
- Sobell LC, Sobell MB. Timeline followback user’s guide: a calendar method for assessing alcohol and drug use. Torronto (Canada): Addiction Research Foundation; 1996.
- Koenig LB, Jacob T, Haber JR. Validity of the lifetime drinking history: a comparison of retrospective and prospective quantity-frequency measures. J Stud Alcohol Drugs. 2009;70(2):296–303. doi:10.15288/jsad.2009.70.296.
- Sullivan JT, Sykora K, Schneiderman J, Naranjo CA, Sellers EM. Assessment of alcohol withdrawal: the revised clinical institute withdrawal assessment for alcohol scale (CIWA-Ar). Br J Addict. 1989;84(11):1353–1357. doi:10.1111/j.1360-0443.1989.tb00737.x.
- Svanborg P, Asberg M. A new self-rating scale for depression and anxiety states based on the comprehensive psychopathological rating scale. Acta Psychiatr Scand. 1994;89(1):21–28. doi:10.1111/j.1600-0447.1994.tb01480.x.
- Herrmann N, Black SE, Lawrence J, Szekely C, Szalai JP. The sunnybrook stroke study: a prospective study of depressive symptoms and functional outcome. Stroke. 1998;29(3):618–624. doi:10.1161/01.STR.29.3.618.
- Flannery BA, Volpicelli JR, Pettinati HM. Psychometric properties of the penn alcohol craving scale. Alcohol Clin Exp Res. 1999;23(8):1289–1295. doi:10.1111/j.1530-0277.1999.tb04349.x.
- Centers for Disease Control and Prevention. Oral Health Surveillance Report: Trends in Dental Caries and Sealants, Tooth Retention, and Edentulism, United States, 1999–2004 to 2011–2016. Atlanta (GA): Centers for Disease Control and Prevention, US Dept of Health and Human Services. 2019.
- Lewis SJ, Heaton KW. Stool form scale as a useful guide to intestinal transit time. Scand J Gastroenterol. 1997;32(9):920–924. doi:10.3109/00365529709011203.
- Spiegel B, BOLUS R, HARRIS LA, LUCAK S, NALIBOFF B, ESRAILIAN E, CHEY WD, LEMBO A, KARSAN H, TILLISCH K, et al. Measuring irritable bowel syndrome patient-reported outcomes with an abdominal pain numeric rating scale. Aliment Pharmacol Ther. 2009;30(11–12):1159–1170. doi:10.1111/j.1365-2036.2009.04144.x.
- Spiegel BM, Hays RD, Bolus R, Melmed GY, Chang L, Whitman C, Khanna PP, Paz SH, Hays T, Reise S, et al. Development of the NIH Patient-Reported Outcomes Measurement Information System (PROMIS) gastrointestinal symptom scales. Am J Gastroenterol. 2014;109(11):1804–1814. doi:10.1038/ajg.2014.237.
- Moeller AH, Suzuki TA, Phifer-Rixey M, Nachman MW. Transmission modes of the mammalian gut microbiota. Science. 2018;362(6413):453–457. doi:10.1126/science.aat7164.
- Methe BA, Nelson KE, Pop M, Creasy HH, Giglio MG, Huttenhowe C, Gevers D, Petrosino JF, Abubucker S, Badger JH, et al. A framework for human microbiome research. Nature. 2012;486(7402):215–221. doi:10.1038/nature11209.
- National Institutes of Health, National Cancer Institute. Diet history questionnaire, Version 2.0. Bethesda (MD): National Institutes of Health, Epidemiology and Genomics Research Program, National Cancer Institute; 2010.
- Schap T, Kuczynski K, Hiza H. Healthy eating index-beyond the score. J Acad Nutr Diet. 2017;117(4):519–521. doi:10.1016/j.jand.2017.02.002.
- HEI-2010 Total and Component Scores for Children, Adults, and Older Adults During 2007-2008. 2016 [accessed 2019 Oct 25]; Available from: https://fns-prod.azureedge.net/sites/default/files/HEI-2010-During-2007-2008-Oct21-2016.pdf.
- Llopis M, Cassard A, Wrzosek L, Boschat L, Bruneau A, Ferrere G, Puchois V, Martin JC, Lepage P, Le Roy T, et al. Intestinal microbiota contributes to individual susceptibility to alcoholic liver disease. Gut. 2016;65(5):830–839.
- Kaakoush NO. Insights into the role of erysipelotrichaceae in the human host. Front Cell Infect Microbiol. 2015;5:84. doi:10.3389/fcimb.2015.00084.
- Labus JS, Osadchiy V, Hsiao EY, Tap J, Derrien M, Gupta A, Tillisch K, Le Nevé B, Grinsvall C, Ljungberg M, et al. Evidence for an association of gut microbial Clostridia with brain functional connectivity and gastrointestinal sensorimotor function in patients with irritable bowel syndrome, based on tripartite network analysis. Microbiome. 2019;7(1):45. doi:10.1186/s40168-019-0656-z.
- Manicone PF, Tarli C, MirijelloA, RaffaelliL, Vassallo GA, Antonelli M, Rando MM, Mosoni C, Cossari A, Lavorgna L, et al. Dental health in patients affected by alcohol use disorders: a cross-sectional study. Eur Rev Med Pharmacol Sci. 2017;21(22):5021–5027. doi:10.26355/eurrev_201711_13811.
- Cryan JF, O'Riordan KJ, Cowan CSM, Sandhu KV, Batiaanssen TFS, Boehme M, Codagnone MG, Cussotto S, Fulling C, Golubeva AV, et al. The microbiota-gut-brain axis. Physiol Rev. 2019;99(4):1877–2013.
- Ross LJ, Wilson M, Banks M, Rezannah F, Daglish M. Prevalence of malnutrition and nutritional risk factors in patients undergoing alcohol and drug treatment. Nutrition. 2012;28(7–8):738–743. doi:10.1016/j.nut.2011.11.003.
- Fuks G, Elgart M, Amir A, Zeisel A, Turnbaugh PJ, Soen Y, Shental N. Combining 16S rRNA gene variable regions enables high-resolution microbial community profiling. Microbiome. 2018;6(1):17. doi:10.1186/s40168-017-0396-x.
- Li K, Bihan M, Yooseph S, Methé BA. Analyses of the microbial diversity across the human microbiome. PLoS One. 2012;7(6):e32118. doi:10.1371/journal.pone.0032118.
- Hsieh Y-H, Peterson CM, Raggio A, Keenan MJ, Martin RJ, Ravussin E, Marco ML. Impact of different fecal processing methods on assessments of bacterial diversity in the human intestine. Front Microbiol. 2016;7:1643. doi:10.3389/fmicb.2016.01643.
- Gorzelak MA, Gill SK, Tasnim N, Ahmadi-Vand Z, Jay M, Gibson DL. Methods for improving human gut microbiome data by reducing variability through sample processing and storage of stool. PLoS One. 2015;10(8):e0134802. doi:10.1371/journal.pone.0134802.
- Santiago A, Panda S, Mengels G, Martinez X, Azpiroz F, Dore J, Guarner F, Manichanh C. Processing faecal samples: a step forward for standards in microbial community analysis. BMC Microbiol. 2014;14(1):112. doi:10.1186/1471-2180-14-112.
- Shaw AG, Sim K, Powell E, Cornwell E, Cramer T, McClure ZE, Li M-S, Kroll JS. Latitude in sample handling and storage for infant faecal microbiota studies: the elephant in the room? Microbiome. 2016;4(1):40. doi:10.1186/s40168-016-0186-x.
- Huttenhower C, Gevers D, Knight R, Abubucker S, Badger JH, Chinwalla AT, Creasy HH, Earl AM. FitzGerald MG, Fulton RS, et al.Structure, function and diversity of the healthy human microbiome. Nature. 2012;486(7402):207–214. doi:10.1038/nature11234.
- Aguirre de Carcer D. The human gut pan-microbiome presents a compositional core formed by discrete phylogenetic units. Sci Rep. 2018;8(1):14069. doi:10.1038/s41598-018-32221-8.
- Huse SM, Ye Y, Zhou Y, Fodor AA. A core human microbiome as viewed through 16S rRNA sequence clusters. PLoS One. 2012;7(6):e34242. doi:10.1371/journal.pone.0034242.
- Kwako LE, Koob GF. Neuroclinical framework for the role of stress in addiction, Vol. 1. Thousand Oaks (CA): Chronic Stress; 2017. doi:10.11772470547017698140.
- Lurie I, Yang Y-X, Haynes K, Mamtani R, Boursi B. Antibiotic exposure and the risk for depression, anxiety, or psychosis: a nested case-control study. The Journal of Clinical Psychiatry. 2015;76(11):1522-+. doi:10.4088/JCP.15m09961.
- Akkasheh G, Kashani-Poor Z, Tajabadi-Ebrahimi M, Jafari P, Akbari H, Taghizadeh M, Memarzadeh MR, Asemi Z, Esmaillzadeh A. Clinical and metabolic response to probiotic administration in patients with major depressive disorder: A randomized, double-blind, placebo-controlled trial. Nutrition. 2016;32(3):315–320. doi:10.1016/j.nut.2015.09.003.
- Beck S. Impact of a systematic oral care protocol on stomatitis after chemotherapy. Cancer Nurs. 1979;2(3):185–199. doi:10.1097/00002820-197906000-00002.
- Fava F, Gitau R, Griffin BA, Gibson GR, Tuohy KM, Lovegrove JA. The type and quantity of dietary fat and carbohydrate alter faecal microbiome and short-chain fatty acid excretion in a metabolic syndrome ‘at-risk’ population. Int J Obes (Lond). 2013;37(2):216–223. doi:10.1038/ijo.2012.33.
- Abadias M, Usall J, Oliveira M, Alegre I, Viñas I. Efficacy of neutral electrolyzed water (NEW) for reducing microbial contamination on minimally-processed vegetables. Int J Food Microbiol. 2008;123(1–2):151–158. doi:10.1016/j.ijfoodmicro.2007.12.008.
- Barb JJ, Oler AJ, Kim H-S, Chalmers N, Wallen GR, Cashion A, Munson PJ, Ames NJ. Development of an analysis pipeline characterizing multiple hypervariable regions of 16S rRNA using mock samples. PLoS One. 2016;11(2):e0148047. doi:10.1371/journal.pone.0148047.
- Edgar RC. UPARSE: highly accurate OTU sequences from microbial amplicon reads. Nat Methods. 2013;10(10):996. doi:10.1038/nmeth.2604.
- Edgar RC. SINTAX: a simple non-Bayesian taxonomy classifier for 16S and ITS sequences. bioRxiv. 2016. doi:10.1101/074161.