
ABSTRACT
Artificial sweetener consumption by pregnant women has been associated with an increased risk of infant obesity, but the underlying mechanisms are unknown. We aimed to determine if maternal consumption of artificially sweetened beverages (ASB) during pregnancy is associated with modifications of infant gut bacterial community composition and function during the first year of life, and whether these alterations are linked with infant body mass index (BMI) at one year of age. We studied 100 infants from the prospective Canadian CHILD Cohort Study, selected based on maternal ASB consumption during pregnancy (50 non-consumers and 50 daily consumers). BMI was higher among ASB-exposed infants. Infant stool (16S rRNA gene sequencing) and urine (untargeted metabolomics) were acquired in early (3–4 months) and late (12 months) infancy. We identified four microbiome clusters, of which two recapitulated the maturation trajectory of the infant gut bacterial communities from immature (Cluster 1) to mature (Cluster 4) and two deviated from this trajectory (Clusters 2 and 3). Maternal ASB consumption did not differ between clusters, but was associated with community-level shifts in infant gut bacterial taxonomy structure and depletion of several Bacteroides sp. in Cluster 2. In the complete dataset, urine succinate and spermidine levels at 3 months were higher in ASB-exposed infants, and urine succinate was positively associated with BMI at one-year-old. Overall, gestational exposure to ASB was associated with gut microbiota structure in infants from Cluster 2, and gut microbiota structure was associated with infant BMI. Gestational exposure to ASB was positively associated with infant urine succinate and spermidine. Succinate was found to mediate 29% of the effect of ASB exposure on BMI at one-year-old, revealing a potential role of this metabolite in increased infant weight linked to gestational ASB consumption. As we face an unprecedented rise in childhood obesity, future studies should evaluate the causal relationships between maternal ASB consumption (a modifiable exposure), gut microbiota and metabolites, infant metabolism, and body composition.
Introduction
Childhood obesity in the United States increased from 5% to 18.5% between 1978 and 2016,Citation1 magnifying the risk of cardiometabolic disease and mental health disorders later in life.Citation2 Recent work from the CHILD Cohort Study showed that maternal consumption of artificially sweetened beverages (ASB) during pregnancy is associated with higher infant body mass index (BMI) at one year of age.Citation3 Importantly, this association was independent of key obesity risk factors, such as maternal BMI, smoking, poor diet, diabetes, short breastfeeding duration, and earlier introduction of solid food.Citation3 Similar associations have been reported in several other prospective birth cohorts,Citation4 but the underlying mechanism has not been studied.
The gastrointestinal tract, a key site for host metabolic regulation,Citation5,Citation6 is colonized by a vast community of microbes including bacteria, viruses, and micro-eukaryotes.Citation7 The gut microbiome is highly heterogeneous during infancy, characterized by colonization patternsCitation8–10 that are influenced by the maternal microbiome,Citation11,Citation12 method of birth,Citation13–15 infant nutrition (breast milk or formula),Citation16–18 and antibiotic treatment.Citation14,Citation19 Simultaneously, important aspects of metabolic development occur during this period of life, many of which rely on interactions between microbes and host cells.Citation20 Recent studies in mice show that artificial sweetener consumption during pregnancy predisposes offspring to increased weight gain through behavioral (i.e. preference for sweet foods, appetite increase) and physiological mechanisms (i.e. stimulation of intestinal sugar absorption, increased postnatal weight gain, altered lipid profiles, downregulation of hepatic detoxification, and increased insulin resistance).Citation21–24
Common low-calorie sweeteners include synthetic artificial sweeteners (e.g. non-acesulfame-potassium, aspartame, advantame, neotame), sugar alcohols (e.g. erythritol, xylitol), and plant-based sweeteners (e.g. sucralose, thaumatin, monk fruit).Citation25 The effects of artificial sweeteners on the gut microbiome are diverse, including impacts on composition and function (see Suez et al.Citation26 for a synthesis). Suez et al.Citation27 also demonstrated that artificial sweetener consumption in adult mice directly impacts gut microbiome composition and function, leading to an increase in host glucose intolerance. More recently, Stichelen et al.Citation24 addressed gestational exposure to artificial sweeteners, finding changes in bacterial metabolites and a decrease in Akkermansia municiphila in the pups’ gut microbiome. However, the consequences of maternal artificial sweetener consumption during pregnancy on the infant gut microbiota have not been reported in humans.
To address this knowledge gap and build on our prior observations in the CHILD Cohort Study, we evaluated the association of maternal artificially sweetened beverage consumption during pregnancy with the infant gut microbiota in a subset of 100 infants (50 with daily maternal ASB consumption during pregnancy and 50 unexposed controls; see for maternal participants’ characteristics). We employed next-generation sequencing of the 16S rRNA amplicon gene combined with a community typing analysis (Dirichlet Multinomial Mixtures [DMM] modeling)Citation28 and urine untargeted metabolomics to understand if ASB intake was associated with a shift in infant microbiota composition and function that might explain the relationship between maternal ASB intake during pregnancy and infant BMI at one year of age.
Table 1. Participant characteristics for mothers exposed or unexposed to ASBs during pregnancy
Results
Microbiome clusters
We performed community typing analysis based on Dirichlet Multinomial Mixtures (DMM) modelingCitation28 to identify clusters of similar bacterial community structure amongst our samples. Based on their microbiota composition, the infant fecal samples clustered in four groups ( and eFigure 1). Gut bacterial species richness (), alpha- () and beta-diversity () and taxonomic composition () differed between clusters, reflecting broad community differences. Clusters 1 and 4 comprised microbial communities reflecting the well-described effect of temporal maturation during the first year of life; with cluster 1 comprising only three-month (3 M) samples and cluster 4 comprising almost exclusively twelve-month (12 M) samples. Clusters 2 and 3 comprised a mixture of 3 M and 12 M samples. Compared to the other three clusters, cluster 1 showed a higher proportion of exclusive breastfeeding. Cluster 3 included a higher proportion of mothers receiving intrapartum antibiotics, infants born by C-section, and formula feeding (). However, there was no difference in maternal ASB consumption between clusters, suggesting that this exposure did not influence the compositional differences that drove cluster classification (). In addition, the clusters did not differ in terms of maternal sugar intake, gestational diabetes, age, ethnicity, education, maternal gestational antibiotics, study site, infant antibiotics, or infant or mother secretor status.
Figure 1. Discrepancies in covariate distribution, alpha- and beta-diversity between microbiota clusters
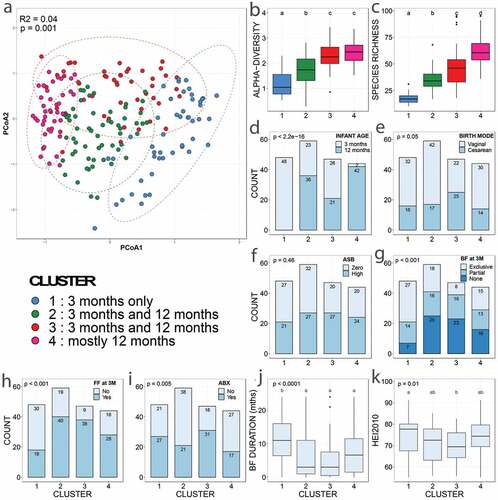
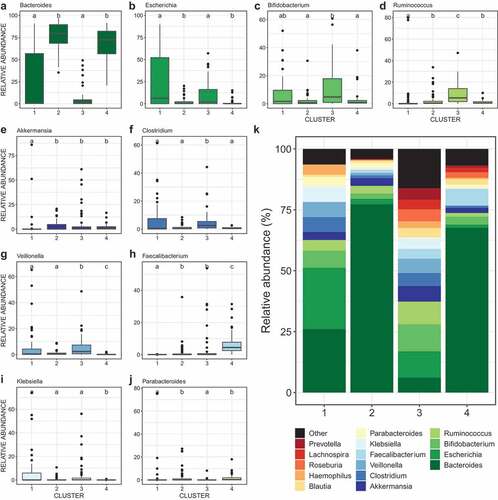
Figure 2. Differences in relative abundances of the dominant bacterial genera between clusters
Relative association of ASB on microbial community structure
Envfit analysis (univariable models) identified thirteen variables as significant drivers of gut bacterial beta-diversity from which we selected eight non-redundant variables to build our models: infant age, maternal intrapartum antibiotics, maternal ethnicity, birth mode, breastfeeding status at three months, presence of older siblings, infant secretor status, and maternal ASB consumption ( and eFigure 2). Considering the complete dataset, the significant predictors were infant age, maternal ethnicity, intrapartum antibiotics, and birth mode. The same four variables, plus breastfeeding status at 3 months, were tested in a PERMANOVA (multivariable model), altogether explaining 14.2% of community variance (). Maternal ASB consumption was a significant predictor of infant gut bacterial composition only in the multivariable model (R2 = 0.7%; ). Birth mode (vaginal vs. C-section), intrapartum antibiotics, and breastfeeding status at three months had also a significant influence on community composition (respectively R2 = 0.8%, 1.7%, and 1.9%), but to a lesser extent than infant age (R2 = 7.3%) and mother’s ethnicity (R2 = 2.5%; ).
Figure 3. Drivers of gut bacterial beta-diversity and indicator taxa associated with maternal consumption of ASB differ between clusters
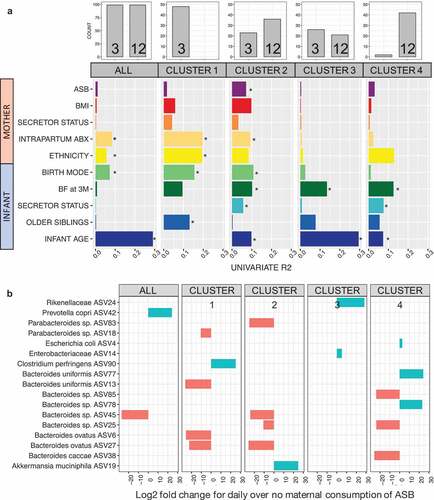
Table 2. Maternal consumption of ASB during pregnancy is associated with bacterial community assembly during the first year of life. Permutational Analysis of Variance (PERMANOVA) of gut bacterial community composition (Bray-Curtis dissimilarities) testing associations with different explanatory variables. The model on the complete dataset (ALL) accounts for repeated measures. The set of variables to be tested was chosen based on results from univariate envfit models
Next, we repeated the beta-diversity analyses separately within each of the four clusters. Envfit univariable models identified distinct drivers for each cluster (). Interestingly, the drivers of beta-diversity in cluster 1 (only 3 M samples) were mainly maternal factors (i.e. birth mode, mother’s ethnicity, intrapartum antibiotics) whereas the drivers of cluster 4 (mostly 12 M) were infant factors (infant’s secretor status, breastfeeding at three months, and infant age (). Cluster 2 was the only cluster in which maternal ASB consumption was associated with beta-diversity (R2 = 3.2%), and this association was confirmed by the univariable (, eFigure 2) and multivariable () analyses.
We tested for associations of specific bacterial features in the infant gut with maternal ASB consumption. In the complete dataset, we identified two ASVs associated with maternal consumption of ASB, one species being depleted (Bacteroides sp. ASV45, log2 fold change = −27.2 and another species enriched (Prevotella copri ASV42, 24.2) among infants exposed to high maternal ASB intake (). Repeating this test within each cluster, we identified 15 additional ASVs enriched or depleted. For cluster 2, one ASV was enriched (ASV19, Akkermansia municiphila, 24.9) and four depleted (Bacteroides ovatus ASV27, −25.9; Parabacteroides sp. ASV83, −25.2; Bacteroides sp. ASV45, −24.9; Bacteroides sp. ASV25, −10.7) with maternal ASB consumption (). All adjusted p-values were below 0.001 and corrected with Benjamini-Hochberg for FDR.
Association between ASB exposure and urine metabolites
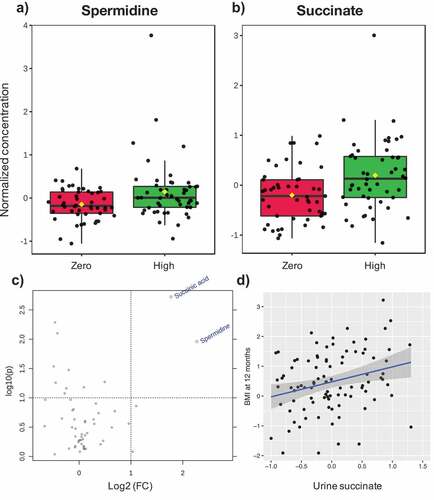
Using the software MetaboAnalyst,Citation29 we identified twenty metabolites that varied across clusters (eFigure 3). Since functional features in the metabolome are reflective of microbial metabolism redundancy, and less susceptible to interindividual variability typical of taxonomic datasets, we tested for a significant effect of maternal ASB consumption on the complete dataset at 3M and 12M old. Two urine metabolites, spermidine (log2 fold change = 2.27, p = .01) and succinate (log2 fold change = 1.77, p = .001), were significantly higher in 3M old infants exposed to ASB ().
Figure 4. Association between maternal ASB consumption, urine metabolite concentration in 3 M-old infants, and infant BMI at 12 months
Association of ASB, gut microbiome and urine metabolites with infant BMI at one-year-old
Finally, using a multivariable linear model on the complete dataset, we tested the association of maternal ASB consumption, microbial community composition and the two metabolites linked to high ASB consumption with infant BMI z-score at one year of age. In this cohort, infant birth weight was not correlated with BMI at one-year-old (p = .28). However, our multivariable linear model confirmed that daily maternal ASB consumption is associated with higher infant BMI (ß-estimate = 0.42, 95%CI 0.03:0.80, P = .037; ), and showed that BMI was associated with the microbiome composition at 12 months (PCoA1 axis; ß-estimate = −0.71, 95%CI −1.40:-0.01, P = .048; ) but not at three months (not shown). These results suggest that features of PCoA1 (i.e. lower relative abundance of Bacteroidetes and Faecalibacterium, and higher relative abundance of Escherichia, Klebsiella, Bifidobacterium, Haemophilus, Clostridium, and Veillonella; eFigure 4) are inversely associated with infant BMI. Notably, succinate was positively associated with BMI (ß-estimate = 0.45, 95%CI 0.15:0.76, P = .004; , ) but not spermidine (P = .49), revealing that this association may also involve microbial-derived metabolites. We then performed a mediation analysis which showed that urine succinate mediated 29% of the observed association between ASB and BMI at one-year-old (mediation effect of ß-estimate = 0.29, 95%CI 0.03:2.19, P = .04).
Table 3. Maternal consumption of ASB during pregnancy and urine succinate are associated with higher infant BMI at one-year-old. Linear models showing the explanatory power of maternal ASB consumption and urine succinate at 3 M old on infant BMI z-score at one year old, as well as the two main axes of ordination of bacterial community structure (beta-diversity) on samples acquired at 3 M and 12 M old. The full models are: [1]BMI at 1y ~ Succinate; [2]BMI at 1y ~ ASB + PCoA1 + PCoA2. Microbial variables were transformed (squared root and order quantile normalized respectively) to achieve normality. Here we present only the best model for 12 months fitted by stepwise selection by Akaike information criterion because we detected no association between BMI at one year old and microbiota composition at 3 M old
Discussion
In defining links between maternal ASB consumption and infant BMI, our results suggest that maternal consumption of ASB during pregnancy (1) may influence the establishment of the infant gut microbiome in infants diverging from what has previously been described as the typical microbiome maturation trajectory (, ); and (2) is associated with an increase in infant BMI at one-year-old that may be mediated by succinate (). The estimated impact of maternal ASB consumption on the infant microbiome is notably smaller than other known drivers (which uniformly affected infants across all clusters) such as breastfeeding, birth mode, ethnicity, infant age, and intrapartum antibiotics (, eFigure 2). However, ASB consumption was also linked to differences in urine metabolites known to be produced by microbial metabolism of putrescine in the gut, supporting the role of ASBs in taxonomic and functional changes of the early life microbiome. To our knowledge, this is the first human study to report the association of maternal consumption of ASB, infant gut microbiome, and urine metabolites, and their potential influence on infant BMI. In light of recent data showing that ASB can drive dysregulation of energy metabolism in mice through changes in the gut microbiome,Citation24,Citation27,Citation30,Citation31 our study suggests that infants exposed to ASB through their mothers may be at higher risk of shifts in microbial community structure related to early-life predisposition to metabolic diseases.Citation32,Citation33
The first year of life has been suggested to be a “window of opportunity” for the training of the immune system through interactions between host cells, gut microorganisms, and microbial metabolites (see Arrieta et al.Citation34 for a review). During this period, method of birth,Citation9,Citation35 infant nutrition,Citation16–18 and antibiotic treatmentCitation14 are major drivers of infant gut microbiome establishment and trajectory, respectively, determining the initial set of pioneer speciesCitation36 and stochastic perturbations potentially leading to dysbiosis (i.e. a state of community imbalance triggered by loss of taxa, diversity, and/or metabolic capacity).Citation37 Our results confirm the significance of these factors in driving infant gut microbial community structure during the first year of life (). Most interestingly, although we included multiple variables describing antibiotic treatment either received by the mother of the infant, intrapartum antibiotics was identified as a strong determinant of microbial community structure. This effect was detected in clusters 1 and 2 only, suggesting its effect might resolve with time. In addition, intrapartum antibiotics could contribute to the altered microbial trajectory of cluster 2 and perhaps increase susceptibility to the effect of maternal ASB, which was only observed in this cluster.
In our study, broad shifts in bacterial community structure were significantly associated with infant BMI at one-year-old. We also identified nine bacterial taxa from Bacteroides sp. that were enriched (three ASVs) or depleted (six ASVs) at high levels of maternal ASB consumption, suggesting a mechanism of influence on infant weight gain involving specific taxa of the gut microbiome. The taxa Akkermansia municiphila and genus Bacteroides have previously been identified by various studies to be respectively decreased and enriched as a consequence of ASB consumption.Citation27,Citation30,Citation31,Citation38 Our results differ from previous findings for A. municiphila and suggest that Bacteroides patterns of enrichment or depletion might be species- or strain-specific, warranting further research with deeper resolution.
In contrast to the microbiome sequencing findings, functional links between ASB consumption and the gut microbiome were evident using the complete dataset. Untargeted metabolomic analysis yielded two related metabolites, spermidine and succinate, associated with ASB consumption in the urine of 3 M-old infants (). Of these, succinate was significantly and positively associated with infant BMI at one-year-old (, ). Both metabolites are derivatives of putrescine, a relevant polyamine exerting a wide array of biological functions (e.g. gene regulation, stress resistance, cell proliferation and differentiation).Citation39,Citation40 Spermidine is known to be produced by gut-colonizing bacteria and can have an impact on host metabolism (e.g. increasing glucose homeostasis and insulin sensitivity, reducing adiposity and hepatic fat accumulation) in obesity mouse models.Citation41,Citation42 Succinate is produced by bacterial fermentation of dietary fibers in the gut.Citation43 High levels of succinate within the gut lumen have been related to dysbiosis, inflammatory bowel disease (IBD) and intestinal inflammation in animal models by activating immune cells via succinate receptor 1(SUCNR1).Citation43 Of these two metabolites, succinate was also found to mediate 29% of the effect of ASB exposure on BMI at 1-year. Of interest, high level of circulating succinate has been previously linked to obesity in humans.Citation44 This exciting finding suggests that a common gut microbial metabolite previously associated with human obesity may play a role in infant weight gain linked to ASB consumption. These novel findings support a functional role of the gut microbiome in mediating the impact of ASB exposure on infant weight.
As reported by Bian et al.Citation30,Citation31 in two studies with adult mice, and by Nettleton et al.Citation45 in a study on dams and their offspring, ASB has been shown to alter gut bacterial community composition (increase of Bacteroides and reductions of Lactobacillus and Clostridium) and increase body weight in parallel with an enrichment of energy metabolism bacterial genes. The functional cluster analyses by Bian et al.Citation30,Citation31 revealed activation of genes related to carbohydrate absorption and increases in metabolic pathways related to glycolysis and sugar and xylose transport.Citation30 Sucralose treatment resulted in an increase in bacterial pro-inflammatory mediator genes in mice.Citation31 Likewise, Chi et al.Citation38 found that consumption of the artificial sweetener neotame altered the alpha- and beta-diversity of mice gut microbiome, and led to a decrease in butyrate synthetic genes and changes to the fecal short chain fatty acids cluster.
Overall, accumulating evidence suggests that the alterations of host gut bacterial community structure through the consumption of ASB are reflected in bacterial and host metabolic gene clusters, which might explain the increase in weight gain. Based on this evidence and our current results, we hypothesize that gestational exposure to ASB impacts infant gut bacterial communities either indirectly through disruption of vertical transmission of the maternal microbiome, or directly through lactation during breastfeeding. Additional work will determine if the bacterial compositional and metabolic changes associated with high maternal ASB consumption in our study are causally implicated in energy metabolism dysregulation and infant body composition.
Overall, our study agrees with previous findingsCitation3 that maternal consumption of artificial sweeteners is associated with a higher BMI at one-year-old, and suggests that the infant gut microbiome could play a role in this effect, especially for susceptible infants displaying a disrupted maturation trajectory of their gut microbiome and a high relative abundance of Bacteroides. Our study confirms recent descriptions of infant microbiome development and confirms the influence of several known determinants of the gut microbiome during the first year of lifeCitation11–14,Citation16,Citation17,Citation19 including maternal antibiotics, breastfeeding, birth mode and ethnicity.
The major strength of our study is the combination of state-of-the-art community typing analysis of the gut bacterial communities combined with the standardized prospective evaluation of maternal ASB consumption. Limitations of our study lie in risk of measurement error in self-reported dietary exposures and our inability to distinguish between different types of ASB or account for artificial sweeteners in foods. Also, we did not assess maternal diet after delivery, so we could not directly investigate the impact of prenatal ASB exposure in utero versus postnatal exposure through lactation.Citation46,Citation47 In addition, we used 16S amplicon sequencing to characterize the gut bacterial communities. This method is limited in resolution as many recent studies have revealed that host-microbe and microbe-microbe interactions occur at species and subspecies-level variants.Citation48,Citation49 Finally, aside from the gut microbiome, various other physiological mechanisms are altered in rodent offspring after exposure to artificial sweeteners in uteroCitation21–24 (i.e. intestinal sugar absorption stimulation, increased postnatal weight gain, altered lipid profiles, downregulation of hepatic detoxification, and increased adulthood insulin resistance). Future work should explore if the infant gut microbiome may contribute to the physiologic effects of artificial sweeteners.
In this study, we characterized the infant gut microbiome composition and function of 100 infants and found evidence that maternal ASB consumption during pregnancy might have unforeseen effects on infant gut microbiome development and body mass index during the first year of life. As we face an unprecedented rise in childhood obesity and related metabolic diseases, further research is warranted to understand the impact of artificial sweeteners on gut microbiome and weight gain, especially during critical periods of early development.
Material and methods
Study design and population
We used data and samples collected through the CHILD Cohort Study,Citation50,Citation51 a Canadian general population birth cohort (3621 families recruited across four provinces) including singleton pregnancies (>35 weeks gestational age with no congenital abnormalities) enrolled from 2008 to 2012. From this cohort, we completed a case-control study by selecting 100 infants divided equally between mothers that reported little or no ASB consumption (less than one per month) or high ASB consumption (one or more per day) during pregnancy. The groups were balanced for six potential confounding factors known to influence the gut microbiome: infant sex, birth mode, breastfeeding at three and 12 months, maternal BMI, and antibiotic use in infants before 12 months (antibiotics before three months old was an exclusion criterion; ). To characterize the gut microbiome, stool samples were acquired at three and 12 months of age for a total of 200 samples. This study was approved by the University of Calgary Conjoint Health Research Ethics Board (CHREB) and ethics committees at the Hospital for Sick Children, and the Universities of Manitoba, Alberta, and British Columbia. Written informed consent was obtained from mothers during enrollment to the CHILD Study.
Maternal diet in pregnancy
Maternal dietary assessment in pregnancy has previously been described.Citation3 Briefly, a food frequency questionnaire (FFQ) was completed during the second or third trimester and ASB consumption was evaluated using reports of “diet soft drinks or pop” (i.e. soda) (serving = 12 oz/one can) and “artificial sweetener added to tea or coffee” (serving = 1 packet). Other dietary variables included: sugar-sweetened beverages, Healthy Eating Index (HEI) total score (see eMethods) added sugar and total energy intake.
Infant BMI
BMI was measured by CHILD staff to the nearest 0.1 kg around one year of age (mean = 12.0 months ± 0.8 [sd]) and height to the nearest 0.1 cm. Age- and sex-specific BMI-for-age z-scores were calculated following the World Health Organization reference.Citation52
Other variables
The following variables were considered in univariable analyses (see eMethods): (1) infant’s sex, age at sample collection, breastfeeding duration (BF duration; months), breastfeeding status at three months (BF at 3 M; yes or no), diet at three and six months (Diet at 3 M and Diet at 6 M; both defined in 8 categories allocated based on the presence in the infant’s diet of breastfeeding, formula, and solids), solids at three and six months (Solids at 3 M and Solids at 6 M), formula feeding at three months (FF at 3 M), number of antibiotic treatments received from six to twelve months (Child 6–12 abx), and secretor status (determined from the single nucleotide polymorphism rs601338 in the FUT2 gene); (2) mother’s gestational diabetes, age, ethnicity, education, oral antibiotics received during gestation (Mother gestational abx), intrapartum antibiotics (Mother intrapartum abx), and secretor status (rs601338 SNP); (3) study site, presence of cats, dogs, and older siblings in the house.
Fecal samples DNA extraction and sequencing
After collection, fecal samples were frozen and stored at −80ºC. We extracted gut microbial DNA from fecal samples using the DNeasy PowerSoil kit (QIAGEN) according to the manufacturer’s instructions and amplified the V4 region of the 16S rRNA gene to generate ready-to-pool dual-indexed amplicon libraries as described previouslyCitation53 (see eMethods). Using the DADA2Citation54 pipeline, the final dataset contained 4,553,000 quality sequences, a mean (range) of 6,509 (22,995–68,265) sequences per sample identified as 954 unique bacterial Amplicon Sequence Variants (ASVs). Samples contained a mean of 40 (10–95) unique ASVs per samples.
Urine untargeted metabolomics
We have applied an untargeted quantitative metabolomics approach to analyze the samples using a combination of direct injection mass spectrometry with a reverse-phase LC-MS/MS custom assay. This custom assay, in combination with an ABSciex 4000 QTrap (Applied Biosystems/MDS Sciex) mass spectrometer, can be used for the identification and quantification of up to 150 different endogenous metabolites including amino acids, acylcarnitines, biogenic amines & derivatives, uremic toxins, glycerophospholipids, sphingolipids and sugars.Citation55,Citation56 The method combines the derivatization and extraction of analytes, and the selective mass-spectrometric detection using multiple reaction monitoring (MRM) pairs. Isotope-labeled internal standards and other internal standards are used for metabolite quantification. The custom assay contains a 96 deep-well plate with a filter plate attached with sealing tape, and reagents and solvents used to prepare the plate assay. First 14 wells were used for one blank, three zero samples, seven standards and three quality control samples. For all metabolites, samples were thawed on ice and were vortexed and centrifuged at 13,000x g. 10 µL of each sample was loaded onto the center of the filter on the upper 96-well plate and dried in a stream of nitrogen. Subsequently, phenyl-isothiocyanate was added for derivatization. After incubation, the filter spots were dried again using an evaporator. Extraction of the metabolites was then achieved by adding 300 µL of extraction solvent. The extracts were obtained by centrifugation into the lower 96-deep well plate, followed by a dilution step with MS running solvent. Mass spectrometric analysis was performed on an ABSciex 4000 Qtrap® tandem mass spectrometry instrument (Applied Biosystems/MDS Analytical Technologies, Foster City, CA) equipped with an Agilent 1260 series UHPLC system (Agilent Technologies, Palo Alto, CA). The samples were delivered to the mass spectrometer by an LC method followed by a direct injection (DI) method.
Statistical analysis
We used Dirichlet Multinomial Mixtures (DMM) modelingCitation28 on 16S rRNA gene sequencing data to identify clusters of similar bacterial community structure amongst our samples (a technique known as community typing analysis, increasingly used in human microbiome studiesCitation10,Citation57–59). This technique is increasingly employed in microbiome studies for three reasons: (1) identification of unique microbial clusters is unsupervised; (2) cluster size depends on metacommunity variability; and (3) adequate explicit probabilistic model penalizes model complexity to optimize cluster number. The lowest Laplace approximation grouped our samples in four unique clusters ( and eFigure 1).
The distribution of variables as well as the variation in bacterial richness (Chao 1), alpha-diversity (Shannon index), and community evenness (Shannon index/logn(species richness)) across the DMM clusters were examined by non-parametric Kruskal-Wallis tests followed by post-hoc Dunn tests or generalized linear models (glm) with a binomial/logistic distribution. To explore the changes in taxonomical community structure at a fine scale, we tested for significant differences in the relative abundance of the 10 most dominant bacterial genera across clusters using non-parametric Kruskal-Wallis tests followed by post-hoc Dunn tests with Benjamin-Holmes False Discovery Rate (FDR) correction. To account for potential heteroskedasticity in bacterial community dispersion between groups and avoid the loss of information through rarefaction,Citation60 we performed a variance stabilizing transformationCitation60,Citation61 prior to any statistical tests on beta-diversity. To select variables that could be drivers of infant gut bacterial community structure, we tested for correlations between our variables and community scores on the Principal Component Analysis (PCoA) ordination axes in univariable models (envfit function of veganCitation62). The relative influence of the significant drivers of gut bacterial community structure was then assessed statistically in multivariate models using a Permutational Multivariate Analysis Of Variance (PERMANOVA based on Bray-Curtis dissimilarities; adonis function of veganCitation62) with 999 permutations and visualized using PCoAs. We used DESeq2 (with Benjamini-Hochberg False Discovery Rate (FDR) correction) to test for differentially abundant bacterial taxa according to maternal ASB consumption on the 100 most relatively abundant bacterial taxa to limit spurious significance driven by very rare ASVs. Finally, we used linear models on the 3 M and 12 M-old samples to test for the influence of maternal ASB consumption, urine metabolites, and microbial ordination axes (PCoA1 and PCoA2) on infant BMI z-score. We performed the mediation analysis using “Succinate” as mediator and “ASB” as mediated with the mediation package. All analyses and graphs were computed in R version 3.6.1 (R Development Core Team; http://www.R-project.org) and MetaboAnalystCitation29 for the metabolomics.
Author contributions
ABB, PJM, SET, TJM, MRS, and PS, coordinated the CHILD cohort and collected the data; MCA, MBA, and LKS designed the study and obtained funding; ILL and MCA analyzed the data; ILL, MCA, MBA, and LKS interpreted the results, wrote and edited the manuscript. All authors critically reviewed the manuscript and approved the final version for submission.
Role of the Funder/Sponsor
The funders had no role in the design and conduct of the study; collection, management, analysis, and interpretation of the data; preparation, review, or approval of the manuscript; and decision to submit the manuscript for publication.
Supplemental Material
Download PDF (864.3 KB)Acknowledgments
We are grateful to all the families who took part in this study and the whole Canadian Healthy Infant Longitudinal Development Study team, which includes interviewers, nurses, computer and laboratory technicians, clerical workers, research scientists, volunteers, managers, and receptionists. We also thank Alyssa Archibald, MD (University of Manitoba, Winnipeg, Manitoba, Canada), for her assistance with the literature review for this project, and Faisal Atakora, MSc (University of Manitoba), for statistical expertise.
Disclosure statement
The authors state that they have no conflict of interest.
Data and Code Availability
Raw sequences have been deposited on NCBI public repository (Bioproject #PRJNA624780). The R code, metadata, community matrix and taxa matrix are available on github https://github.com/isabelle-laforest/CHILD_GutMicrobes.
Supplementary material
Supplemental data for this article can be accessed on the publisher’s website.
Additional information
Funding
References
- Hales CM, Carroll MD, Fryar CD, Ogden CL. Prevalence of obesity among adults and youth: United States, 2015-2016. NCHS Data Brief. 2017;1–15.
- Daniels SR, Arnett DK, Eckel RH, Gidding SS, Hayman LL, Kumanyika S, Robinson TN, Scott BJ, St. Jeor S, Williams CL, et al. Overweight in children and adolescents: pathophysiology, consequences, prevention, and treatment. Circulation. 2005;111:1999–2012. doi:10.1161/01.CIR.0000161369.71722.10.
- Azad MB, Sharma AK, de Souza RJ, Dolinsky VW, Becker AB, Mandhane PJ, Turvey SE, Subbarao P, Lefebvre DL, Sears MR, et al. Association Between Artificially Sweetened Beverage Consumption During Pregnancy and Infant Body Mass Index. JAMA Pediatr. 2016;170:662–670. doi:10.1001/jamapediatrics.2016.0301.
- Archibald AJ, Dolinsky VW, Azad MB. Early-life exposure to non-nutritive sweeteners and the developmental origins of childhood obesity: global evidence from human and rodent studies. Nutrients. 2018;10(2). doi:10.3390/nu10020194
- Cox LM, Blaser MJ. Pathways in microbe-induced obesity. Cell Metab. 2013;17:883–894.
- Vatanen T, Franzosa EA, Schwager R, Tripathi S, Arthur TD, Vehik K, Lernmark Å, Hagopian WA, Rewers MJ, She J-X, et al. The human gut microbiome in early-onset type 1 diabetes from the TEDDY study. Nature. 2018;562:589–594. doi:10.1038/s41586-018-0620-2.
- Human Microbiome Project C. Structure, function and diversity of the healthy human microbiome. Nature. 2012;486:207–214. doi:10.1038/nature11234.
- Yatsunenko T, Rey FE, Manary MJ, Trehan I, Dominguez-Bello MG, Contreras M, Magris M, Hidalgo G, Baldassano RN, Anokhin AP, et al. Human gut microbiome viewed across age and geography. Nature. 2012;486:222–227. doi:10.1038/nature11053.
- Backhed F, Roswall J, Peng Y, Feng Q, Jia H, Kovatcheva-Datchary P, Li Y, Xia Y, Xie H, Zhong H, et al. Dynamics and stabilization of the human gut microbiome during the first year of life. Cell Host Microbe. 2015;17:852. doi:10.1016/j.chom.2015.05.012.
- Stewart CJ, Ajami NJ, O’Brien JL, Hutchinson DS, Smith DP, Wong MC, Ross MC, Lloyd RE, Doddapaneni H, Metcalf GA, et al. Temporal development of the gut microbiome in early childhood from the TEDDY study. Nature. 2018;562:583–588. doi:10.1038/s41586-018-0617-x.
- Gomez de Aguero M, Ganal-Vonarburg SC, Fuhrer T, Rupp S, Uchimura Y, Li H, Steinert A, Heikenwalder M, Hapfelmeier S, Sauer U, et al. The maternal microbiota drives early postnatal innate immune development. Science. 2016;351:1296–1302. doi:10.1126/science.aad2571.
- Cabrera-Rubio R, Collado MC, Laitinen K, Salminen S, Isolauri E, Mira A. The human milk microbiome changes over lactation and is shaped by maternal weight and mode of delivery. Am J Clin Nutr. 2012;96:544–551. doi:10.3945/ajcn.112.037382.
- Dominguez-Bello MG, Costello EK, Contreras M, Magris M, Hidalgo G, Fierer N, Knight R. Delivery mode shapes the acquisition and structure of the initial microbiota across multiple body habitats in newborns. Proc Natl Acad Sci U S A. 2010;107:11971–11975.
- Yassour M, Vatanen T, Siljander H, Hämäläinen A-M, Härkönen T, Ryhänen SJ, Franzosa EA, Vlamakis H, Huttenhower C, Gevers D, et al. Natural history of the infant gut microbiome and impact of antibiotic treatment on bacterial strain diversity and stability. Sci Transl Med. 2016;8:343ra81. doi:10.1126/scitranslmed.aad0917.
- Madan JC, Hoen AG, Lundgren SN, Farzan SF, Cottingham KL, Morrison HG, Sogin ML, Li H, Moore JH, Karagas MR, et al. Association of cesarean delivery and formula supplementation with the intestinal microbiome of 6-week-old infants. JAMA Pediatr. 2016;170:212–219. doi:10.1001/jamapediatrics.2015.3732.
- Palmer C, Bik EM, DiGiulio DB, Relman DA, Brown PO. Development of the human infant intestinal microbiota. PLoS Biol. 2007;5:e177. doi:10.1371/journal.pbio.0050177.
- Round JL, Lee SM, Li J, Tran G, Jabri B, Chatila TA, Mazmanian SK. The Toll-like receptor 2 pathway establishes colonization by a commensal of the human microbiota. Science. 2011;332:974–977. doi:10.1126/science.1206095.
- Pannaraj PS, Li F, Cerini C, Bender JM, Yang S, Rollie A, Adisetiyo H, Zabih S, Lincez PJ, Bittinger K, et al. Association between breast milk bacterial communities and establishment and development of the infant gut microbiome. JAMA Pediatr. 2017;171:647–654. doi:10.1001/jamapediatrics.2017.0378.
- Zeissig S, Blumberg RS. Life at the beginning: perturbation of the microbiota by antibiotics in early life and its role in health and disease. Nat Immunol. 2014;15:307–310. doi:10.1038/ni.2847.
- Round JL, Mazmanian SK. The gut microbiota shapes intestinal immune responses during health and disease. Nat Rev Immunol. 2009;9:313–323. doi:10.1038/nri2515.
- von Poser Toigo E, Huffell AP, Mota CS, Bertolini D, Pettenuzzo LF, Dalmaz C. Metabolic and feeding behavior alterations provoked by prenatal exposure to aspartame. Appetite. 2015;87:168–174. doi:10.1016/j.appet.2014.12.213.
- Collison KS, Makhoul NJ, Zaidi MZ, Saleh SM, Andres B, Inglis A, Al-Rabiah R, Al-Mohanna FA. Gender dimorphism in aspartame-induced impairment of spatial cognition and insulin sensitivity. PLoS One. 2012;7:e31570. doi:10.1371/journal.pone.0031570.
- Zhang G-H, Chen M-L, Liu -S-S, Zhan Y-H, Quan Y, Qin Y-M, Deng S-P. Effects of mother’s dietary exposure to acesulfame-K in pregnancy or lactation on the adult offspring’s sweet preference. Chem Senses. 2011;36:763–770. doi:10.1093/chemse/bjr050.
- Stichelen O-V, Rother KI, Hanover JA. Maternal exposure to non-nutritive sweeteners impacts progeny’s metabolism and microbiome. Front Microbiol. 2019;10:1360. doi:10.3389/fmicb.2019.01360.
- Palatnik A, Moosreiner A, Olivier-Van Stichelen S. Consumption of non-nutritive sweeteners during pregnancy. Am J Obstet Gynecol. 2020;223:211–218. doi:10.1016/j.ajog.2020.03.034.
- Suez J, Korem T, Zilberman-Schapira G, Segal E, Elinav E. Non-caloric artificial sweeteners and the microbiome: findings and challenges. Gut Microbes. 2015;6:149–155. doi:10.1080/19490976.2015.1017700.
- Suez J, Korem T, Zeevi D, Zilberman-Schapira G, Thaiss CA, Maza O, Israeli D, Zmora N, Gilad S, Weinberger A, et al. Artificial sweeteners induce glucose intolerance by altering the gut microbiota. Nature. 2014;514:181–186. doi:10.1038/nature13793.
- Holmes I, Harris K, Quince C, Gilbert JA. Dirichlet multinomial mixtures: generative models for microbial metagenomics. PLoS One. 2012;7:e30126. doi:10.1371/journal.pone.0030126.
- Chong J, Xia J. Using metaboanalyst 4.0 for metabolomics data analysis, interpretation, and integration with other omics data. Methods Mol Biol. 2020;2104:337–360.
- Bian X, Chi L, Gao B, Tu P, Ru H, Lu K. The artificial sweetener acesulfame potassium affects the gut microbiome and body weight gain in CD-1 mice. PLoS One. 2017;12:e0178426. doi:10.1371/journal.pone.0178426.
- Bian X, Chi L, Gao B, Tu P, Ru H, Lu K. Gut microbiome response to sucralose and its potential role in inducing liver inflammation in mice. Front Physiol. 2017;8:487. doi:10.3389/fphys.2017.00487.
- Pereira TJ, Moyce BL, Kereliuk SM, Dolinsky VW. Influence of maternal overnutrition and gestational diabetes on the programming of metabolic health outcomes in the offspring: experimental evidence. Biochem Cell Biol. 2015;93:438–451. doi:10.1139/bcb-2014-0141.
- Symonds ME, Sebert SP, Hyatt MA, Budge H. Nutritional programming of the metabolic syndrome. Nat Rev Endocrinol. 2009;5:604–610. doi:10.1038/nrendo.2009.195.
- Arrieta MC, Stiemsma LT, Amenyogbe N, Brown EM, Finlay B. The intestinal microbiome in early life: health and disease. Front Immunol. 2014;5:427.
- Dominguez-Bello MG, Costello EK, Contreras M, Magris M, Hidalgo G, Fierer N, Knight R. Delivery mode shapes the acquisition and structure of the initial microbiota across multiple body habitats in newborns. Proc Nat Acad Sci. 2010;107:11971–11975.
- Sprockett D, Fukami T, Relman DA. Role of priority effects in the early-life assembly of the gut microbiota. Nat Rev Gastroenterol Hepatol. 2018;15:197–205. doi:10.1038/nrgastro.2017.173.
- Carding S, Verbeke K, Vipond DT, Corfe BM, Owen LJ. Dysbiosis of the gut microbiota in disease. Microb Ecol Health Dis. 2015;26:26191.
- Chi L, Bian X, Gao B, Tu P, Lai Y, Ru H, Lu K. Effects of the artificial sweetener neotame on the gut microbiome and fecal metabolites in mice. Molecules. 2018;23(2):367. doi:10.3390/molecules23020367.
- Tofalo R, Cocchi S, Suzzi G. Polyamines and gut microbiota. Front Nutr. 2019;6:16. doi:10.3389/fnut.2019.00016.
- Igarashi K, Kashiwagi K. Modulation of cellular function by polyamines. Int J Biochem Cell Biol. 2010;42:39–51. doi:10.1016/j.biocel.2009.07.009.
- Noack J, Dongowski G, Hartmann L, Blaut M. The human gut bacteria Bacteroides thetaiotaomicron and Fusobacterium varium produce putrescine and spermidine in cecum of pectin-fed gnotobiotic rats. J Nutr. 2000;130:1225–1231. doi:10.1093/jn/130.5.1225.
- Ramos-Molina B, Queipo-Ortuno MI, Lambertos A, Tinahones FJ, Peñafiel R. Dietary and gut microbiota polyamines in obesity- and age-related diseases. Front Nutr. 2019;6:24.
- Connors J, Dawe N, Van Limbergen J. The role of succinate in the regulation of intestinal inflammation. Nutrients. 2018;11(1):25. doi:10.3390/nu11010025
- Serena C, Ceperuelo-Mallafre V, Keiran N, Queipo-Ortuño MI, Bernal R, Gomez-Huelgas R, Urpi-Sarda M, Sabater M, Pérez-Brocal V, Andrés-Lacueva C, et al. Elevated circulating levels of succinate in human obesity are linked to specific gut microbiota. Isme J. 2018;12:1642–1657.
- Nettleton JE, Cho NA, Klancic T, Nicolucci AC, Shearer J, Borgland SL, Johnston LA, Ramay HR, Noye Tuplin E, Chleilat F, et al. Maternal low-dose aspartame and stevia consumption with an obesogenic diet alters metabolism, gut microbiota and mesolimbic reward system in rat dams and their offspring. Gut. 2020;69:1807–1817. doi:10.1136/gutjnl-2018-317505.
- Rother KI, Sylvetsky AC, Walter PJ, Garraffo HM, Fields DA. Pharmacokinetics of sucralose and acesulfame-potassium in breast milk following ingestion of diet soda. J Pediatr Gastroenterol Nutr. 2018;66:466–470. doi:10.1097/MPG.0000000000001817.
- Sylvetsky AC, Gardner AL, Bauman V, Blau JE, Garraffo HM, Walter PJ, Rother KI. Nonnutritive sweeteners in breast milk. J Toxicol Environ Health A. 2015;78:1029–1032. doi:10.1080/15287394.2015.1053646.
- Lloyd-Price J, Mahurkar A, Rahnavard G, Crabtree J, Orvis J, Hall AB, Brady A, Creasy HH, McCracken C, Giglio MG, et al. Strains, functions and dynamics in the expanded human microbiome project. Nature. 2017;550:61–66. doi:10.1038/nature23889.
- Costea PI, Coelho LP, Sunagawa S, Munch R, Huerta‐Cepas J, Forslund K, Hildebrand F, Kushugulova A, Zeller G, Bork P, et al. Subspecies in the global human gut microbiome. Mol Syst Biol. 2017;13:960. doi:10.15252/msb.20177589.
- Subbarao P, Anand SS, Becker AB, Befus AD, Brauer M, Brook JR, Denburg JA, HayGlass KT, Kobor MS, Kollmann TR, et al. The Canadian healthy infant longitudinal development (CHILD) study: examining developmental origins of allergy and asthma. Thorax. 2015;70:998–1000. doi:10.1136/thoraxjnl-2015-207246.
- Takaro TK, Scott JA, Allen RW, Anand SS, Becker AB, Befus AD, Brauer M, Duncan J, Lefebvre DL, Lou W, et al. The Canadian healthy infant longitudinal development (CHILD) birth cohort study: assessment of environmental exposures. J Expo Sci Environ Epidemiol. 2015;25:580–592. doi:10.1038/jes.2015.7.
- Group WHOMGRS. WHO child growth standards based on length/height, weight and age. Acta Paediatr Suppl 2006;450:76–85.
- Kozich JJ, Westcott SL, Baxter NT, Highlander SK, Schloss PD. Development of a dual-index sequencing strategy and curation pipeline for analyzing amplicon sequence data on the MiSeq Illumina sequencing platform. Appl Environ Microbiol. 2013;79:5112–5120. doi:10.1128/AEM.01043-13.
- Callahan BJ, McMurdie PJ, Rosen MJ, Han AW, Johnson AJA, Holmes SP. DADA2: high-resolution sample inference from Illumina amplicon data. Nat Methods. 2016;13:581–583. doi:10.1038/nmeth.3869.
- Foroutan A, Guo AC, Vazquez-Fresno R, Lipfert M, Zhang L, Zheng J, Badran H, Budinski Z, Mandal R, Ametaj BN, et al. Chemical composition of commercial cow’s milk. J Agric Food Chem. 2019;67:4897–4914. doi:10.1021/acs.jafc.9b00204.
- Foroutan A, Fitzsimmons C, Mandal R, Piri-Moghadam H, Zheng J, Guo A, Li C, Guan LL, Wishart DS. The bovine metabolome. Metabolites. 2020;10(6):233. doi:10.3390/metabo10060233.
- Fujimura KE, Sitarik AR, Havstad S, Lin DL, Levan S, Fadrosh D, Panzer AR, LaMere B, Rackaityte E, Lukacs NW, et al. Neonatal gut microbiota associates with childhood multisensitized atopy and T cell differentiation. Nat Med. 2016;22:1187–1191. doi:10.1038/nm.4176.
- Ding T, Schloss PD. Dynamics and associations of microbial community types across the human body. Nature. 2014;509:357–360. doi:10.1038/nature13178.
- McFall-Ngai M, Hadfield MG, Bosch TC, Carey HV, Domazet-Lošo T, Douglas AE, Dubilier N, Eberl G, Fukami T, Gilbert SF, et al. Animals in a bacterial world, a new imperative for the life sciences. Proc Natl Acad Sci U S A. 2013;110:3229–3236. doi:10.1073/pnas.1218525110.
- McMurdie PJ, Holmes S. Waste not, want not: why rarefying microbiome data is inadmissible. PLoS Comput Biol. 2014;10:e1003531.
- Anders S, Huber W. Differential expression analysis for sequence count data. Genome Biol. 2010;11:R106. doi:10.1186/gb-2010-11-10-r106.
- Oksanen J, Blanchet FG, Kindt R, Legendre P, Minchin PR, O’hara RB, Simpson GL, Solymos P, Stevens MH, Wagner H, Oksanen MJ. Package ‘vegan’. Community ecology package, version 2 (9). The R foundation for statistical computing. (https://www. r-project. org). 2013.