
ABSTRACT
The change of dietary habits in Western societies, including reduced consumption of fiber, is linked to alterations in gut microbial ecology. Nevertheless, mechanistic connections between diet-induced microbiota changes that affect colonization resistance and enteric pathogen susceptibility are still emerging. We sought to investigate how a diet devoid of soluble plant fibers impacts the structure and function of a conventional gut microbiota in specific-pathogen-free (SPF) mice and how such changes alter susceptibility to a rodent enteric pathogen. We show that absence of dietary fiber intake leads to shifts in the abundances of specific taxa, microbiome-mediated erosion of the colonic mucus barrier, a reduction of intestinal barrier-promoting short-chain fatty acids, and increases in markers of mucosal barrier integrity disruption. Importantly, our results highlight that these low-fiber diet-induced changes in the gut microbial ecology collectively contribute to a lethal colitis by the mucosal pathogen Citrobacter rodentium, which is used as a mouse model for enteropathogenic and enterohemorrhagic Escherichia coli (EPEC and EHEC, respectively). Our study indicates that modern, low-fiber Western-style diets might make individuals more prone to infection by enteric pathogens via the disruption of mucosal barrier integrity by diet-driven changes in the gut microbiota, illustrating possible implications for EPEC and EHEC infections.
Introduction
Typical diets in Western societies are characterized by a fiber intake below the recommended amount of 28–38 g per day.Citation1 Such a reduced consumption of fiber is a possible explanation for the imbalances in gut microbial communities, which have been associated with various diseases such as inflammatory bowel disease (IBD) and colorectal cancer.Citation2 Furthermore, several studies have shown a link between Western-style diets (WSD) and enteric pathogenic infections in mice.Citation3–5 Specifically, bacterial metabolites derived from dietary fiber fermentation are known to impact disease severity of enteropathogenic infections.Citation6 As shown in mouse models, apart from maintaining immune homeostasis by producing certain metabolites like short-chain fatty acids (SCFAs) from dietary fiber digestion,Citation7,Citation8 the intestinal microbiome confers colonization resistance against invading enteric pathogens by enhancing mucosal barrier integrityCitation9 or by competing for the same nutritional resources.Citation10 However, knowledge of how deprivation of dietary fiber impacts susceptibility to a mucosal pathogen by the altered gut microbial ecology remains uncovered.
The murine mucosal pathogen Citrobacter rodentium forms attaching and effacing (A/E) lesions on the intestinal mucosa of the host and is often used as a model for human enteropathogenic and enterohemorrhagic Escherichia coli (EPEC and EHEC, respectively) infections.Citation11 Thus, C. rodentium allows further study of how deprivation of dietary fiber impacts the complex ecological interactions between the gut microbiome, enteropathogens and the host. This, in turn, can aid in understanding the associations of Western-style dietary patterns with increased susceptibility to enteric pathogens.Citation12 The lessons learned from such a model could furthermore inform strategies for designing customized diets to reduce the burden of enteric infections.
We previously showed that, when gnotobiotic mice colonized with a 14-member synthetic human gut microbiome (14SM) are fed a fiber-free diet, a community-wide proliferation of mucin-degrading bacteria causes erosion of the intestinal mucus barrier.Citation13 This leads to lethal colitis by the rodent mucosal pathogen C. rodentium.Citation13 It was uncertain whether our results from a gnotobiotic mouse model could be observed within specific-pathogen-free (SPF) mice, since the pathogen should face increased colonization resistance from a native, complex gut microbiota. Here, we investigated whether increased susceptibility to C. rodentium can be observed in fiber-deprived SPF mice and whether accompanying alterations in the gut homeostasis might contribute to the virulence of this mucosal pathogen.
Methods
Ethical statement
The animal experiments were approved by the Animal Welfare Structure of the Luxembourg Institute of Health (protocol number: DII-2017-14) and by the Luxembourgish Ministry of Agriculture, Viticulture and Rural Development (national authorization number: LUPA 2018/09). All experiments were performed according to the “Règlement grand-ducal du 11 janvier 2013 relatif à la protection des animaux utilisés à des fins scientifiques” based on the “Directive 2010/63/EU” on the protection of animals used for scientific purposes. The mice were housed in a specific-pathogen-free (SPF) facility according to the conditions stated in the recommendations of the Federation of European Laboratory Animal Science Association (FELASA).
Experimental design and dietary treatment
A total of fifty 6- to 8-week-old, female C57BL/6J mice purchased from Charles River Laboratories (Saint Germain Nuelles, 69210, France) were used for the experiments reported in this study. All mice were bred and housed in the same breeding room at Charles River Laboratories and were derived from the same colony. After the arrival of all mice in the same transport box, mice were housed in the same individually ventilated cage (IVC) rack with up to five animals per cage. Throughout the experiments, all animals were exposed to 12 hours of light daily. Sterile water and diets were provided ad libitum. Upon arrival, all mice were maintained on a standard mouse chow, which we henceforth call a fiber-rich (FR) diet, for seven days. After the seven days of settling time, the cages were randomly allocated to one of the two dietary groups. The first group of five cages was maintained on the FR diet (n = 25), while the second group of five cages was switched to a fiber-free (FF) diet (n = 25) for 36–40 days. Fecal samples were collected from both groups (FR, n = 10 and FF, n = 10) before the diet switch (d00) to confirm similar microbial colonization using 16S rRNA gene analyses and during the feeding period (D08 and D22) to analyze changes in microbial abundances. Prior to sacrificing and to infection with Citrobacter rodentium (D36), fecal samples were collected from all fifty mice for various readouts such as lipocalin (Lcn2) quantification (FR, n = 25 and FF, n = 25), p-nitrophenyl glycoside-based enzyme assay (FR, n = 4 and FF, n = 4), and 16S rRNA gene sequencing (FR, n = 10 and FF, n = 10). After the feeding period, 10 mice (FR, n = 5 and FF, n = 5) were euthanized by cervical dislocation for mucus layer measurements, histological evaluation, colon length measurements and short-chain fatty acid quantification (cecal contents). Nine animals (FR, n = 4 and FF, n = 5) were maintained on the two diets for a total of 70 days to control for diet-specific weight alterations. Twenty animals were infected with approximately 2 × 10⁸ colony-forming units (CFUs) of kanamycin-resistant, wild-type C. rodentium strain (DBS 120) via intragastric gavage of 0.2 ml bacterial culture (FR, n = 10 and FF, n = 10; five mice per cage). The same inoculum of C. rodentium was used to gavage all mice in both dietary groups. Fecal samples were collected daily following the infection. Mice were scored daily (none, mild, moderate, or severe) for the following criteria: reduced grooming habits resulting in dull coat, weight loss, activity, diarrhea, constipation, anorexia, hunched back position, and dehydration. The same scoring was also used for uninfected animals maintained on the two diets for 70 days. Animals were euthanized if three of the criteria were scored as moderate, one of the physical appearance criterions was scored as severe, or if the animals lost >20% of their initial body weight (measured on the day of infection, before the intragastric gavage of C. rodentium).
Animal diets
The fiber-free (FF) diet was manufactured by SAFE diets (Augy, France), as previously described,Citation13 and was synthesized according to a modified version of the Harlan TD.08810 diet. The fiber-rich (FR) diet (4.23% crude fiber) is the standard mouse chow in the local animal facility (Special Diets Service; Essex, UK; product code: 801722). The FF diet and the FR diet were both sterilized using 9 kGy gamma irradiation.
Mucus layer measurements and histological evaluation
After euthanizing the animals by cervical dislocation, the gastrointestinal tracts were dissected, the colons were rapidly separated and fixed in methacarn solution for five hours (60% dry methanol, 30% chloroform, 10% glacial acetic acid) and then stored in 100% methanol until further processing. Samples were infiltrated with paraffin in a tissue processor, embedded in paraffin and subjected to either Alcian blue or hematoxylin and eosin (H&E) staining on thin colonic sections (5 µm). Alcian blue-stained sections were used for the mucus layer measurements, as described previously.Citation13 Samples were deparaffinized in xylene (2x) for 8 min and 5 min, hydrated in 96%, 80%, and 70% ethanol (5 min each) and transferred to distilled water (30 sec). Samples were stained in Alcian blue solution (30 min) and washed under running tap water (2 min), briefly rinsed in distilled water (30 sec), and dehydrated with 96% alcohol (2x) for 1.5 min and 2 min. Samples were transferred to isopropanol (5 min) and treated with xylene (2x) for 5 min each and covered with a coverslip. Partially overlapping tile pictures over the entire colon length were taken by M. N. using a Zeiss Axio Observer Z1 Inverted Phase Contrast Fluorescence Microscope with the Zen software. The mucus layer measurements were performed in a single-blinded fashion by A. P. using ImageJ. Depending on the size of the fecal pellet, between 100 and 1300 measurements were performed and the average mucus layer thickness was calculated for each animal by averaging the measurements. H&E-stained sections were used for blinded histological scoring. Samples were deparaffinized as described above and stained with hematoxylin solution (5 min), washed in distilled water (30 sec) and transferred to running tap water (5 min). Samples were counterstained with 1% aqueous eosin (5 min), washed under running tap water (4 min), dehydrated as described above and covered with a coverslip. Histological scoring was performed with a validated scaleCitation14 of 0–3 with “0” representing no inflammation, “1” representing mild inflammation, “2” representing moderate inflammation and “3” representing severe inflammation. A total of 12 categories for histomorphological scores were usedCitation14 to evaluate 4–5 consecutive colonic regions and microscopic fields to determine the averages per group (e.g. infiltration of inflammatory cells, crypt hyperplasia, goblet cell loss, and distortion of colonic architecture; please see 14 for detailed criteria about histomorphological scores).
Citrobacter rodentium growth and fecal quantification
C. rodentium was cultured aerobically from a cryostock on LB-agar plates supplemented with 50 µg/ml kanamycin. A single colony was incubated in Luria-Bertani (LB) broth without antibiotic supplementation at 37°C for 22 hours. The culture was then diluted in phosphate-buffered saline (PBS) to reach the concentration of approximately 2 × 10⁸ CFU per 0.2 ml, which was verified by plating on LB-agar plates supplemented with 50 µg/ml kanamycin. Fecal sampling to determine C. rodentium CFUs was performed daily and samples were processed immediately. CFU detection continued to be performed daily for FF-fed mice until day 47 post infection, whereas no further CFU detection was performed for FR-fed mice upon pathogen clearance. The samples were weighed, homogenized in 1 ml cold PBS, and 10 µl of the fecal suspensions was plated in serial dilutions on LB-agar plates supplemented with 50 µg/ml kanamycin. The plates were incubated aerobically overnight at 37°C and the emerging colonies from the appropriate dilutions, ranging from 104 to 1012, were counted. For CFU analysis of sacrificed animals, fresh cecal contents were collected and processed immediately, as described above.
Lipocalin ELISA
A total of n = 50 samples (FR, n = 25; FF, n = 25) were used for this experiment. Lipocalin (Lcn2) concentration was determined for fecal samples stored at –20°C. Ice-cold PBS with 1% Tween 20 (500 µl) was added to fecal pellets , followed by homogenization for 20 min at 4°C on a thermomixer. Samples were then centrifuged for 10 min at 18 000 × g at 4°C. Supernatants were stored at –20°C and Lcn2 detection was performed using the Mouse Lipocalin-2/NGAL DuoSet Elisa, R&D Systems (Bio-Techne), according to the manufacturer’s instructions.
Colon length measurements
Colons fixed in methacarn solution (see above) were transferred to a histology cassette and stored in 100% methanol. The lengths of colons were measured as previously described .Citation13
Intestinal fatty acid analysis
Flash-frozen cecal contents (30–100 mg) stored at –80°C were homogenized using five ceramic beads (1.4 mm) per tube with 500 µl stock solution IS (2-Ethylbutyric acid, 20 mmol/L) per 50 mg of cecal content (VK05 Tough Micro-Organism Lysing Kit). Samples were homogenized at 4 500 × g for 30 sec at 10°C (Precellys 24 Homogenizer) and centrifuged for 5 min at 21 000 x g and 4°C. Further processing of the homogenate and measurements of SCFAs were then performed using high-performance liquid chromatography (HPLC), as previously described.Citation15
P-Nitrophenyl glycoside-based enzyme assays
Frozen fecal samples were stored and processed according to an established protocol.Citation16 The activity of three host mucus targeting bacterial enzymes, β-N-acetylglucosaminidase, sulfatase, α-fucosidase, and two dietary plant fiber glycan-targeting bacterial enzymes, α-galactosidase, and β-glucosidase were investigated. Details about bacterial enzymes, their biological substrate and the chemical substrate used for activity detection can be found in .
Table 1. Bacterial enzymes and chemical substrates used for activity detection
Illumina sequencing of 16S rRNA genes and data analysis
Fecal samples were stored at –20 C° until bacterial DNA extraction and library preparations, which were performed as previously described.Citation13 The cited protocol is a modified version of the protocol by Kozich et al. in which the V4 region of the 16S rRNA gene is amplified using dual-index primers.Citation17 Raw sequences have been deposited in the European Nucleotide Archive (ENA) under the study accession number PRJEB44016. The raw sequences were processed using the program mothur (v1.33.3)Citation18 according to the MiSeq SOP published on the mothur website.Citation17,Citation19 Probabilistic modeling to cluster the microbial communities in metacommunities was performed in mothur based on the Dirichlet multinomial mixtures method.Citation20 Alignment and classification of the sequences was done using the SILVA reference database (release 132).Citation21 Chimeric sequences were removed using the VSEARCH tool. Microbial abundance figures were generated using the following packages in RStudio 4.0.2: phyloseq 1.34.0,Citation22 ggplot2 3.3.3,Citation23 vegan 2.5.7,Citation24 forcats 0.5.1.Citation25 Alpha diversity analyses were performed on unfiltered data. The Principal Coordinates of Analysis (PCoA) plot is based on Bray-Curtis dissimilarity index, after filtering out taxa not seen at least 10 times in at least 20% of the samples. The spatial means of the FR diet-fed mice and FF diet-fed mice clusters at the end of the feeding period were significantly different by PERMANOVA using adonis (p = 0.001), although a significant betadisper test (p = 0.001) means that this finding could be an artifact of the heterogenous dispersions. The heatmap was generated based on the top 50 significant OTUs determined using DESeq2 1.30.1;Citation26 all OTUs shown are significant based on an adjusted p-value < 0.01. The heatmap shows log2 fold-change for data rarefied to the minimum library size and filtered (minimum 10 counts in 20% of samples) displaying the fold-changes in abundance of each OTU, relative to the average abundance of that OTU in the comparator dietary group. Samples where the read count is zero are presented as infinitely negative values. In cases where all samples in a group had zero read counts, all samples with a non-zero value in the comparator group are then infinitely positive relative to the other group’s zero average count. Adjusted p-values were obtained using the Benjamini-Hochberg procedure to correct for multiple comparisons.
Results and discussion
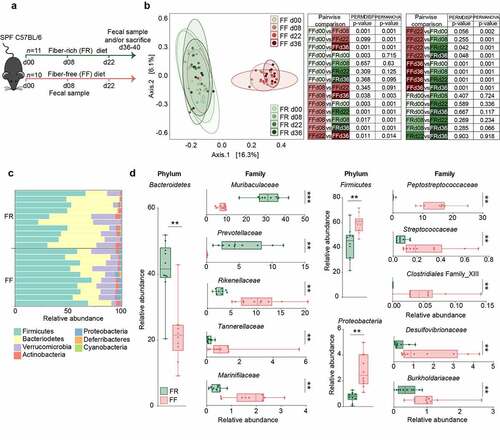
Six to eight-week-old, age-matched specific-pathogen-free (SPF) female C57BL/6J mice were maintained on a mouse chow, which, with a fiber content of 4.23% crude fiber, we consider to be a fiber-rich (FR) diet. Ten animals were switched to a fiber-free (FF) diet and were continuously fed the FF diet for a 36–40 days “feeding period” (). As controls, the remaining C57BL/6J mice were maintained on the FR diet. The FR diet contained naturally milled food ingredients with crude plant fiber sources, such as corn, soybean, and wheat, whereas the isocaloric FF diet lacked such plant polysaccharides and instead contained increased levels of glucose.Citation13 Throughout the feeding period, the FF-fed mice did not exhibit any physiological irregularities (data not shown) or weight loss.
Figure 1. Fiber deprivation in mice harboring a complex microbiome results in changes in bacterial families
Fiber deprivation leads to an increase in potential mucus-degrading bacterial taxa in SPF mice
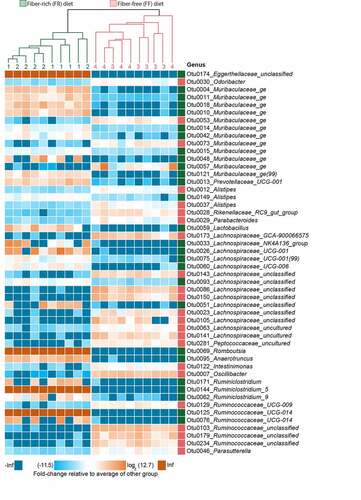
Before, during and at the end of the feeding period (d00, d08, d22 and d36), 16S rRNA gene sequencing (Illumina MiSeq platform) was performed in two independent experiments using DNA extracted from the mouse fecal samples. The results were compared to the FR-fed mice to evaluate changes in microbiome composition in response to diets with different fiber content (–d). Alpha diversity between groups was not significantly different using the Chao 1 richness estimate or by Shannon and inverse Simpson indices, which account for the evenness of the detected taxa (data not shown). Principal Coordinates of Analysis (PCoA) based on Bray-Curtis dissimilarity () confirmed similar microbial composition before the diet switch (d00) and statistically significant clusters by diet during the feeding period (d08 and d22 after diet switch). The PCoA furthermore revealed significant diet-specific clustering by PERMANOVA (p = 0.001) after 36 days of feeding. Although the dispersion was significantly different between the diets at d36 (p = 0.001), it is reasonable to conclude that the spatial medians are indeed significantly different since the design is balanced.Citation27 On the phylum-level, Proteobacteria and Firmicutes were significantly higher among FF-fed mice, whereas Bacteroidetes was enriched in FR-fed mice (). Family-level analysis revealed heterogeneous changes within the Bacteroidetes phylum, as Muribaculaceae and Prevotellaceae were enriched in FR-fed mice, but Rikenellaceae, Marinifilaceae, and Tannerellaceae were higher among FF-fed mice (). Firmicutes belonging to Peptostreptococcaceae, Streptococcaceae, and Clostridiales Family XIII, were higher among FF-fed mice, as were Proteobacteria belonging to Burkholderiaceae and Desulfovibrionaceae families (). An expansion of Proteobacteria has been associated with intestinal epithelial dysfunction.Citation28 Peptostreptococcaceae have been found to be enriched in patients with colorectal cancerCitation29 and has been associated with a decrease in mucus layer thickness.Citation30 Furthermore, increased levels of Bacteroidetes over Firmicutes, as shown in FR-fed animals (), has been previously linked with a decreased C. rodentium susceptibility.Citation31 Analysis of log2 fold-change on an OTU level using DESeq2 reveals discrete changes between the dietary conditions (). We exclude a cage effect based on the Dirichlet multinomial mixtures method,Citation20 which identified only two microbial community clusters that correspond to the diet. These clusters are evident in the phylogenetic tree of the heatmap, depicting samples from individual animals and their corresponding cages (). An upregulation of specific OTUs belonging to the bacterial genera Lachnospiraeceae, Ruminococcaceae, and Oscillibacter could be detected in fiber-deprived animals compared to the control group (). An increased abundance of Lachnospiraeceae spp. has previously been reported to be associated with the increased susceptibility to adherent-invasive Escherichia coli (AIEC) infection.Citation32 Furthermore, Ruminococcaceae spp.Citation33 Lachnospiraceae spp., Clostridiales spp., Desulfovibrionales spp., and Oscillibacter spp. have been shown to correlate with the production of branched chain fatty acids (BCFAs), such as isovaleric and isobutyric acid.Citation34
Figure 2. Fiber deprivation in mice harboring a complex microbiome results in changes in bacterial families with no detectable cage effect
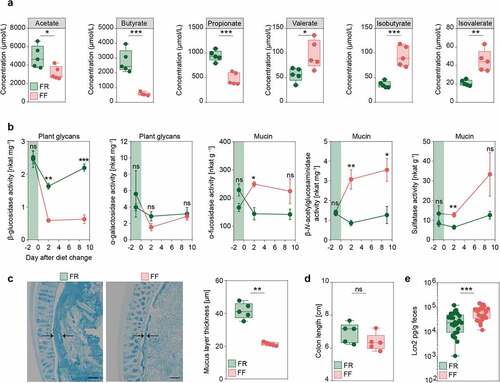
In line with these and previous results, we investigated whether dietary fiber deprivation resulted in altered intestinal fatty acid concentrations by measuring levels of SCFAs (acetate, butyrate, propionate, and valerate) and BCFAs (isobutyrate and isovalerate) in cecal contents of FR-fed and FF-fed mice at the end of the feeding period. We detected significantly increased levels of the SCFAs acetate, propionate and butyrate in FR-fed mice compared to FF-fed mice, while amounts of all detected BCFAs were significantly lower compared to fiber-deprived mice (). While SCFAs are generated largely by the microbial fermentation of dietary fibers,Citation35 intestinal BCFAs are mainly the result of bacteria-mediated dietary protein metabolism.Citation36
Figure 3. Fiber deprivation in mice harboring a complex microbiome results in changes in bacterial enzyme activity and levels of mucosal barrier integrity markers
Among other microbial protein fermentation products, such as phenol, biogenic amines, hydrogen sulfide and p-cresol,Citation37 BCFAs are associated with an increased colonic epithelial cell permeability in vitro,Citation38 whereas SCFAs are reported to maintain mucosal barrier integrity by increasing mucin-2 glycoprotein (MUC2) expression,Citation39 enhancing colonic tight-junction assembly,Citation40 and stimulating antimicrobial peptide secretion.Citation41 Furthermore, changes in intestinal butyrate concentration is known to affect susceptibility of C. rodentiumCitation42 and oral administration of butyrate ameliorates C. rodentium-induced inflammation via enhanced IL-22 production.Citation43
Additionally, specific species within the Rikenellaceae (Alistipes),Citation44,Citation45 LachnospiraceaeCitation46,Citation47 and MuribaculaceaeCitation45 families are thought to possess the capacity to degrade mucus. Thus, in line with our 14SM model,Citation13 our results suggest that the deprivation of dietary fiber may also increase mucus-degrading populations in the SPF mice containing their native gut microbiota. An increase in Desulfovibrionaceae family () is consistent with the significant increase of Desulfovibrio piger (family: Desulfovibrionaceae), which was previously observed in fiber-deprived 14SM-colonized gnotobiotic mice.Citation13 An increase in these sulfate-reducing bacteria indicates higher availability of sulfate groups that are used as an electron acceptor by this group of bacteria. A possible source of this increased sulfate could be the terminal sulfate groups on the colonic mucin-associated glycans.Citation10
A dietary fiber-deprived gut microbiota erodes the colonic mucus layer in SPF mice
Given the relevance of mucus erosion on pathogen-susceptibility of fiber-deprived mice in a gnotobiotic mouse model,Citation13 we evaluated whether the increase in these potentially mucus-degrading taxa resulted in the increased activities of microbial enzymes that are involved in the degradation of host-secreted colonic mucus. We studied activities of five different enzymes in the mouse fecal samples before, and after a switch to the FF diet. Our results show a significant increase in the activities of three microbial enzymes, namely α-fucosidase, β-N-acetylglucosaminidase and sulfatase (), that are involved in colonic mucus degradation. Conversely, the activity of β-glucosidase, an enzyme involved in the degradation of plant glycans, was significantly decreased in the FF-fed animals.
To assess the impact of the increased activities of these mucus-specific enzymes on the mucus layer, we performed measurements of the colonic mucus layer thickness, using fixed colonic tissue samples stained with Alcian blue.Citation13 The mucus measurements revealed significantly decreased mucus layer thickness in fiber-deprived mice compared to the FR-fed mice (). Taken together, decreased SCFA levels and reduced mucus layer thickness suggest impairment of the intestinal mucosal barrier in fiber-deprived mice.
In order to evaluate inflammatory reactions in the colonic tissue in response to the potential mucosal barrier impairment in the FF-fed mice, we measured colon lengths and the levels of lipocalin (Lcn2), a sensitive marker capable of detecting low-grade inflammation, in fecal contents of the FR- and FF-fed mice after the feeding period. There was a trend toward reduced colon lengths in the FF-fed animals compared to the FR-fed animals (), athough this was not statistically significant. Fecal Lcn2 levels, however, were significantly increased in fiber-deprived mice (), indicating an increased inflammatory tone in FF-fed mice without pronounced colonic inflammation. Furthermore, histopathological evaluationCitation14 of colonic hematoxylin/eosin-stained sections did not reveal significant differences between FR- and FF-fed mice (histology data not shown; average histological score for FR-fed mice 0.017 (SD, 0.058) and for FF-fed mice 0.12 (SD, 0.232); Mann–Whitney test, two tailed, p = 0.342). These observations were in line with the previous observation in our gnotobiotic mouse modelCitation13 and prompted us to investigate whether the diet-induced alterations in the microbiome composition and its associated effects on the markers of mucosal barrier integrity impacted the susceptibility of fiber-deprived mice to infection with C. rodentium.
Deprivation of dietary fiber in SPF mice promotes susceptibility to C. rodentium
To test our hypothesis, we infected FF-fed and control FR-fed mice with C. rodentium. Weight and general appearance were monitored daily for up to 47 days post infection (dpi), and fecal C. rodentium (Cr) colony forming units (CFUs) were assessed until all animals cleared the pathogen or had to be euthanized (). FR and FF animals without infection showed no significant weight differences in two dietary groups for up to 70 days after switch to the FF diet (). The FF-fed animals infected with Cr demonstrated significantly higher weight loss compared to the FR-fed animals, with several animals requiring euthanasia owing to >20% weight loss (). In line with the observed weight loss, survival curves of infected animals fed the two different diets showed only a 40% survival rate in FF-fed mice, whereas 100% of the mice in the FR-fed group survived ().
Figure 4. Fiber-deprivation in mice is associated with a higher susceptibility to C. rodentium infection
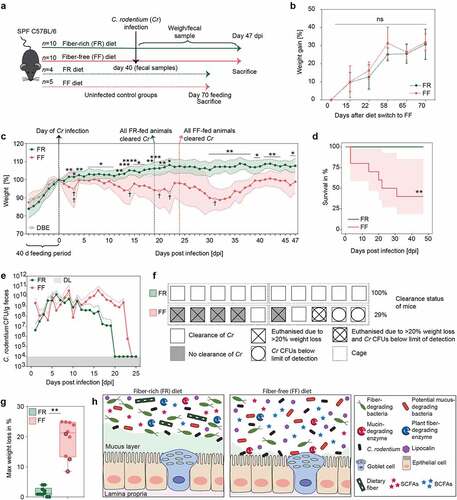
Moreover, FF-fed mice showed overall delayed Cr clearing capacities and elevated CFUs in fecal samples until 23 dpi (). While the FR-fed mice showed rapidly decreasing CFUs after 11 dpi and all mice of this group cleared the pathogen completely by 19 dpi (), the FF-fed mice took longer (24 dpi) to clear the pathogen. Although three FF animals failed to show detectable CFUs, one out of these three FF animals had to be euthanized on 31 dpi due to weight loss (), suggesting that fiber deprivation acts in favor of a lethal Cr phenotype even when CFUs are below the detection limit. These results suggest that dietary fiber deprivation is associated with a delayed Cr clearance () as well as reduced rates of clearance () and an overall higher weight loss (). The infection by Cr is usually self-limiting in healthy mice because the commensal gut bacteria are able to outcompete the pathogen by competing for nutritional resources, such as monosaccharides.Citation48,Citation49
A lethal infection phenotype like the one we observed in the FF-fed wild-type mice has typically been observed in mice lacking essential genes that protect from Cr clearance and invasion, such as Muc250 or genes encoding the cytokines IL-10 and IL-22.Citation51,Citation52 Our previousCitation13 and current studies show that such a lethal phenotype could be generated in wild-type mice merely by eliminating plant fibers from the diet. Given that Muc2−/− mice exhibit a similar lethal phenotype to Cr,Citation50 it is plausible that the fiber-deprived gut microbiota-led erosion of the mucus layer contributes to the pathogenicity. Nevertheless, germ-free mice, which naturally possess a thinner mucus layer, on either the FR and FF diets do not exhibit a lethal colitis following the Cr infection on either the FR or FF diet.Citation13 Thus, together with our previous study,Citation13 the current study further supports the role of a fiber-deprived, mucus-eroding gut microbiota in driving susceptibility to Cr. Notably, no systemic spread of Cr into other organs, such as liver or spleen, could be detected in FF-fed mice that had to be euthanized due to >20% weight loss (data not shown). These results indicate a local impact of Cr in the cecum and colon, possibly driven by differences in the microbiota composition and microbial mucus erosion, that drives the lethal phenotype.
Conclusion
Our results indicate a crucial role of fiber intake on the maintenance of mucosal barrier integrity governed by the microbial ecology of the native, complex mouse microbiome, which plays an important role in protecting against infection with a mucosal pathogen. Different microbiota compositions, in mice from distinct mouse facilities, are responsible for a variable colitis phenotype to Cr infection.Citation42 Here, we show that mice possessing the same starting microbiota (), when fed a fiber-deprived diet, undergo a change in the composition and function of the gut microbiota (-), which collectively contributes to a lethal phenotype to Cr ().
A recent study showed that the WSD as compared to a standard grain-based chow (GBC) impedes the initial colonization of Cr, although WSD leads to alterations in the gut microbiota in such a way that Cr cannot be outcompeted by the microbiota;Citation53 hence, Cr in the mice fed WSD cannot be cleared or the clearance is delayed. Here, we observed a similarly delayed clearance of Cr in mice fed the FF diet. However, the difference in the phenotype we observe in the FF diet and the one observed in the WSD-fed mice could be rooted in important differences in the composition of these two diets. While the WSD contains nearly twice the amount of %kcal derived from fat as compared to the FF diet (60% vs. 34.1%), the FF diet contains more than twice the calories derived from carbohydrates as compared to the WSD (42.4% vs 20%). Other reasons for differences in the Cr infection phenotypes observed with the FF diet and the WSD could be related to the differences in the native mouse gut microbiota and/or differences in the initial pathogen CFU gavaged in the mice.
Compositional differences between the FR and FF diets other than the fiber content, such as increased amounts of simple sugar in the FF diet, raise a caveat in directly associating the lethal phenotype observed in FF-fed mice with the absence of plant fiber. Although we cannot rule out potential effects of other compositional differences between the FR and FF diets, using our 14SM community, we have documented that the two diets lead to a major impact on the fiber- versus mucin-utilization dynamics of the gut microbiota.Citation13 Furthermore, our current data clearly show that the FF diet leads to enhanced mucin degradation by the gut microbiota, which occurs as a result of fiber deprivation. As SCFAs are derived abundantly from microbial fermentation of dietary fiber,Citation35 the decreased butyrate levels of FF-fed mice compared to the control group can be linked to the dietary fiber deprivation. Butyrate provides up to 80% of the required energy for colonocytes to maintain colonic homeostasis.Citation54,Citation55 The decreased butyrate levels in FF-fed mice might lead to a more vulnerable mucosal barrier, thereby contributing to the increased lethal phenotype when challenged with an enteric pathogen. Thus, it is likely that the absence of plant fiber in the FF diet plays a crucial role on the lethal phenotype observed in this study.
Further investigations are needed to determine specific dietary strategies and/or usage of various reduced microbial communities in gnotobiotic mouse models to understand which specific bacterial taxa, their associated bacterial enzymes or microbial cross-talk with the host immune system modulate susceptibility to Cr infection. A follow-up study to the current one needs to utilize various reduced synthetic communities, such as removing some or all four mucus degraders from our 14SM model,Citation13 to better understand the mechanisms of how mucin-degrading bacteria possibly erode the mucus layer and contribute to the lethal phenotype of Cr under fiber deprivation. Removing specific pathogen-promoting and mucus-degrading bacterial species could aid to understand if targeted microbiome modulations could be a tool to prevent severe disease outcomes. Such future studies would also facilitate the understanding whether the changes observed here (mucus reduction, changes in microbial metabolites, and elevated inflammation) independently contribute to the lethal phenotype of Cr or whether a combination of such changes is essential in order to drive susceptibility to Cr.
Although the burden of intestinal pathogenic infections is increased and is often more lethal in developing countries compared to westernized countries,Citation56 further studies elaborating the connection between a WSD and enteric infections could help to prevent associated diseases such as irritable bowel syndromeCitation57 and tackle emerging antibiotic overuse.Citation58 Our findings underline the importance of increased dietary fiber consumption in WSD in order to strengthen colonization resistance and barrier integrity within the host against possible enteric infections by EPEC and EHEC.
Declarations
Authors’ contributions
Conceptualization, M.N., D.B., E.C.M., and M.S.D.; Experiments, M.N., M.W., S.W., and A.P.; Investigation, M.N., A.S., E.T.G., and M.S.D.; Resources, M.N., S.W., E.T.G, M.W., A.P., A.S., E.C.M., and M.S.D.; Writing – Original Draft, M.N., A.S., and M.S.D; Writing – Review & Editing, M.N., A.S., E.T.G., A.P., M.W., E.C.M. and M.S.D.; Supervision, M.S.D.; Funding Acquisition, M.S.D.
Acknowledgments
Work in the authors’ laboratory was supported by the following grants to M.S.D.: Luxembourg National Research Fund (FNR) CORE grants (C15/BM/10318186 and C18/BM/12585940). M.N. and A.P. and were supported by the FNR AFR bilateral grant (15/11228353) and FNR AFR individual grant (11602973), respectively. E.T.G. was supported by the FNR PRIDE grant (17/11823097) and the Fondation du Pélican de Mie et Pierre Hippert‐Faber under the aegis of the Fondation de Luxembourg. D.B. is supported by the FNR-ATTRACT program (A14/BM/7632103). E.C.M. was supported by grants from the US National Institutes of Health (DK118024 and DK125445).
Availability of data and materials
Most of the data generated or analysed during this study are included in this article. Please contact author for data requests.
Disclosure statement
The authors declare that they have no competing interests.
References
- EFSA. Panel on dietetic products n, allergies. scientific opinion on dietary reference values for carbohydrates and dietary fibre. EFSA Journal 2010;8:1462.
- Makki K, Deehan EC, Walter J, Bäckhed F. The impact of dietary fiber on gut microbiota in host health and disease. Cell Host Microbe. 2018;23(6):705–15. doi:10.1016/j.chom.2018.05.012.
- Mefferd CC, Bhute SS, Phan JR, Villarama JV, Do DM, Alarcia S, Abel-Santos E, Hedlund BP. A high-fat/high-protein, atkins-type diet exacerbates Clostridioides (Clostridium) difficile infection in mice, whereas a high-carbohydrate diet protects. mSystems. 2020;5(1):e00765-19.
- Wotzka SY, Kreuzer M, Maier L, Arnoldini M, Nguyen BD, Brachmann AO, Berthold DL, Zünd M, Hausmann A, Bakkeren E, et al. Escherichia coli limits salmonella typhimurium infections after diet shifts and fat-mediated microbiota perturbation in mice. Nature Microbiology. 2019;4(12):2164–2174. doi:10.1038/s41564-019-0568-5.
- Agus A, Denizot J, Thévenot J, Martinez-Medina M, Massier S, Sauvanet P, Bernalier-Donadille A, Denis S, Hofman P, Bonnet R, et al. Western diet induces a shift in microbiota composition enhancing susceptibility to adherent-invasive e. coli infection and intestinal inflammation. Scientific Reports. 2016;6(1):19032. doi:10.1038/srep19032.
- Jacobson A, Lam L, Rajendram M, Tamburini F, Honeycutt J, Pham T, Van Treuren W, Pruss K, Stabler SR, Lugo K, et al. A gut commensal-produced metabolite mediates colonization resistance to salmonella infection. Cell Host & Microbe. 2018;24(2):296–307.e7. doi:10.1016/j.chom.2018.07.002.
- Lin L, Zhang J. Role of intestinal microbiota and metabolites on gut homeostasis and human diseases. BMC Immunol. 2017;18(1):2. doi:10.1186/s12865-016-0187-3.
- Smith PM, Howitt MR, Panikov N, Michaud M, Gallini CA, Bohlooly YM, Glickman JN, Garrett WS. The microbial metabolites, short-chain fatty acids, regulate colonic treg cell homeostasis. Science. 2013;341(6145):569–573. doi:10.1126/science.1241165.
- Buffie CG, Pamer EG. Microbiota-mediated colonization resistance against intestinal pathogens. Nature Reviews Immunology. 2013;13(11):790–801. doi:10.1038/nri3535.
- Martens EC, Neumann M, Desai MS. Interactions of commensal and pathogenic microorganisms with the intestinal mucosal barrier. Nat Rev Microbiol. 2018;16(8):457–470. doi:10.1038/s41579-018-0036-x.
- Mullineaux-Sanders C, Sanchez-Garrido J, Hopkins EGD, Shenoy AR, Barry R, Frankel G. Citrobacter rodentium–host–microbiota interactions: immunity, bioenergetics and metabolism. Nature Reviews Microbiology. 2019;17(11):701–715. doi:10.1038/s41579-019-0252-z.
- Cao Y, Liu J, Zhu W, Qin N, Ren X, Zhu B, Xia X.Impact of dietary components on enteric infectious disease. Critical Reviews in Food Science and Nutrition 2021:1-26.
- Desai MS, Seekatz AM, Koropatkin NM, Kamada N, Hickey CA, Wolter M, Pudlo NA, Kitamoto S, Terrapon N, Muller A, et al. A dietary fiber-deprived gut microbiota degrades the colonic mucus barrier and enhances pathogen susceptibility. Cell. 2016;167(5):1339–53 e21. doi:10.1016/j.cell.2016.10.043.
- Erben U, Loddenkemper C, Doerfel K, Spieckermann S, Haller D, Heimesaat MM, Zeitz M, Siegmund B, Kühl AA. A guide to histomorphological evaluation of intestinal inflammation in mouse models. International Journal of Clinical and Experimental Pathology. 2014;7:4557–4576.
- Greenhalgh K, Ramiro-Garcia J, Heinken A, Ullmann P, Bintener T, Pacheco MP, Baginska J, Shah P, Frachet A, Halder R, et al. Integrated in vitro and in silico modeling delineates the molecular effects of a synbiotic regimen on colorectal-cancer-derived cells. Cell Rep. 2019;27(5):1621–1632.e9. doi:10.1016/j.celrep.2019.04.001.
- Steimle A, Grant ET, Desai MS. Quantitative assay to detect bacterial glycan-degrading enzyme activities in mouse and human fecal samples. STAR Protocols. 2021;2(1):100326. doi:10.1016/j.xpro.2021.100326.
- Kozich JJ, Westcott SL, Baxter NT, Highlander SK, Schloss PD. Development of a dual-index sequencing strategy and curation pipeline for analyzing amplicon sequence data on the Miseq illumina sequencing platform. Applied and Environmental Microbiology. 2013;79(17):5112–5120. doi:10.1128/AEM.01043-13.
- Schloss PD, Westcott SL, Ryabin T, Hall JR, Hartmann M, Hollister EB, Lesniewski RA, Oakley BB, Parks DH, Robinson CJ, et al. Introducing mothur: open-source, platform-independent, community-supported software for describing and comparing microbial communities. Applied and Environmental Microbiology. 2009;75(23):7537–7541. doi:10.1128/AEM.01541-09.
- Schloss PD, MiSeq SOP 2019; https://mothur.org/wiki/miseq_sop/ 23. 10.2019 Accessed 26 Jul. 2021.
- Holmes I, Harris K, Quince C, Gilbert JA. Dirichlet multinomial mixtures: generative models for microbial metagenomics. PLOS ONE. 2012;7(2):e30126. doi:10.1371/journal.pone.0030126.
- Quast C, Pruesse E, Yilmaz P, Gerken J, Schweer T, Yarza P, Peplies J, Glöckner FO. The SILVA ribosomal RNA gene database project: improved data processing and web-based tools. Nucleic Acids Research. 2013;41(D1):D590–6. doi:10.1093/nar/gks1219.
- McMurdie PJ, Holmes S, Watson M. phyloseq: an R package for reproducible interactive analysis and graphics of microbiome census data. PLOS ONE. 2013;8(4):e61217. doi:10.1371/journal.pone.0061217.
- Wickham H. ggplot2: elegant graphics for data analysis. Springer-Verlag New York: New York; 2016.
- Oksanen J, Blanchet FG, Friendly M, Kindt R, Legendre P, McGlinn D, et al. vegan: community ecology package. R package version 2.5-7. 2020; https://CRAN.R-project.org/package=vegan 26 Jul .2021.
- Wickham H forcats: tools for working with categorical variables (Factors). R package version 0.5.1. 2021; https://CRAN.R-project.org/package=forcats 26 Jul .2021
- Love MI, Huber W, Anders S. Moderated estimation of fold change and dispersion for RNA-seq data with DESeq2. Genome Biology. 2014;15(12):550. doi:10.1186/s13059-014-0550-8.
- Anderson MJ, Walsh DCI. PERMANOVA, ANOSIM, and the mantel test in the face of heterogeneous dispersions: what null hypothesis are you testing? Ecological Monographs. 2013;83(4):557–574. doi:10.1890/12-2010.1.
- Litvak Y, Byndloss MX, Tsolis RM, Bäumler AJ. Dysbiotic proteobacteria expansion: a microbial signature of epithelial dysfunction. Current Opinion in Microbiology. 2017;39:1–6. doi:10.1016/j.mib.2017.07.003.
- Ahn J, Sinha R, Pei Z, Dominianni C, Wu J, Shi J, Goedert JJ, Hayes RB, Yang L. Human gut microbiome and risk for colorectal cancer. JNCI: Journal of the National Cancer Institute. 2013;105(24):1907–1911. doi:10.1093/jnci/djt300.
- Wlodarska M, Willing B, Bravo D, Finlay B. Phytonutrient diet supplementation promotes beneficial Clostridia species and intestinal mucus secretion resulting in protection against enteric infection. Scientific Reports. 2015;5(1):9253. doi:10.1038/srep09253.
- BP W, Vacharaksa A, Croxen M, Thanachayanont T, Finlay BB, Bereswill S. Altering host resistance to infections through microbial transplantation. PLOS ONE. 2011;6(10):e26988. doi:10.1371/journal.pone.0026988.
- Chassaing B, Koren O, Carvalho FA, Ley RE, Gewirtz AT. AIEC pathobiont instigates chronic colitis in susceptible hosts by altering microbiota composition. Gut. 2014;63(7):1069–1080. doi:10.1136/gutjnl-2013-304909.
- Aguirre M, Eck A, Koenen ME, Savelkoul PH, Budding AE, Venema K. Diet drives quick changes in the metabolic activity and composition of human gut microbiota in a validated in vitro gut model. Research in Microbiology. 2016;167(2):114–125. doi:10.1016/j.resmic.2015.09.006.
- Kortman GAM, Dutilh BE, Maathuis AJH, Engelke UF, Boekhorst J, Keegan KP, Nielsen FGG, Betley J, Weir JC, Kingsbury Z, et al. Microbial metabolism shifts towards an adverse profile with supplementary iron in the TIM-2 in vitro model of the human colon. Frontiers in Microbiology. 2016;6:1481. doi:10.3389/fmicb.2015.01481.
- El Kaoutari A, Armougom F, Gordon JI, Raoult D, Henrissat B. The abundance and variety of carbohydrate-active enzymes in the human gut microbiota. Nat Rev Microbiol. 2013;11(7):497–504. doi:10.1038/nrmicro3050.
- NE D, Willing BP. Microbial fermentation of dietary protein: an important factor in diet⁻microbe⁻host interaction. Microorganisms. 2019;7.
- Yao CK, Muir JG, Gibson PR. Review article: insights into colonic protein fermentation, its modulation and potential health implications. Alimentary Pharmacology & Therapeutics. 2016;43(2):181–196. doi:10.1111/apt.13456.
- Hughes R, Kurth MJ, McGilligan V, McGlynn H, Rowland I. Effect of colonic bacterial metabolites on Caco-2 cell paracellular permeability in vitro. Nutr Cancer. 2008;60(2):259–266. doi:10.1080/01635580701649644.
- Burger-van Paassen N, Vincent A, Puiman PJ, van der Sluis M, Bouma J, Boehm G, van Goudoever J, van Seuningen I, Renes I. The regulation of intestinal mucin MUC2 expression by short-chain fatty acids: implications for epithelial protection. Biochem J. 2009;420(2):211–219. doi:10.1042/BJ20082222.
- Peng L, Li Z-R, Green RS, Holzman IR, Lin J. Butyrate enhances the intestinal barrier by facilitating tight junction assembly via activation of AMP-activated protein kinase in Caco-2 cell monolayers. J Nutr. 2009;139(9):1619–1625. doi:10.3945/jn.109.104638.
- Zhao Y, Chen F, Wu W, Sun M, Bilotta AJ, Yao S, Xiao Y, Huang X, Eaves-Pyles TD, Golovko G, et al. GPR43 mediates microbiota metabolite SCFA regulation of antimicrobial peptide expression in intestinal epithelial cells via activation of mTOR and STAT3. Mucosal Immunology. 2018;11(3):752–762. doi:10.1038/mi.2017.118.
- Osbelt L, Thiemann S, Smit N, Lesker TR, Schröter M, EJC G, Schmidt-Hohagen K, Pils MC, Mühlen S, Dersch P, et al. Variations in microbiota composition of laboratory mice influence Citrobacter rodentium infection via variable short-chain fatty acid production. PLOS Pathogens. 2020;16(3):e1008448. doi:10.1371/journal.ppat.1008448.
- Yang W, Yu T, Huang X, Bilotta AJ, Xu L, Lu Y, Sun J, Pan F, Zhou J, Zhang W, et al. Intestinal microbiota-derived short-chain fatty acids regulation of immune cell IL-22 production and gut immunity. Nature Communications. 2020;11(1):4457. doi:10.1038/s41467-020-18262-6.
- Bomar L, Maltz M, Colston S, Graf J, Handelsman J. Directed culturing of microorganisms using metatranscriptomics. mBio. 2011;2(2):e00012–11. doi:10.1128/mBio.00012-11.
- Pereira FC, Wasmund K, Cobankovic I, Jehmlich N, Herbold CW, Lee KS, Sziranyi B, Vesely C, Decker T, Stocker R, et al. Rational design of a microbial consortium of mucosal sugar utilizers reduces Clostridiodes difficile colonization. Nature Communications. 2020;11(1):5104. doi:10.1038/s41467-020-18928-1.
- Bell A, Brunt J, Crost E, Vaux L, Nepravishta R, Owen CD, Latousakis D, Xiao A, Li W, Chen X, et al. Elucidation of a sialic acid metabolism pathway in mucus-foraging Ruminococcus gnavus unravels mechanisms of bacterial adaptation to the gut. Nat Microbiol. 2019;4(12):2393–2404. doi:10.1038/s41564-019-0590-7.
- Crost EH, Tailford LE, Monestier M, Swarbreck D, Henrissat B, Crossman LC, et al. The mucin-degradation strategy of Ruminococcus gnavus: the importance of intramolecular trans-sialidases. Gut Microbes. 2016;7:302–312. doi:10.1080/19490976.2016.1186334.
- Kamada N, Kim YG, Sham HP, Vallance BA, Puente JL, Martens EC, Nunez G. Regulated virulence controls the ability of a pathogen to compete with the gut microbiota. Science. 2012;336(6086):1325–1329. doi:10.1126/science.1222195.
- Fabich AJ, Jones SA, Chowdhury FZ, Cernosek A, Anderson A, Smalley D, McHargue JW, Hightower GA, Smith JT, Autieri SM, et al. Comparison of carbon nutrition for pathogenic and commensal escherichia coli strains in the mouse intestine. Infect Immun. 2008;76(3):1143–1152. doi:10.1128/IAI.01386-07.
- Bergstrom KS, Kissoon-Singh V, Gibson DL, Ma C, Montero M, Sham HP, Ryz N, Huang T, Velcich A, Finlay BB, et al. Muc2 protects against lethal infectious colitis by disassociating pathogenic and commensal bacteria from the colonic mucosa. PLoS Pathog. 2010;6(5):e1000902. doi:10.1371/journal.ppat.1000902.
- Dann SM, Le C, Choudhury BK, Liu H, Saldarriaga O, Hanson EM, Cong Y, Eckmann L. Attenuation of intestinal inflammation in interleukin-10-deficient mice infected with Citrobacter rodentium. Infect Immun. 2014;82(5):1949–1958. doi:10.1128/IAI.00066-14.
- Zheng Y, Valdez PA, Danilenko DM, Hu Y, Sa SM, Gong Q, Abbas AR, Modrusan Z, Ghilardi N, de Sauvage FJ, et al. Interleukin-22 mediates early host defense against attaching and effacing bacterial pathogens. Nat Med. 2008;14(3):282–289. doi:10.1038/nm1720.
- An J, Zhao X, Wang Y, Noriega J, Gewirtz AT, Zou J, Baumler AJ. Western-style diet impedes colonization and clearance of Citrobacter rodentium. PLoS Pathog. 2021;17(4):e1009497. doi:10.1371/journal.ppat.1009497.
- Gasaly N, Hermoso MA, Gotteland M. Butyrate and the fine-tuning of colonic homeostasis: implication for inflammatory bowel diseases. International Journal of Molecular Sciences. 2021;22(6):3061. doi:10.3390/ijms22063061.
- Donohoe DR, Garge N, Zhang X, Sun W, O’Connell TM, Bunger MK, Bultman S. The microbiome and butyrate regulate energy metabolism and autophagy in the mammalian colon. Cell Metab. 2011;13(5):517–526. doi:10.1016/j.cmet.2011.02.018.
- Fletcher SM, McLaws ML, Ellis JT. Prevalence of gastrointestinal pathogens in developed and developing countries: systematic review and meta-analysis. Journal of Public Health Research. 2013;2(1):42–53. doi:10.4081/jphr.2013.e9.
- Card T, Enck P, Barbara G, Boeckxstaens GE, Santos J, Azpiroz F, Mearin F, Aziz Q, Marshall J, Spiller R, et al. Post-infectious IBS: defining its clinical features and prognosis using an internet-based survey. United European Gastroenterology Journal. 2018;6(8):1245–1253. doi:10.1177/2050640618779923.
- Aslam B, Wang W, Arshad MI, Khurshid M, Muzammil S, Rasool MH, Nisar MA, Alvi RF, Aslam MA, Qamar MU, et al. Antibiotic resistance: a rundown of a global crisis. Infection and Drug Resistance. 2018;11:1645–1658. doi:10.2147/IDR.S173867.