
ABSTRACT
Sequence type (ST) 11 is one of the major lineages of carbapenem-resistant Klebsiella pneumoniae (CRKP). Although the gastrointestinal (GI) carriage of CRKP predisposes individuals to subsequent infections, little is known for its impact on gut homeostasis. In this study, we investigated the association between ST11 CRKP colonization and colorectal cancer (CRC). Two ST11 CRKP, KPC160111 (KL47) and KPC160132 (KL64), were selected as the representative strains. We used azoxymethane (AOM) and dextran sodium sulfate (DSS) to initiate a colitis-associated CRC model. Both strains established prolonged colonization in the GI tract of the AOM-DSS-treated BALB/c mice and aggravated gut dysbiosis. Under this AOM-DSS-induced setting, ST11 K. pneumoniae colonization significantly promoted the growth and progression of colorectal adenomas to high-grade dysplasia. Numerous crypts were formed inside the enlarged adenomas, in which CD163+ tumor-associated macrophages accumulated. Similarly, ST11 K. pneumoniae also increased the population size of the CD163+ macrophages with the M2 phenotype in the peritoneal cavity of LPS-primed BALB/c mice. When applied to RAW264.7 cells, ST11 K. pneumoniae polarized the macrophages toward an M2 phenotype through the inhibition of IKK-NFκB and the activation of STAT6-KLF4-IL-10. Through the M2-skewing ability, ST11 K. pneumoniae promoted the accumulation of CD163+ macrophages in the adenomatous crypts to create an immunosuppressive niche, which not only accommodated the extended stay for its own sake but also deteriorated colorectal tumorigenesis.
Introduction
Klebsiella pneumoniae is a concerning pathogen worldwide. As one of the ESKAPE, K. pneumoniae causes a wide range of infections associated with antimicrobial resistance, challenging to treat with limited therapeutic options.Citation1 Over the past decades, drug-resistant K. pneumoniae has evolved from an extended-spectrum-β-lactamase (ESBL) producer into a carbapenem-resistant superbug. Carbapenems are the “last-line” treatment for infections caused by ESBL K. pneumoniae. The emergence and global spread of carbapenem-resistant K. pneumoniae (CRKP) poses a real threat to public health. Sequence type (ST) 11 constitutes the major CRKP in South America and Asia.Citation2–6 Some lineages of ST11 have transformed into hypervirulent CRKP through acquiring a variant of virulence plasmids and had caused fatal outbreaks in China.Citation7,Citation8
Colorectal cancer (CRC) ranks third in mortality among all cancer, causing up to 690,000 annual deaths worldwide.Citation9 Only 25% of CRC cases have a family history; the remaining 75% of affected individuals are not hereditary and occur spontaneously. K. pneumoniae is an etiological pathogen of pyogenic liver abscess (PLA). The association between CRC and K. pneumoniae PLA has been demonstrated.Citation10–12 As revealed in an 11-year follow-up study in Taiwan, patients with PLA caused by K. pneumoniae had a significantly greater rate (adjusted hazard ration = 2.68) of subsequent CRC than those with non-K. pneumoniae PLA.Citation10 K. pneumoniae can asymptomatically reside in the gastrointestinal (GI) tract and subsequently spreads to other organs, causing extra-intestinal infections.Citation13 Although Klebsiella spp. are neither prime colonizers of the gut nor oral microbiomes in healthy individuals, the size of their population increases under certain circumstances, including the usage of antibiotics,Citation14 inflammatory bowel diseases,Citation15 and periodontitis.Citation16 Enriched abundances of Klebsiella spp. in the GI tract positively correlated with several chronic disorders, including nonalcoholic fatty liver disease,Citation17 atherosclerotic cardiovascular disease,Citation18 and CRC.Citation19 Although a recent study has demonstrated that an infant isolate K. pneumoniae 51–5 (ST1243) increases colon tumors in ApcMin/+; Il10−/- mice,Citation20 it is still unclear whether K. pneumoniae is considered a pro-carcinogen of CRC.
The GI carriage of CRKP can persist silently for years.Citation21 During colonization, CRKP not only evolves resistance to novel antibiotics but may also interfere with gut homeostasis to predispose its carriers to tumorigenesis. Given that ST11 is a high-risk clone of CRKP in Asia, we examined the link between ST11 K. pneumoniae and CRC in an azoxymethane (AOM) and dextran sodium sulfate (DSS) mouse model. AOM-DSS has been widely used for the induction of CRC in mice.Citation22 After absorption by colon epithelium, AOM chemically introduces O6 methylguanine adducts and causes G→A transition to initiate colorectal tumorigenesis.Citation23 DSS is a sulfated polysaccharide with toxicity to colon epithelium that induces colitis mimicking features of inflammatory bowel disease (IBD).Citation24 The utilization of AOM to mutate DNA followed by several cycles of DSS eliciting inflammation makes AOM-DSS an ideal initiation-promotion model of colitis-associated CRC. In this model, we demonstrated that two representative strains of ST11 K. pneumoniae established prolonged GI colonization, aggravated gut dysbiosis, promoted intratumoral accumulation of tumor-associated macrophages, and consequently exacerbated colorectal tumorigenesis.
Results
Two representative ST11 strains, KPC160111 and KPC160132, established GI colonization and exacerbated colorectal tumorigenesis in an AOM-DSS mouse model
ST11 K. pneumoniae could be phylogenetically divided into sub-lineages based on their capsular (K) loci. We downloaded 857 ST11 genomes (publicly available in GenBank in October 2019) and identified their K-locus (KL) types with Kaptive.Citation25 KL64, KL47, and KL105 constituted the major of ST11, by 35%, 21%, and 12%, respectively (Supplementary Figure S1a). Over 90% of ST11_KL64 and ST11_KL47 K. pneumoniae carried at least one carbapenemase-coding gene, while less than 30% of ST11_KL105 were carbapenemase-positive (Supplemental Figure S1b). Because KL64 and KL47 were the dominant ST11 sub-lineages, we selected KPC160111 (ST11_KL47) and KPC160132 (ST11_KL64), which had been completely sequenced in our previous studies,Citation26,Citation27 as the representative strains of ST11 K. pneumoniae for the subsequent experiments.
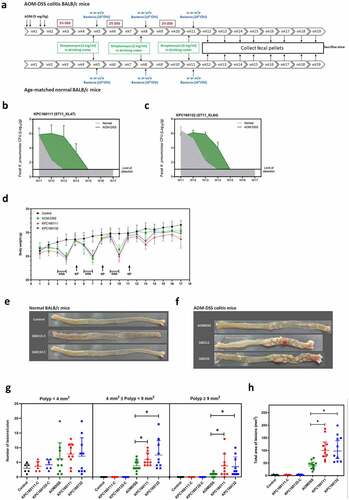
To investigate the role of KPC160111 (ST11_KL47) and KPC160132 (ST11_KL64) in the development of CRC, we established an AOM-DSS mouse model. The schematic timeline is shown in . Groups of normal or AOM-DSS-treated BALB/c mice were orally challenged with 1 × 10⁹ CFU of KPC160111 or KPC160132 at weeks 5, 8, and 11. Fecal CFUs of ST11 K. pneumoniae were determined once a week after the 3rd bacterial inoculation at week 11. Compared to the age-matched normal groups, KPC160111 and KPC160132 maintained higher bacterial loads at the level of 102–105 CFU/g of feces for at least four weeks in the AOM-DSS-treated groups (). This result suggested that the GI-carriage of ST11 K. pneumoniae was significantly potentiated by the AOM-DSS treatment. Given that ST11 K. pneumoniae was nonpathogenic in the GI tract, as expected, the severity of colitis-associated symptoms (loss of body weight, diarrhea, and rectal bleeding) was not significantly exacerbated by KPC160111 or KPC160132 colonization (). All the mice survived the experimental period of 17 weeks. In the end, we sacrificed all the mice for colonic examination. In the absence of AOM-DSS, regardless of KPC160111 or KPC160132 colonization, all the mice of age-matched normal groups produced sporadic polyps in small size (<4 mm2), which were non-neoplastic (). In the AOM-DSS-treated groups, neoplastic polyps (≥4 mm2) were formed and primarily present in the middle to the distal colon (). Although all the AOM-DSS-treated mice developed neoplastic polyps, coadministration with KPC160111 or KPC160132 significantly increased the incidence and multiplicity of large neoplastic polys (≥9 mm2) () and the total area of polyps ().
Figure 1. ST11 K. pneumoniae, KPC160111 (ST11_KL47) and KPC160132 (ST11_KL64) exacerbated colorectal tumorigenesis in an AOM-DSS mouse model. (a) The schematic timeline for the colitis model induced by azoxymethane (AOM) and dextran sodium sulfate (DSS) with and without KPC160111 or KPC160132 co-administration. Carbapenem-resistant K. pneumoniae CFUs in fecal pellets collected from individual mice were determined by counts on imipenem (10 μg/ml)-M9 minimal medium plates. Fecal loads of KPC160111 (b) and KPC160132 (c) in the AOM-DSS colitis mice (green area) are shown in comparison with that in the age-matched normal groups (a gray area). (d) Bodyweight of individual mice from the normal control (black circles), AOM-DSS-alone (green circles), AOM-DSS with KPC160111 (red circles), or KPC160132 (blue circles), was weekly recorded during the experiment period. Representative macroscopic appearance of the colonic lesions developed in the age-matched normal BALB/c mice (e) and in the AOM-DSS-treated mice (f) at week 17. Numbers of the polys (g), categorized into three classes, sporadic polyps (<4 mm2), small neoplastic polyps (4 ~ 9 mm2), and large adenomas (≥9 mm2), and the total area of colon polyps (h) were calculated for individual mice of each group. P values were determined by two‐tailed Student’s t-test between AOM‐DSS alone and AOM-DSS-KPC160111 or AOM-DSS-KPC160132. * P < .05
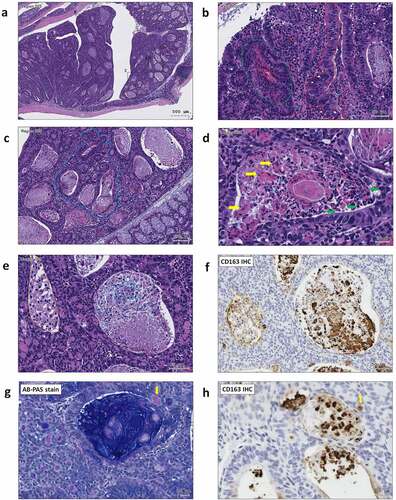
For histopathological examination of polyps, sections of the entire colon Swiss roll were stained with hematoxylin and eosin (H&E) (). Despite the AOM-DSS-KPC160111 or KPC160132 mice produced much more large polyps (≥9 mm2), all the neoplastic polyps (≥4 mm2) which developed throughout the AOM-DSS groups belonged to tubular adenomas. Among the colorectal tumorigenic features analyzed, including the rates of cells positive for Ki-67 or β-catenin, suppression of carbonic anhydrase II, and the loss of goblet cells (), a significantly higher level of nucleo-cytoplasmic distribution of β-catenin was detected in the adenomas produced in the AOM-DSS-ST11 K. pneumoniae mice than that in the AOM-DSS-alone group (). Moreover, the ST11 K. pneumoniae-associated large adenomas (≥9 mm2) () had features showing high-grade dysplasia, including full-thickness pseudostratification (; red dash line), hemorrhage (; green dash line), abnormal cells with enlarged and irregular nuclei (; white arrow), and cribriform (; blue dash line). Besides the cytological and architectural abnormalities, numerous crypts were formed inside the large adenomas which were exclusively presented in the AOM-DSS-ST11 K. pneumoniae groups (). The lumens of these adenomatous crypts were not empty but massively filled with macrophages, which were morphologically transformed to epithelioid cells, foam cells, or giant cells (). Caseous necrosis was found in the center of cell aggregates (; white dash line).
Figure 2. Large tubular adenomas developed in the AOM-DSS mice co-administrated with ST11 K. pneumoniae. Consecutive sections of Swiss colon rolls from individual mice were stained with Hematoxylin and Eosin (H&E), Alcian Blue (AB) Periodic Acid Schiff (PAS) for the detection of goblet cells, and were immunostained with Ki-67, β-catenin, and carbonic anhydrase (CA) II. Representative images of whole-mount sections analyzed by H&E stain (a) and Ki-67 IHC (b) are presented. (c) Representative images, analyzed by Ki-67, β-catenin, CAII IHC and AB-PAS stain, of the large adenomas developed in the AOM-DSS mice with and without KPC160111 or KPC160132 co-administration. (d) Positive rates of cells with positive signals against Ki67, β-catenin, and CA II and goblet cells were quantified by HistoQuest Software at a high-powered field in 5 randomly selected areas in each of the tumors or corresponding control regions. Data are presented as mean ± SD (n = 30 in each group). P values were determined by two‐tailed Student’s t-test between AOM‐DSS alone and AOM-DSS-KPC160111 or AOM-DSS-KPC160132. * P < .05
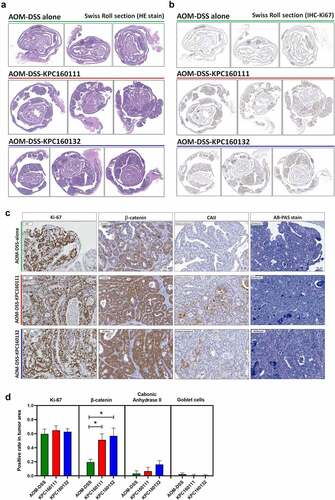
Figure 3. ST11 K. pneumoniae accelerated adenoma progression to high-grade dysplasia in AOM-DSS mice. (a) Representative images showing adenomas with high-grade dysplasia. The regions with histopathological features are framed and enlarged in B-H. (b) An adenoma region with full-thickness pseudostratification (red dash line), hemorrhage (green dash line), abnormal cells with enlarged and irregular nuclei (white arrow), infiltration of lymphocytes (red arrow) and neutrophils (blue arrow); (c) Cribriform (blue dash line) growth pattern of an adenoma; (d) A granuloma-like structure containing epithelioid macrophages (green arrow), giant cells (yellow arrow), and caseous necrosis (white dash line) in an adenomatous crypt; (e) Accumulation of foam cells (orange dash line), neutrophils (blue dash line), and macrophages (white dash line) in adenomatous crypts. CD163 immunostaining is shown in (f). Some of the macrophages with the red PAS positivity (g) were CD163+ (h) (yellow arrow)
ST11 K. pneumoniae promoted the accumulation of CD163+ IL-10+ macrophages in adenomatous crypts
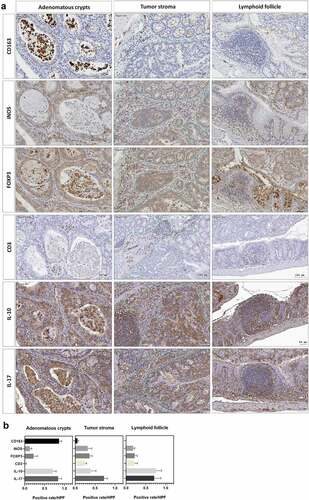
Adenomas are the most common premalignant lesions which will remain stable or progress to high-degree dysplasia and finally develop into carcinomas. During tumorigenesis, the transition of host immunity from immunosurveillance to immunosuppression may facilitate malignancy. Given that K. pneumoniae is known to deploy immune evasion tactics during infections,Citation28 we next investigated whether the deterioration of colorectal tumorigenesis by ST11 K. pneumoniae was associated with immunosuppressive responses. The distribution of several subsets of immune cells was inspected throughout the entire colon Swiss roll sections by immunohistochemistry with specific antibodies. Within the tumors, the abundances of cells positive for CD163, iNOS, FOXP3, IL-10, and IL-17 were significantly increased in the AOM-DSS-ST11 K. pneumoniae mice (). The various transitions of macrophages, including epithelioid cells, giant cells, and foam cells, which accumulated in the lumen of ST11 K. pneumoniae-associated adenomatous crypts, were mostly CD163+ (). Some CD163+ macrophages exhibited PAS positivity (). The production of IL-10 by the CD163+ macrophages () suggested that ST11 K. pneumoniae promoted the accumulation of M2-like tumor-associated macrophages in the lumens of adenomatous crypts. Also, ST11 K. pneumoniae increased the densities of the tumor-infiltrating FoxP3+ cells, which distributed primarily in the stromal region of adenomas (). Besides the clustering of immune cells positive for IL-10 or IL-17 in lymphoid follicles, the IL-10 and IL-17-expressing epithelial cells were also detected within the adenomas of the AOM-DSS-ST11 K. pneumoniae mice ().
Figure 4. Intratumoral distribution of immune cells in AOM-DSS mice with and without ST11 K. pneumoniae co-administration. (a) Consecutive sections of Swiss colon rolls were subjected to H&E stain and were immunostained with specific antibodies against CD163, iNOS, Foxp3, CD3, IL-10, and IL-17. Representative images from the control or the AOM-DSS mice, which were treated alone (middle-left panel) or co-administrated with KPC160111 (middle-right panel) or KPC160132 (right panel), are presented. (b) The rates of cells with positive signals for each of the antibodies were quantified by HistoQuest Software at a high-powered field in 5 randomly selected areas in each of the tumors or corresponding control regions. Data are presented as mean ± SD (n = 30 in each group). P values were determined by two‐tailed Student’s t-test between AOM‐DSS-alone and AOM-DSS-KPC160111 or AOM-DSS-KPC160132. * P < .05
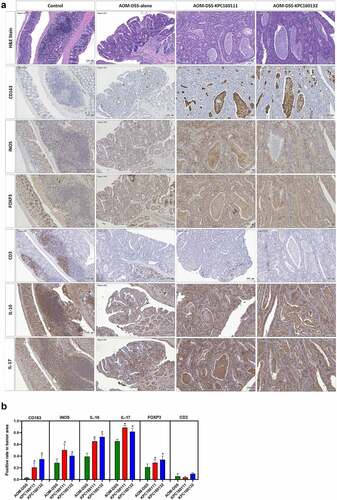
Figure 5. ST11 K. pneumoniae promoted the accumulation of immune cells in different sub-tumoral regions. (a) Representative images showing the distribution of immune cells in three sub-tumoral regions, adenomatous crypts, tumor stroma, and lymphoid follicles, of the adenomas developed in the AOM-DSS mice with ST11 K. pneumoniae co-administration. (b) HistoQuest Software quantified positive rates of CD163+, iNOS+, IL-10+, IL-17+, or Foxp3+ immune cells in each sub-tumoral region high-powered field in 5 randomly selected areas for ≥3 tumors of individual mice (n = 6). Data are presented as mean ± SD
ST11 K. pneumoniae promoted the accumulation of CD163+ macrophages in the peritoneal cavity
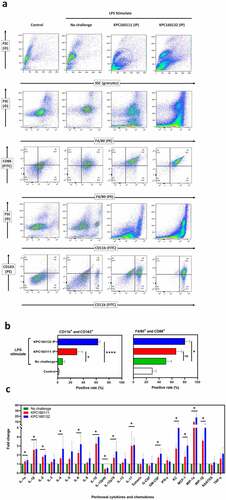
Tumor-associated macrophages (TAMs) are defined as macrophages populated in the tumor microenvironment, which favor tumor development by suppressing anti-tumor immunity. In progressive tumors, TAMs share many characteristics with alternatively activated macrophages (M2). Since ST11 K. pneumoniae might exert its tumor-promoting effects through activating CD163+ TAMs, we examined whether ST11 K. pneumoniae skewed M2 polarization of peritoneal macrophages. Non-lethal E. coli O55:B5 LPS was intraperitoneally (IP) injected into groups of 8-wk old BALB/c male mice to increase peritoneal macrophages. After 16 hours, the LPS-stimulated mice were intraperitoneally (IP) challenged with KPC1601111 or KPC160132 (1 × 10⁹ CFU). At 1.5 hours post-IP, peritoneal cells were isolated and analyzed for the expression of various surface markers. In the LPS-stimulated mice, the percentage of CD163+ myeloid cells (CD11b+) was significantly increased from 8.1 ± 1.8% to 30.0 ± 5.1% and 63.0 ± 1.8% by the IP challenge of KPC160111 and KPC160132, respectively (). Besides, accumulation of CD86+ F4/80+ cells was also noted in the mice with ST11 K. pneumoniae challenge, particularly in the KPC160132 group. This result suggested that ST11 K. pneumoniae promoted not only the skew of M2 polarization but also the increase of M1 macrophages. The ST11 K. pneumoniae-induced immune responses were reflected by the changes in peritoneal levels of cytokines and chemokines. As shown in , the levels of macrophage-recruiting chemokines, including monocyte chemoattractant protein-1 (MCP-1/CCL2), macrophage inflammatory protein 1-alpha (MIP-1α/CCL3), and macrophage inflammatory protein-1β (MIP-1β/CCL4), were significantly elevated by the intraperitoneal challenge of ST11 K. pneumoniae. The increase in cytokines associated with M2 macrophages (IL-4, IL-10, and IL-17) was more significant than that of M1 macrophages (IL-1, INF-γ, and TNF-α).
Figure 6. ST11 K. pneumoniae polarized peritoneal macrophages toward a pro-tumoral M2-like phenotype. (a) Flow cytometry analysis of peritoneal cells, harvested from LPS-stimulated BALB/c mice with and without the post-challenge of 1 × 10⁹ CFU of KPC160111 or KPC160132. Rat anti-mouse fluorescent antibodies, including PE-F4/80, FITC-CD86, FITC-CD11b, and PE-eFluor 610-CD163, were used. Flow cytometry data were analyzed with FlowJO v10.7. (b) The percentages of CD11b+CD163+ and F4/80+ CD86+ peritoneal cells are presented as mean ± SD (n = 6/group). P values were determined by two‐tailed Student’s t-test between LPS-stimulated alone (green bar) and post-challenge with KPC160111 (red bar) or KPC160132 (blue bar). ns: no significance; * P < .05; **** P < .0001. (c) Fold changes of the peritoneal levels of cytokines and chemokines in response to the intraperitoneal challenge of KPC160111 (red bar) or KPC160132 (blue bar) in LPS-stimulated mice (green bar)
ST11 K. pneumoniae skewed M2 polarization of RAW264.7 cells through the activation of the STAT6-KLF4-IL10 pathway
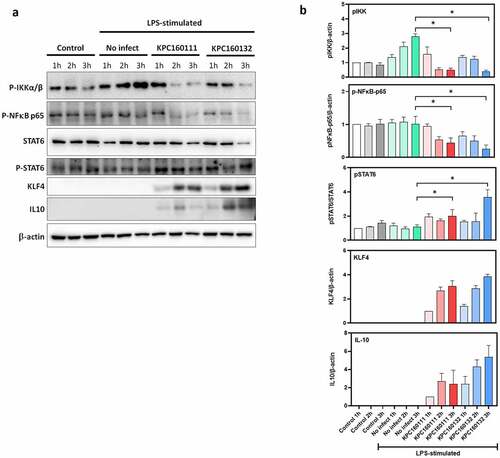
RAW264.7 is a macrophage-like cell line derived from BALB/c mice, which has been used as an appropriate macrophage model. Confluent RAW264.7 cells were stimulated by LPS overnight and then infected with KPC160111 or KPC160132 at a multiplicity of infection (MOI) of 100 for 1–3 hours. The protein levels of phosphor-IKKαβ, phosphor-NF-κB p65, STAT6, phosphor-STAT6, KLF4, and IL10 were examined by Western blotting with specific antibodies. The levels of LPS-stimulated phosphorylation of IKKαβ and NF-κB p65 were decreased by ST11 K. pneumoniae, which reached a statistical significance at 3 h post-infection (). On the other hand, ST11 K. pneumoniae activated the phosphorylation of STAT6 and induced the expression of Krüppel-like factor 4 (KLF4), which upregulated IL-10 expression. This result suggested that ST11 K. pneumoniae polarized RAW264.7 macrophages toward an M2 phenotype via the inhibition of IKK-dependent NF-κB pathway and the upregulation of IL10 expression through the activation of STAT6 and KLF4.
Figure 7. ST11 K. pneumoniae polarized RAW264.7 macrophages toward M2-like signaling. (a) LPS-stimulated RAW264.7 cells were left uninfected or infected with KPC160111 or KPC160132 at an MOI of 100 for 1, 2, and 3 hours. Total cell lysates (50 μg) were used for the Western blotting analysis of phospho-IKKαβ-S176/180, phospho-NF-κB p65, STAT6, phospho-STAT6-Tyr641, KLF4, and IL-10. (b) Relative levels of individual proteins were estimated by measuring band densities with Image J software and normalized with that of β-actin, except phospho-STAT6. Data are shown as fold changes ± SD vs. control group, except KLF-4 and IL-10, shown as fold changes vs. KPC160111-1 h. P values were analyzed with two-tailed Student’s t-test between LPS-stimulated alone (green bar) and infection with KPC160111 (red bar) or KPC160132 (blue bar). * P < .05
ST11 K. pneumoniae exacerbated colitis-associated gut dysbiosis
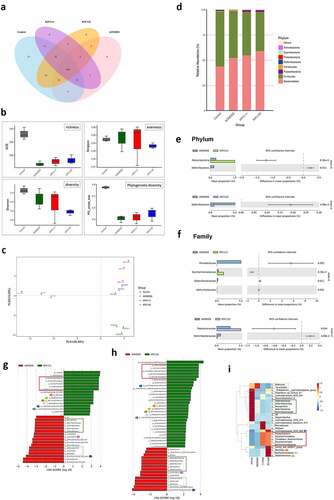
Dysbiosis of the gut microbiome is linked to the development of colorectal cancer. The promotion of colorectal tumorigenesis by ST11 K. pneumoniae might also be attributed to alterations in gut microbial communities. We further investigated changes in fecal microbiomes for three representative mice in each group at the end of the experiment () by 16S microbial sequencing analysis. Based on the 97% identity threshold, observed operational taxonomic units (OTUs) for the normal control, AOM-DSS-alone, AOM-DSS-KPC160111, and AOM-DSS-KPC160132 groups were 354 ± 2, 270 ± 14, 258 ± 11, and 273 ± 14, respectively. A total of 160 OTUs were shared among all groups, as expressed by the Venn diagram (). The α-diversity indices were calculated and compared between groups. Regardless of whether ST11 K. pneumoniae was co-administered, the AOM-DSS treatment reduced the richness and phylogenetic diversity of gut microbiomes (). The phylogenetic distances between groups were examined to assess whether the microbiome composition was significantly affected. The AOM-DSS-alone microbiomes from individual mice were clustered and separated from those with ST11 K. pneumoniae co-administration (red spots: KPC160111; blue spots: KPC160132) along the vertical axis PLS2 of the least-squares discriminant analysis (PLS-DA) (). The relative abundance of the top 10 OTUs per group is expressed by the bar chart showing percentages at the phylum level (). Both ST11 K. pneumoniae strains significantly caused the depletion of the Deferribacteres phylum () and the Defferribacteraceae family () (P < .05, Student’s t-test). To further analyze if any OTUs could be considered bacterial biomarkers associated with ST11 K. pneumoniae, we performed the linear discriminant analysis (LDA) effect size (LEfSe) analyses.Citation29 With the cutoff value of the absolute LDA score (log10) >2.0, 10 OTUs were significantly altered in the AOM-DSS-alone group (Supplementary Figure S2a, b). Under the AOM-DSS setting, KPC160111 and KPC160132 enriched 16 and 30 OTUs (), respectively, which are highlighted on the phylogenetic tree (cladogram) (Supplementary Figure S2 c, d) and the heatmap (). The ST11-associated biomarker OTUs, which were commonly identified in the KPC160111 and KPC160132 groups, included the Candidatus Saccharimonas lineage (from genus to the Patescibacteria superphylum), the Staphylococcus lineage (from genus to the Bacillales order), Ruminiclostridium_6, Lachnospiraceae_UCG_006, and Lachnospiraceae_bacterium_615.
Figure 8. ST11 K. pneumoniae exacerbated the colitis-associated gut dysbiosis. Fecal pellets were collected from individual mice of the control (n = 3), AOM‐DSS-alone (n = 3), AOM-DSS-KPC160111 (n = 3), and AOM-DSS-KPC160132 (n = 3) groups at week 17 and subjected to the 16S microbial sequencing analysis. (a) The number of shared operational taxonomic units (OTUs) between groups is shown in the Venn diagram. (b) The α-diversity between groups is expressed by ACE richness, Simpson’s evenness, Shannon’s diversity, and phylogenetic diversity (PD_whole_tree) index. (c) The β-diversity on unweighted Unifrac distances are presented by partial least-square discriminant analysis (PLS-DA), showing the structure of bacterial communities between individual mice, which were untreated (gray-colored), or treated with AOM-DSS-alone (green-colored), AOM-DSS-KPC160111 (red-colored), or AOM-DSS-KPC160132 (blue-colored). (d) Relative abundance of OTUs per group is expressed by the bar chart showing percentages at the phylum level. The OTUs showing significant differences in relative abundance (%) in microbiomes of AOM-DSS-alone (blue bar) or with KPC160111 (green bar) or KPC160132 (purple bar) co-administration is shown at the phylum level (e) and the family level (f) with 95% confidence intervals and P values. The OTUs that were differently enriched were determined using LDA effect size (LEfSe) analysis. Compared to the AOM-DSS-alone (red bar), the differentially enriched OTUs with LDA score ≥2.0 by KPC160111 or KPC160132 administration (green bar) are shown in (g) and (h), respectively. The biomarker OTUs with LDA ≥2.0 for each of the four groups are highlighted in the heatmap (i)
Discussion
ST11 dominated CRKP isolates in Asia. Besides serving as a trafficker of multi-drug resistance, ST11 K. pneumoniae also possessed an ability to promote colorectal tumorigenesis. As we demonstrated in this study, two representative ST11 strains, KPC160111 (KL47_ST11) and KPC160132 (KL64_ST11), polarized macrophages toward an M2-like phenotype through the activation of the STAT6-KLF4-IL10 axis. Accumulation of M2-like macrophages inside adenomatous crypts created an immunosuppressive microenvironment favoring the growth of colorectal tumors induced in the AOM-DSS mouse model. K. pneumoniae can silently colonize both healthy individuals and ill patients.Citation30 Under normal physiologic conditions, GI colonization with ST11 K. pneumoniae (KPC160111 and KPC160132) did not predispose BALB/c mice to the development of CRC (). However, after the induction of colitis-associated tumorigenesis by AOM-DSS treatment, the growth of colorectal adenomas was significantly promoted by ST11 K. pneumoniae (). This result suggested that ST11 K. pneumoniae was not a carcinogen per se but could act as a promoter for the growth of tumors that are already present. The AOM-DSS-induced condition extended the period of ST11 K. pneumoniae colonization (). The positive effect of inflammation on K. pneumoniae colonization has also been demonstrated previously for KpIA565, a nonpathogenic strain GI-enriched in mice with DSS-induced colitis.Citation31
Inflammation drives gut dysbiosis, compromising colonization resistance against K. pneumoniae. The AOM-DSS treatment altered the composition of the GI microbiome in male BALB/c mice (Supplementary Figure S2a, b). Several of the AOM-DSS-associated biomarker OTUs were also demonstrated in other studies, including Bacteroides,Citation32 Muribaculaceae,Citation33 Defluviitaleaceae-UCG011, and Christensenellaceae_R7-group.Citation34 Under the inflammatory circumstances, ST11 K. pneumoniae found a niche to colonize and induced further changes of the microbiome. The Candidatus Saccharimonas lineage (from genus to phylum) and the Staphylococcus lineage (from genus to order) were significantly enriched by ST11 K. pneumoniae ( and Supplementary Figure S2c, d). As formerly named Candidate division TM7, Candidatus Saccharimonas belongs to the newly defined superphylum Patescibacteria. TM7 prevails in natural habitatsCitation35 and the human oral cavity.Citation36 Several human diseases, such as periodontitis and inflammatory bowel disease, have been demonstrated to correlate with TM7 enrichment positively (31). Staphylococcus spp. are frequent commensals of the nares and skin and are considered transient colonizers in healthy individuals’ oral and GI tract. Increased abundance of Staphylococcus was detected in the oral and gut microbiota in patients with periodontitisCitation37 and celiac disease,Citation38 respectively. On the other hand, ST11 K. pneumoniae reduced the population size of the Mucispirillum lineage (from genus to phylum) and the Mollicutes lineage (from order to phylum) (). Mollicutes correlated with increased energy harvest efficiency in lean individualsCitation39 and had relatively lower abundances in the gut microbiomes of CRC patients.Citation40 Mucispirillum schaedleri is a core member of Mucispirillum colonizing the mucus layer of intestines,Citation41 which has been demonstrated for protecting C57BL/6 J mice against Salmonella-induced colitis.Citation42 In our model, the AOM-DSS-driven reduction of Mucispirillum spp. was deteriorated by ST11 K. pneumoniae colonization. Given that CRKP could invade the mucus layer,Citation43 ST11 K. pneumoniae could gain a foothold in the colon mucosa by outcompeting the resident Mucispirillum spp.
CRC development largely attributes to environmental factors, including the complex interaction between GI microbiota and host immunity.Citation44 The most significant feature that linked the colorectal tumors to ST11 K. pneumoniae was the formation of adenomatous crypts (). The crypt-inside cells were primarily CD163+ macrophages. Through the production of IL-10, the CD163+ macrophages induced immune suppression in the surroundings of adenomatous crypts, which favored tumor growth and progression to high-grade dysplasia.Citation45 K. pneumoniae is known as a master tactician in immune evasion through the induction of high-level IL-10.Citation46 The requirement of IL-10 for K. pneumoniae infections has been previously demonstrated that the administration of anti-IL-10 antibodies improved the survival of mice with K. pneumoniae-triggered pneumonia.Citation47 Inversely, the overexpression of IL-10 accelerated the mortality of infected mice.Citation48 IL-10 has a two-way immunomodulatory effect. In addition to anti-inflammation, IL-10 can also repress immune effector cells to create an immunosuppressive microenvironment. With the loss of anti-inflammatory control, mice deficient in IL-10 overproduce Th1 cytokines,Citation49 develop spontaneous colitis,Citation50 and are prone to produce intestinal tumors in the ApcMin genetic background.Citation51 In ApcMin/+; Il10−/− mice, K. pneumoniae 51–5 increased colonic tumors with significant infiltration of CD3+ cells in lamina propria.Citation20 Involvement of T cell responses, which was derepressed by the deletion of IL-10, was suggested in the K. pneumoniae 51-5-promoted colon tumorigenesis. Although the ApcMin/+; Il10−/− mice have been widely used in the colitis-associated CRC study, it is difficult for us to use this model to investigate the two-way roles of IL-10. In wild-type BALB/c mice, the presence of IL-10 inhibited inflammation and Th1 responses. Therefore, we did not observe an increase in the number of CD3+ cells in response to ST11 K. pneumoniae (), even though this model allowed us to investigate the two-way roles of IL-10 in the CRC progression.
K. pneumoniae is a stealth pathogen exploiting the anti-inflammatory properties of IL-10 to attenuate host immunity. Nevertheless, our knowledge regarding how it interacts with immune cells to stimulate the production of IL-10 is still restricted. IL-10 is a pleiotropic cytokine produced by myeloid and lymphoid cells.Citation52 In an ex vivo porcine lung perfusion model, K. pneumoniae Kp52145 skewed alveolar macrophages toward an M2-like state with CD163 expression and IL-10 production.Citation53 In line with this, we found that both KPC160132 (KL64) and KPC160111 (KL47) elicited the enrichment of CD11b+ CD163+ macrophages in the peritoneal cavity, and the peritoneal level of IL-10 was simultaneously elevated (). The signaling molecules triggered by ST11 K. pneumoniae were further investigated in the RAW264.7 macrophages (). Upon exposure to KPC160111 or KPC160132, the level of LPS-induced phosphorylation of the IκB kinase (IKK) α/β was reduced, and therefore the activation of the main M1 transcription factor, NF-κB, was inhibited. In contrast, the phosphorylation of STAT6 and the expression of KLF4 were simultaneously enhanced by ST11 K. pneumoniae. STAT6 is the key transcriptional activator for M2 polarization,Citation54 and KLF4 cooperates with STAT6 to induce the M2 genetic program.Citation55 The increased production of IL-10, regulated by KLF4,Citation56 acted in an autocrine manner to reinforce the M2 phenotype of RAW264.7 macrophages. Collectively, these results suggested that ST11 K. pneumoniae polarized macrophages toward a pro-tumoral M2-like phenotype through the inhibition of IKK-NFκB and the activation of STAT6-KLF4-IL-10 axis.
Unlike the crypts under the inflammatory condition which are filled with neutrophils,Citation57 the ST11 K. pneumoniae-triggered adenomatous crypts were filled the aggregates of macrophages, which formed a structure similar to a granuloma. In response to ST11 K. pneumoniae, the crypt-inside macrophages underwent a series of morphological changes, including epithelioid cell differentiation, fusion into multinucleated giant cells, and transformation to foam cells (). Unlike the granulomas of Crohn’s disease and intestinal tuberculosis, which are mainly composed of inflammatory M1 macrophages,Citation58 anti-inflammatory M2-like macrophages constituted the core of ST11-K. pneumoniae-associated granulomas (). The production of IL-10 by accumulating M2-like macrophages contributed to developing an immunosuppressive microenvironment favoring tumor growth. Moreover, cells in the adenomatous epithelium also increasingly produced IL-10 and IL-17, which could simultaneously act on the crypt-inside macrophages to reinforce the pro-tumoral M2 phenotype.Citation59 The schematic representation of a hypothesized process of ST11 K. pneumoniae-promoted tumorigenesis is shown in .
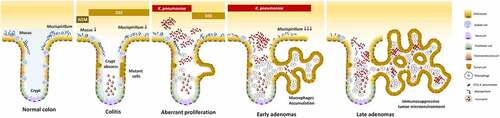
Figure 9. Schematic representation of a hypothesized process of ST11 K. pneumoniae-promoted tumorigenesis in an AOM-DSS-induced colitis model. Accumulation of the AOM-induced DNA mutations caused the transition of a small portion of colonocytes into the tumorigenic state. Recurrent episodes of DSS-generated inflammation reduced the production of mucus and the abundance of mucus-associated Mucispirillum, and elicited crypt abscesses (neutrophils accumulation in the lumen of crypt). Under this circumstances, ST11 K. pneumoniae expansion promoted the accumulation of CD163+ macrophages inside the crypt lumen. Through the massive production of IL-10 by these macrophages, the surroundings of the crypts became immunosuppressive areas, which help the evasion of ST11 K. pneumoniae from the host immunity. On the other hand, it allowed the aberrant growth of tumor cells, contributing to the early-to-late transition of colorectal adenomas
K. pneumoniae colonizes the GI tract; however, it is not considered an enteropathogen. Most people who carry K. pneumoniae experience no symptoms of colitis. Instead of launching a lethal attack to destroy the gut mucosa, ST11 K. pneumoniae creates an immunosuppressive niche favoring its extended stay in the GI tract. The polarization of M2 macrophages by ST11 K. pneumoniae is harmless in the normal colon, but if it occurs in the tissues that have already become cancerous, it subverts the anti-tumor immunity toward a tolerogenic milieu favoring tumor growth and progression. Given that K. pneumoniae Kp52145, a ST66 strain, could activate the M1-to-M2 shift of macrophages,Citation53 we considered that neither the M2-skewing ability nor the tumor-promoting effect was restricted to ST11 lineage. Further studies are needed to gain a comprehensive understanding of the pro-carcinogenic potential of different lineages of K. pneumoniae and the mechanisms through which they promote colorectal tumorigenesis.
Materials and methods
Bacterial strains
ST11 K. pneumoniae, KPC160111 and KPC160132, were isolated in our previous studies.Citation26,Citation27,Citation60 The genome of these two strains was fully sequenced and deposited in GenBank with the accession numbers CP029689.1 and CP040023.1, respectively. KPC160111, which was isolated from an 81-yr female patient who suffered from urinary tract infection in 2014, belonged to ST11_KL47 and carried six plasmids, including two distinct blaKPC-2 and blaOXA-48 plasmids. KPC160132, isolated from the fecal carriage of a long-term hospitalized patient in 2015, was classified ST11_KL64 with the carriage of blaOXA-48 on its chromosome. Mid-log phase cultures of K. pneumoniae KPC160111 or KPC160132 were maintained in Luria-Bertani (LB) broth, with a determined density of CFU/ml were used for subsequent experiments. The in vitro growth of these two ST11 strains was unaffected by 0.2–5% DSS, which was the drug added in drinking water in the mouse experiments (Supplementary Figure S3a-c).
The AOM-DSS mouse model
Male BALB/c mice were purchased from BioLasco (Taiwan Co., Ltd) at the age of 7-wk-old, allowed to acclimatize in the animal house for one week, and randomized into six groups. Mice in groups 1 through 3 were given an intraperitoneal injection of 5 mg of azoxymethane (AOM; Wako, Japan) kg body weight on days 1, 4, 8, and 11. Four days after the 4th injection of AOM, the mice were subjected to 3 rounds of dextran sodium sulfate (DSS) (MW: 36000–50000, MP Biomedicals, USA) treatment. Each DSS round consisted of administering 2% (w/v) DSS in drinking water for 7 days, followed by a 14-day recovery period with regular water. Mice in groups 4 through 6 were untreated with AOM-DSS, serving as the age-matched normal control. At weeks 5, 8, and 11, mice in groups 2, 5, and 3, 6, were orally inoculated with 1 × 10⁹ CFU of mid-log-phase KPC160111 and KPC160132, respectively. Before each challenge of K. pneumoniae, mice drank water supplemented with streptomycin (2 mg/ml) for 3 consecutive days. Other mice that were not challenged with K. pneumoniae, including the control and AOM-DSS-alone groups, also drank streptomycin-water for three consecutive days at the corresponding time points. Fecal pellets were collected from individual mice to determine K. pneumoniae CFU on imipenem (10 μg/ml)-M9 minimal media plates at indicative time points. At week 17, all animals were sacrificed by isoflurane overdose. For each of the mice, the large bowel, from ileocecal junction to the anal verge, was excised and flushed with 5% glycerol in sterile saline, measured length, and longitudinally cut open. The number and size of colonic polyps were examined under a stereomicroscope by two investigators. The size of the polyp was calculated as length × width, which was measured with a micro caliper. Based on the size, polyps were categorized into three classes, sporadic (<4 mm2), small (4 ~ 9 mm2), and large (≥9 mm2).
Colon histopathology and immunochemistry analysis
Colons were prepared as a Swiss roll, fixed in 10% of formalin, and processed for paraffin embedding. The hematoxylin and eosin (H&E) sections were examined by experienced pathologists based on the criteria described.Citation61 For immunohistochemistry analysis, consecutive sections were de-waxed with xylene, rehydrated in graded alcohol, antigen-retrieval with 0.01 M of citric buffer (pH6.0), and hybridized with specific antibodies against Ki-67 (Abcam #ab15880, rabbit polyclonal, dilution 1:150), β-catenin (CST #8480, rabbit monoclonal, dilution 1:100), carbonic anhydrase II (Abcam #ab124687, rabbit monoclonal, dilution 1:100), CD163 (Abcam #ab182422, rabbit monoclonal, dilution 1:100), iNOS (Abcam #ab15323, rabbit polyclonal, dilution 1:150), Foxp3 (BioLegend clone poly6238, rabbit monoclonal, dilution 1:100), CD3 (Abcam #ab16669, rabbit monoclonal, dilution 1:100), IL-10 (ABclonal #A2171, rabbit polyclonal, dilution 1:150), and IL-17 (Abcam #ab79056, rabbit polyclonal, dilution 1:150). The images of whole Swiss roll colon sections were scanned and acquired using the TissueFAXS plus system (TissueGnostics GmbH). Positive rates of the cells showing positive signals against a specific antibody in the indicated regions were quantified with the HistoQuest Software provided by TissueGnostics GmbH at a high-powered field in 5 randomly selected areas in each of the tumors or corresponding control regions.
Flow cytometry analysis of peritoneal cells
Groups of 8-wk-old male BALB/c mice were intraperitoneally injected with 200 ul PBS containing with and without LPS (1 mg/Kg of weight; E. coli O55:B5; Sigma). After 16 hours, the LPS-stimulated mice were intraperitoneally challenged with 1 × 10⁹ CFU of K. pneumoniae KPC160111 or KPC160132. Peritoneal cells were harvested by injecting 5 mL of PBS at 1.5 h post-bacterial challenge, and the supernatants were collected for cytokine/chemokine analysis. After RBC lysis and washing, peritoneal cells were treated with Mouse Seroblock FcR (Bio-Rad Laboratories # BUF041) for 20 min at 4°C to block the Fc receptors and then incubated with rat anti-mouse fluorescent antibodies to comparatively analyze the distribution of the myeloid cells in response to K. pneumoniae challenge. The antibodies used were PE-conjugated anti-F4/80 (eBioscience #12-4801-82), FITC-conjugated anti-CD11b (eBioscience #11-0112-82), FITC-conjugated anti-CD86 (eBioscience #11-0862-82), and PE-eFluor 610-conjugated anti-CD163 (eBioscience #61-1631-82). After incubation at 4°C for 1 h, cells were washed and analyzed with a BD FACS Canto II cytometer (Becton Dickinson). Flow cytometry data were analyzed with FlowJO v10.7 (Becton Dickinson).
Cytokine/chemokine analysis of peritoneal fluids
The levels of interleukin (IL)-1α, IL-1β, IL-2, IL-3, IL-4, IL-5, IL-6, IL-9, IL-10, IL-12 (p40), IL-12 (p70), IL-13, IL-17, eotaxin, G-CSF, GM-CSF, IFN-γ, KC, MCP-1, MIP-1α, MIP-1β, RANTES, and TNF-α in the peritoneal fluids, collected from the control mice and the LPS-stimulated mice, which were post-challenged with and without KPC160111 or KPC160132, were quantified using the Bio-Plex Pro Mouse Cytokine 23-Plex Immunoassay (Bio-Rad; Model: M60009RDPD) according to the instruction manual.
Western blotting analysis
RAW 264.7 murine macrophage (BCRC #60001, Taiwan) cells were maintained in 5% CO2 at 37°C in Dulbecco’s Modified Eagle’s Medium with 10% fetal bovine serum. After seeding to 6-well culture plates at a density of 2 × 10⁶ cells/well, RAW264.7 cells were stimulated with 1 μg/ml LPS (E. coli O55:B5; Sigma #L2880) for 16 hours. The LPS-stimulated RAW.264.7 cells were harvested after transient infections with KPC160111 or KPC160132 at an MOI of 100 for 1, 2, and 3 hours. At least 107 cells were collected and lysed with 1 ml of lysis buffer (PBS, 1% Triton X-100, protease, and phosphatase inhibitors). Protein concentrations of the total lysates were measured with Pierce™ BCA Protein Assay Kit (Thermo Scientific™ #23225). Fifty micrograms of total proteins were separated over 10–15% SDS-PAGE gels and transferred onto Immun-Blot® PVDF Membranes (Bio-Rad #1620177). After blocking with 5% nonfat dry milk (or 3% BSA for phospho-antibodies) in TBST, the blots were washed and hybridized at 4°C overnight with specific antibodies at 1:1000 dilution, including STAT6 (Cell Signaling Technology #5397), phospho-STAT6-Tyr641 (Cell Signaling Technology #56554), phospho-IKKαβ-S176/180 (ABclonal # AP0546), phospho-NF-κB p65 (Cell Signaling Technology #3033), KLF4 (ABclonal # A6640), IL-10 (ABclonal # A2171), and β-actin (Novus # NB600-501). Relative levels of individual proteins were estimated by measuring band densities with Image J software and normalized with that of β-actin, except phospho-STAT6. Data are shown as fold changes ± SD vs. control group, except KLF-4 and IL-10, shown as fold changes vs. KPC160111-1 h. Two-tailed P values were analyzed with Student’s t-test between LPS-stimulated alone and infection with ST11 K. pneumoniae. * P < .05
16S rRNA amplicon sequencing and analysis of fecal microbiome
Total genomic DNA was extracted from fecal samples collected from individual mice retrieved at the end of the experiment, using QIAamp DNA Stool Mini Kit (QIAGEN) following the manufacturer’s protocol. The V3-V4 hypervariable region of 16S rDNA was amplified using the bacterial-specific forward (5ʹ TCG TCG GCA GCG TCA GAT GTG TAT AAG AGA CAG CCT ACG GGN GGC WGC AG 3ʹ) and reverse (5ʹ GTC TCG TGG GCT CGG AGA TGT GTA TAA GAG ACA GGA CTA CHV GGG TAT CTA ATC C 3ʹ) primer set using the 16S Metagenomic Sequencing Library Preparation Kit (Illumina). Index adapters were added to the amplicons with the Nextera XT Index Kit, and the constructed libraries were subjected to 2 × 300 bp paired-end sequencing runs on the Illumina MiSeq platform. Amplification and sequencing services of the 16S rRNA gene were provided by Welgene Biotech Co., Ltd. (Taiwan). Clean reads were obtained after raw FASTQ reads filtered with Bowtie 2Citation62 and the removal of PhiX control by Trimmomatic.Citation63 Qualified sequences (effective tags) were clustered into de novo operational taxonomic units (OTUs) by >97% similarity using USEARCH.Citation64 The OTU sequences were annotated using the SILVA reference database (SSURef NR 99 release 123).Citation65 Sequences that could not be assigned to a specific taxonomy level were labeled as unclassified. Unweighted Pair-group Method with Arithmetic Means (UPGMA) Clustering was performed as a hierarchical clustering method to interpret the distance matrix using average linkage and was conducted by QIIME.Citation66 The α-diversity indices, including Chao, Ace, Shannon, and observed OTUs, were calculated using the MOTHUR. The β-diversity on weighted and unweighted Unifrac distances were calculated by QIIME.Citation67 Cluster analysis on the linear model, principal component analysis (PCA), and the nonlinear model, NMDS, was performed using the FactoMineR and ggplot2 packages in R software. Partial least-square discriminant analysis (PLS-DA), implemented in MetaboAnalyst, was also performed.Citation68 The linear discriminant analysis (LDA) effect size (LEfSe) analyses were conducted by LEfSe software, with the cutoff value as the absolute LDA score (log10) ≥2.0.Citation29 Metastats were calculated by R software. Statistical significance between groups was examined using permutational multivariate analysis of variance based on the observed Unifrac distance matrix relative to 10,000 randomly rearranged distance matrices.Citation69
Statistical analysis
Statistical analyses were performed using GraphPad Prism 9.0 (GraphPad Software Inc.). Comparison between two groups indicated was conducted by Student’s t-test. A significant difference between groups was considered when two-tailed P < .05.
Ethics statement
All animal experiments were conducted following the Guide for the Care and Use of Laboratory Animals of the National Research Council Committee.Citation70 The protocols of animal experiments were approved by the Institutional Animal Care and Use Committee of Chung Shan Medical University (permit no. 2172 and 2315).
Supplemental Material
Download PDF (1.2 MB)Acknowledgments
We thank RaPID Science co. ltd, Taiwan for providing IHC technical support and the Instrument Center of Chung Shan Medical University, which is supported by National Science Council, Ministry of Education, and Chung Shan Medical University, for the performance of Flow Cytometry Cell Sorter and TissueFAXS™ Cytometry.
Disclosure statement
The author(s) declare that they have no competing interests.
Data availability
Metagenome sequence information is available at NCBI under the Sequence Read Archive (SRA) database with accession no PRJNA728507. All data generated or analyzed during this study are included in this article. Any additional information will be made available from the corresponding author on reasonable request.
Supplementary material
Supplemental data for this article can be accessed on the publisher’s website.
Additional information
Funding
References
- Pendleton JN, Gorman SP, Gilmore BF. Clinical relevance of the ESKAPE pathogens. Expert Rev Anti Infect Ther. 2013;11(3):297–22. doi:10.1586/eri.13.12. PMID: 23458769.
- Munoz-Price LS, Poirel L, Bonomo RA, Schwaber MJ, Daikos GL, Cormican M, Cornaglia G, Garau J, Gniadkowski M, Hayden MK, et al. Clinical epidemiology of the global expansion of Klebsiella pneumoniae carbapenemases. Lancet Infect Dis. 2013;13(9):785–796. doi:10.1016/s1473-3099(13)70190-7. PMID: 4673667.
- Chiu SK, Wu TL, Chuang YC, Lin JC, Fung CP, Lu PL, Wang JT, Wang LS, Siu LK, Yeh KM. National surveillance study on carbapenem non-susceptible Klebsiella pneumoniae in Taiwan: the emergence and rapid dissemination of KPC-2 carbapenemase. PLoS One. 2013;8(7):e69428. doi:10.1371/journal.pone.0069428. PMID: 3722148.
- Fu P, Tang Y, Li G, Yu L, Wang Y, Jiang X. Pandemic spread of blaKPC-2 among Klebsiella pneumoniae ST11 in China is associated with horizontal transfer mediated by IncFII-like plasmids. Int J Antimicrob Agents. 2019;54(2):117–124. doi:10.1016/j.ijantimicag.2019.03.014. PMID: 30885806.
- Liu L, Feng Y, Tang G, Lin J, Huang W, Qiao F, Zong Z. Carbapenem-resistant Isolates of the Klebsiella pneumoniae complex in Western China: the common ST11 and the surprising Hospital-specific types. Clin Infect Dis. 2018;67(suppl_2):S263–S5. doi:10.1093/cid/ciy662. PMID: 30423053.
- Qi Y, Wei Z, Ji S, Du X, Shen P, Yu Y. ST11, the dominant clone of KPC-producing Klebsiella pneumoniae in China. J Antimicrob Chemother. 2011;66(2):307–312. doi:10.1093/jac/dkq431. PMID: 21131324.
- Gu D, Dong N, Zheng Z, Lin D, Huang M, Wang L, Chan EW-C, Shu L, Yu J, Zhang R, et al. A fatal outbreak of ST11 carbapenem-resistant hypervirulent Klebsiella pneumoniae in a Chinese hospital: a molecular epidemiological study. Lancet Infect Dis. 2018;18(1):37–46. doi:10.1016/S1473-3099(17)30489-9. PMID: 28864030.
- Yang Q, Jia X, Zhou M, Zhang H, Yang W, Kudinha T, Xu Y. Emergence of ST11-K47 and ST11-K64 hypervirulent carbapenem-resistant Klebsiella pneumoniae in bacterial liver abscesses from China: a molecular, biological, and epidemiological study. Emerg Microbes Infect. 2020;9(1):320–331. doi:10.1080/22221751.2020.1721334. PMID: 32037975.
- Sung H, Ferlay J, Siegel RL, Laversanne M, Soerjomataram I, Jemal A, Bray F. Global cancer statistics 2020: GLOBOCAN estimates of incidence and mortality worldwide for 36 cancers in 185 countries. CA Cancer J Clin. 2021;71(3):209–249. doi:10.3322/caac.21660. PMID: 33538338.
- Huang WK, Chang JWC, See LC, Tu HT, Chen JS, Liaw CC, Lin YC, Yang TS. Higher rate of colorectal cancer among patients with pyogenic liver abscess with Klebsiella pneumoniae than those without: an 11-year follow-up study. Colorectal Dis. 2012;14(12):e794–e801. doi:10.1111/j.1463-1318.2012.03174.x. PMID: 22776247.
- Qu K, Liu C, Wang ZX, Tian F, Wei JC, Tai MH, Zhou L, Meng FD, Wang RT, Xu XS. Pyogenic liver abscesses associated with nonmetastatic colorectal cancers: an increasing problem in Eastern Asia. World J Gastroenterol. 2012;18(23):2948–2955. doi:10.3748/wjg.v18.i23.2948. PMID: 3380322.
- Kim HY, Kim CW, Kim DR, Cho YW, Cho J-Y, Kim WJ, Choi HG. Recurrent pyogenic liver abscess as a presenting manifestation of colorectal cancer. Korean J Intern Med. 2017;32(1):174–177. doi:10.3904/kjim.2015.301. PMID: 26842103.
- Gorrie CL, Mirceta M, Wick RR, Edwards DJ, Thomson NR, Strugnell RA, Pratt NF, Garlick JS, Watson KM, Pilcher DV, et al. Gastrointestinal carriage is a major reservoir of Klebsiella pneumoniae infection in intensive care patients. Clin Infect Dis. 2017;65(2):208–215. doi:10.1093/cid/cix270. PMID: 28369261.
- Taur Y, Pamer EG. The intestinal microbiota and susceptibility to infection in immunocompromised patients. Curr Opin Infect Dis. 2013;26(4):332–337. doi:10.1097/QCO.0b013e3283630dd3. PMID: 23806896.
- Rashid T, Ebringer A, Wilson C. The role of Klebsiella in Crohn’s disease with a potential for the use of antimicrobial measures. Int J Rheumatol. 2013;2013:610393. doi:10.1155/2013/610393. PMID: 24223596.
- Gonçalves MO, Coutinho-Filho WP, Pimenta FP, Pereira GA, Pereira JAA, Mattos-Guaraldi AL, Hirata JR. Periodontal disease as reservoir for multi-resistant and hydrolytic enterobacterial species. Lett Appl Microbiol. 2007;44(5):488–494. doi:10.1111/j.1472-765X.2007.02111.x. PMID: 17451514.
- Yuan J, Chen C, Cui J, Lu J, Yan C, Wei X, Zhao X, Li N, Li S, Xue G, et al. Fatty liver disease caused by high-alcohol-producing Klebsiella pneumoniae. Cell Metab. 2019;30(4):675–88.e7. doi:10.1016/j.cmet.2019.08.018. PMID: 31543403.
- Jie Z, Xia H, Zhong SL, Feng Q, Li S, Liang S, Zhong H, Liu Z, Gao Y, Zhao H, et al. The gut microbiome in atherosclerotic cardiovascular disease. Nat Commun. 2017;8(1):845. doi:10.1038/s41467-017-00900-1. PMID: 29018189.
- Wang T, Cai G, Qiu Y, Fei N, Zhang M, Pang X, Jia W, Cai S, Zhao L. Structural segregation of gut microbiota between colorectal cancer patients and healthy volunteers. ISME J. 2012;6(2):320–329. doi:10.1038/ismej.2011.109. PMID: 21850056.
- Pope JL, Yang Y, Newsome RC, Sun W, Sun X, Ukhanova M, Neu J, Issa J-P, Mai V, Jobin C. Microbial colonization coordinates the pathogenesis of a Klebsiella pneumoniae infant isolate. Sci Rep. 2019;9(1):3380. doi:10.1038/s41598-019-39887-8. PMID: 30833613.
- Martin RM, Bachman MA. Colonization, infection, and the accessory genome of Klebsiella pneumoniae. Front Cell Infect Microbiol. 2018;8:4. doi:10.3389/fcimb.2018.00004. PMID: 29404282.
- Parang B, Barrett CW, Williams CS. AOM/DSS model of colitis-associated cancer. Methods Mol Biol. 2016;1422:297–307. doi:10.1007/978-1-4939-3603-8_26. PMID: 27246042.
- Sohn OS, Fiala ES, Requeijo SP, Weisburger JH, Gonzalez FJ. Differential effects of CYP2E1 status on the metabolic activation of the colon carcinogens azoxymethane and methylazoxymethanol. Cancer Res. 2001;61:8435–8440. PMID: 11731424.
- Okayasu I, Hatakeyama S, Yamada M, Ohkusa T, Inagaki Y, Nakaya R. A novel method in the induction of reliable experimental acute and chronic ulcerative colitis in mice. Gastroenterology. 1990;98(3):694–702. doi:10.1016/0016-5085(90)90290-h. PMID: 1688816.
- Wick RR, Heinz E, Holt KE, Wyres KL. Kaptive web: user-friendly capsule and lipopolysaccharide serotype prediction for Klebsiella genomes. J Clin Microbiol. 2018;56(6). doi:10.1128/jcm.00197-18. PMID: 29618504.
- Lu MC, Chen YT, Tang HL, Liu YY, Chen BH, Wang YW, Chen YS, Teng RH, Hong YP, Chiou CS, et al. Transmission and evolution of OXA-48-producing Klebsiella pneumoniae ST11 in a single hospital in Taiwan. J Antimicrob Chemother. 2019;75:318–326. doi:10.1093/jac/dkz431. PMID: 31665400.
- Wang YC, Tang HL, Liao YC, Chiou CS, Chen YT, Chiang MK, Lu MC, Lai YC. Cocarriage of distinct bla (KPC-2) and bla (OXA-48) plasmids in a single sequence type 11 Carbapenem-Resistant Klebsiella pneumoniae isolate. Antimicrob Agents Chemother. 2019;63(6):e02282–18. doi:10.1128/aac.02282-18. PMID: 30962338.
- Bengoechea JA, Sa Pessoa J. Klebsiella pneumoniae infection biology: living to counteract host defences. FEMS Microbiol Rev. 2019;43:123–144. doi:10.1093/femsre/fuy043. PMID: 30452654.
- Segata N, Izard J, Waldron L, Gevers D, Miropolsky L, Garrett WS, Huttenhower C. Metagenomic biomarker discovery and explanation. Genome Biol. 2011;12(6):R60. doi:10.1186/gb-2011-12-6-r60. PMID: 21702898.
- Viau RA, Hujer AM, Marshall SH, Perez F, Hujer KM, Briceño DF, Dul M, Jacobs MR, Grossberg R, Toltzis P, et al. “Silent” dissemination of Klebsiella pneumoniae isolates bearing K. pneumoniae carbapenemase in a long-term care facility for children and young adults in Northeast Ohio. Clin Infect Dis. 2012;54(9):1314–1321. doi:10.1093/cid/cis036. PMID: 22492318.
- Lau HY, Huffnagle GB, Moore TA. Host and microbiota factors that control Klebsiella pneumoniae mucosal colonization in mice. Microbes Infect. 2008;10(12–13):1283–1290. doi:10.1016/j.micinf.2008.07.040. PMID: 18762269.
- Wang Q, Wang K, Wu W, Lv L, Bian X, Yang L, Wang Q, Li Y, Ye J, Fang D, et al. Administration of Bifidobacterium bifidum CGMCC 15068 modulates gut microbiota and metabolome in azoxymethane (AOM)/dextran sulphate sodium (DSS)-induced colitis-associated colon cancer (CAC) in mice. Appl Microbiol Biotechnol. 2020;104(13):5915–5928. doi:10.1007/s00253-020-10621-z. PMID: 32367312.
- Zhu HC, Jia XK, Fan Y, Xu SH, Li XY, Huang MQ, Lan ML, Xu W, Wu -S-S. Alisol B 23-acetate ameliorates Azoxymethane/Dextran sodium sulfate-induced male murine colitis-associated colorectal cancer via modulating the composition of gut microbiota and improving intestinal barrier. Front Cell Infect Microbiol. 2021;11:640225. doi:10.3389/fcimb.2021.640225. PMID: 33996624.
- Silvestri C, Pagano E, Lacroix S, Venneri T, Cristiano C, Calignano A, Parisi OA, Izzo AA, Di Marzo V, Fish Oil BF. Cannabidiol and the gut microbiota: an investigation in a murine model of colitis. Front Pharmacol. 2020;11:585096. doi:10.3389/fphar.2020.585096. PMID: 33162890.
- Hugenholtz P, Tyson GW, Webb RI, Wagner AM, Blackall LL. Investigation of candidate division TM7, a recently recognized major lineage of the domain bacteria with no known pure-culture representatives. Appl Environ Microbiol. 2001;67(1):411–419. doi:10.1128/AEM.67.1.411-419.2001. PMID: 11133473.
- Brinig MM, Lepp PW, Ouverney CC, Armitage GC, Relman DA. Prevalence of bacteria of division TM7 in human subgingival plaque and their association with disease. Appl Environ Microbiol. 2003;69(3):1687–1694. doi:10.1128/AEM.69.3.1687-1694.2003. PMID: 12620860.
- Cuesta AI, Jewtuchowicz V, Brusca MI, Nastri ML, Rosa AC. Prevalence of Staphylococcus spp and Candida spp in the oral cavity and periodontal pockets of periodontal disease patients. Acta Odontol Latinoam. 2010;23(1):20–26. PMID: 20645638.
- Sánchez E, Ribes-Koninckx C, Calabuig M, Sanz Y. Intestinal Staphylococcus spp. and virulent features associated with coeliac disease. J Clin Pathol. 2012;65(9):830–834. doi:10.1136/jclinpath-2012-200759. PMID: 22718843.
- Turnbaugh PJ, Ley RE, Mahowald MA, Magrini V, Mardis ER, Gordon JI. An obesity-associated gut microbiome with increased capacity for energy harvest. Nature. 2006;444(7122):1027–1031. doi:10.1038/nature05414. PMID: 17183312.
- Kim DJ, Yang J, Seo H, Lee WH, Ho Lee D, Kym S, Park YS, Kim JG, Jang IJ, Kim YK, et al. Colorectal cancer diagnostic model utilizing metagenomic and metabolomic data of stool microbial extracellular vesicles. Sci Rep. 2020;10(1):2860. doi:10.1038/s41598-020-59529-8. PMID: 32071370.
- Robertson BR, O’Rourke JL, Neilan BA, Vandamme P, On SL, Fox JG, Lee A. Mucispirillum schaedleri gen. nov., sp. nov., a spiral-shaped bacterium colonizing the mucus layer of the gastrointestinal tract of laboratory rodents. Int J Syst Evol Microbiol. 2005;55(3):1199–1204. doi:10.1099/ijs.0.63472-0. PMID: 15879255.
- Herp S, Brugiroux S, Garzetti D, Ring D, Jochum LM, Beutler M, Eberl C, Hussain S, Walter S, Gerlach RG, et al. Mucispirillum schaedleri antagonizes Salmonella virulence to protect mice against colitis. Cell Host Microbe. 2019;25(5):681–694.e8. doi:10.1016/j.chom.2019.03.004. PMID: 31006637.
- Caballero S, Carter R, Ke X, Sušac B, Leiner IM, Kim GJ, Miller L, Ling L, Manova K, Pamer EG. Distinct but spatially overlapping intestinal Niches for Vancomycin-Resistant Enterococcus faecium and Carbapenem-Resistant Klebsiella pneumoniae. PLoS Pathog. 2015;11(9):e1005132. doi:10.1371/journal.ppat.1005132. PMID: 26334306.
- Janney A, Powrie F, Mann EH. Host-microbiota maladaptation in colorectal cancer. Nature. 2020;585(7826):509–517. doi:10.1038/s41586-020-2729-3. PMID: 32968260.
- Chanmee T, Ontong P, Konno K, Itano N. Tumor-associated macrophages as major players in the tumor microenvironment. Cancers (Basel). 2014;6(3):1670–1690. doi:10.3390/cancers6031670. PMID: 25125485.
- Yoshida K, Matsumoto T, Tateda K, Uchida K, Tsujimoto S, Yamaguchi K. Induction of interleukin-10 and down-regulation of cytokine production by Klebsiella pneumoniae capsule in mice with pulmonary infection. J Med Microbiol. 2001;50(5):456–461. doi:10.1099/0022-1317-50-5-456. PMID: 11339254.
- Greenberger MJ, Strieter RM, Kunkel SL, Danforth JM, Goodman RE, Standiford TJ. Neutralization of IL-10 increases survival in a murine model of Klebsiella pneumonia. J Immunol. 1995;155(2):722–729. PMID: 7608550.
- Dolgachev VA, Yu B, Sun L, Shanley TP, Raghavendran K, Hemmila MR. Interleukin 10 overexpression alters survival in the setting of gram-negative pneumonia following lung contusion. Shock. 2014;41(4):301–310. doi:10.1097/shk.0000000000000123. PMID: 24430542.
- Berg DJ, Davidson N, Kühn R, Müller W, Menon S, Holland G, Thompson-Snipes L, Leach MW, Rennick D. Enterocolitis and colon cancer in interleukin-10-deficient mice are associated with aberrant cytokine production and CD4(+) TH1-like responses. J Clin Invest. 1996;98(4):1010–1020. doi:10.1172/jci118861. PMID: 8770874.
- Kühn R, Löhler J, Rennick D, Rajewsky K, Müller W. Interleukin-10-deficient mice develop chronic enterocolitis. Cell. 1993;75(2):263–274. doi:10.1016/0092-8674(93)80068-p. PMID: 8402911.
- Sturlan S, Oberhuber G, Beinhauer BG, Tichy B, Kappel S, Wang J, Rogy MA. Interleukin-10-deficient mice and inflammatory bowel disease associated cancer development. Carcinogenesis. 2001;22(4):665–671. doi:10.1093/carcin/22.4.665. PMID: 11285204.
- Saraiva M, O’Garra A. The regulation of IL-10 production by immune cells. Nat Rev Immunol. 2010;10(3):170–181. doi:10.1038/nri2711. PMID: 20154735.
- Dumigan A, Fitzgerald M, Santos JS-PG, Hamid U, O’Kane CM, McAuley DF, Bengoechea JA, Porcine A, Allen IC, Goldberg JB. A Porcine Ex Vivo lung perfusion model to investigate bacterial pathogenesis. mBio. 2019;10(6):e02802–19. doi:10.1128/mBio.02802-19. PMID: 31796543.
- Sica A, Mantovani A. Macrophage plasticity and polarization: in vivo veritas. J Clin Invest. 2012;122(3):787–795. doi:10.1172/JCI59643. PMID: 22378047.
- Liao X, Sharma N, Kapadia F, Zhou G, Lu Y, Hong H, Paruchuri K, Mahabeleshwar GH, Dalmas E, Venteclef N, et al. Krüppel-like factor 4 regulates macrophage polarization. J Clin Invest. 2011;121(7):2736–2749. doi:10.1172/JCI45444. PMID: 21670502.
- Liu J, Zhang H, Liu Y, Wang K, Feng Y, Liu M, Xiao X. KLF4 regulates the expression of interleukin-10 in RAW264.7 macrophages. Biochem Biophys Res Commun. 2007;362(3):575–581. doi:10.1016/j.bbrc.2007.07.157. PMID: 17719562.
- Fournier BM, Parkos CA. The role of neutrophils during intestinal inflammation. Mucosal Immunol. 2012;5(4):354–366. doi:10.1038/mi.2012.24. PMID: 22491176.
- Das P, Rampal R, Udinia S, Kumar T, Pilli S, Wari N, Ahmed IK, Kedia S, Gupta SD, Kumar D, et al. Selective M1 macrophage polarization in granuloma-positive and granuloma-negative Crohn’s disease, in comparison to intestinal tuberculosis. Intest Res. 2018;16(3):426–435. doi:10.5217/ir.2018.16.3.426. PMID: 30090042.
- Nishikawa K, Seo N, Torii M, Ma N, Muraoka D, Tawara I, Masuya M, Tanaka K, Takei Y, Shiku H, et al. Interleukin-17 induces an atypical M2-Like macrophage subpopulation that regulates intestinal inflammation. PLoS One. 2014;9(9):e108494. doi:10.1371/journal.pone.0108494. PMID: 25254662.
- Lu MC, Tang HL, Chiou CS, Wang YC, Chiang MK, Lai YC. Clonal dissemination of carbapenemase-producing Klebsiella pneumoniae: two distinct sub-lineages of sequence Type 11 carrying blaKPC-2 and blaOXA-48. Int J Antimicrob Agents. 2018;52(5):658–662. doi:10.1016/j.ijantimicag.2018.04.023. PMID: 29753130.
- Riddell RH, Goldman H, Ransohoff DF, Appelman HD, Fenoglio CM, Haggitt RC, Ahren C, Correa P, Hamilton SR, Morson BC, et al. Dysplasia in inflammatory bowel disease: standardized classification with provisional clinical applications. Hum Pathol. 1983;14(11):931–968. doi:10.1016/s0046-8177(83)80175-0. PMID: 6629368.
- Langmead B, Salzberg SL. Fast gapped-read alignment with Bowtie 2. Nat Methods. 2012;9(4):357–359. doi:10.1038/nmeth.1923. PMID: 22388286.
- Bolger AM, Lohse M, Usadel B. Trimmomatic: a flexible trimmer for illumina sequence data. Bioinformatics. 2014;30(15):2114–2120. doi:10.1093/bioinformatics/btu170. PMID: 24695404.
- Edgar RC. UPARSE: highly accurate OTU sequences from microbial amplicon reads. Nat Methods. 2013;10(10):996–998. doi:10.1038/nmeth.2604. PMID: 23955772.
- Yilmaz P, Parfrey LW, Yarza P, Gerken J, Pruesse E, Quast C, Schweer T, Peplies J, Ludwig W, Glöckner FO. The SILVA and “All-species Living Tree Project (LTP)” taxonomic frameworks. Nucleic Acids Res. 2013;42:D643–8. doi:10.1093/nar/gkt1209. PMID: 24293649.
- Caporaso JG, Kuczynski J, Stombaugh J, Bittinger K, Bushman FD, Costello EK, Fierer N, Peña AG, Goodrich JK, Gordon JI, et al. QIIME allows analysis of high-throughput community sequencing data. Nat Methods. 2010;7(5):335–336. doi:10.1038/nmeth.f.303. PMID: 20383131.
- Lozupone C, Knight R. UniFrac: a new phylogenetic method for comparing microbial communities. Appl Environ Microbiol. 2005;71:8228–8235. doi:10.1128/aem.71.12.8228-8235.2005. PMID: 16332807.
- Chong J, Soufan O, Li C, Caraus I, Li S, Bourque G, Wishart DS, Xia J. MetaboAnalyst 4.0: towards more transparent and integrative metabolomics analysis. Nucleic Acids Res. 2018;46(W1):W486–94. doi:10.1093/nar/gky310. PMID: 29762782.
- Anderson MJ. A new method for non-parametric multivariate analysis of variance. Aust Ecol. 2008;26(1):32–46. doi:10.1111/j.1442-9993.2001.01070.pp.x.
- National Research Council (US) Committee for the Update of the Guide for the Care and Use of Laboratory Animals. Guide for the care and use of laboratory animals 8th. Washington (DC): National Academies Press (US); 2011. doi:10.17226/12910. PMID: 21595115.